Python直方图、均衡化、高斯滤波(作业一)
Python直方图、均衡化、高斯滤波
- 测试原图
- 直方图
-
- 基本原理
- matplotlib库绘制直方图
- RGB三通道直方图
- 直方图均衡化
-
- 基本原理
- PCV库完成直方图均衡化
- 高斯滤波
-
- 基本原理
- opencv高斯滤波实现
测试原图

直方图
基本原理
什么是直方图:图像的直方图描述图像的灰度级和对应灰度级在图像中出现的次数(频率)的关系,通过直方图可以进行图像分割、检索、分类等操作
matplotlib库的hist函数:hist函数能够帮助绘制直方图。它的参数很多,这里用到前两个参数:x、bins。x参数表示一个像素的一维数组,如果是一维以上的数组可以使用flatten方法展平成一维,一般来说读入一幅图片都是一个二维的矩阵,都需要进行展平的操作。bins参数表示要显示直方图的柱数
假设有一个二维数组img=[[159,120,130],[100,84,92],[168,150,212]]。其数字表示图像的像素值,展平后img=[159,120,130,100,84,92,168,150,212],使用hist函数绘制出的直方图如下图。横轴表示像素值,纵轴表示该像素值出现的频率

opencv提供的cv2.calcHist()绘制直方图:calcHist函数需要传入读取的图片image;图像的通道channels,如果是灰度图像channels=0,如果分别是r、g、b通道,则传入0、1、2。
matplotlib库绘制直方图
课本代码
from PIL import Image
from pylab import *

# 解决中文乱码
plt.rcParams['font.sans-serif'] = 'SimHei'
plt.rcParams['axes.unicode_minus'] = False
#

im = array(Image.open('headimage.jpeg').convert('L'))  # 打开图像,并转成灰度图像
print(im)
figure()
subplot(121)
gray()
contour(im, origin='image')  #画图
axis('equal')  # 自动调整比例
axis('off')  # 去除x  y轴上的刻度
title(u'图像轮廓')

subplot(122)
# flatten()函数可以执行展平操作,返回一个一维数组
hist(im.flatten(), 128)
print(im.flatten())
title(u'图像直方图')
plt.xlim([0,260])
plt.ylim([0,11000])

show()
RGB三通道直方图
代码实现
import cv2
from matplotlib import pyplot as plt
img = cv2.imread('headimage.jpeg',1)

color = ('b','g','r')
for i,col in enumerate(color):
    histr = cv2.calcHist([img],[i],None,[256],[0,256])
    plt.plot(histr,color = col)
    plt.xlim([0,256])

plt.show()
直方图均衡化
基本原理
什么是直方图均衡化:直方图均衡化是利用图像的直方图对对比度进行调整,是图像增强的一种方法。从图片直观上看,均衡化后的图片对比度更强,更加清晰,特征更加明显;从直方图上看,均衡化后的图片的直方图灰度值出现的频率更加均匀。
如何均衡化直方图:
- 直方图均衡化首先要读取一张图片img,并计算该图片的直方图的值imhist(可以使用histogram函数)。
- 得到直方图的值后需要计算该直方图的累计直方图cdf(cdf[i]等于imhist[0]到imhist[i]的总和,可以使用cumsum函数直接得到)。
- 最后就是进行直方图的均衡化,对于图片第i行第j列的像素值img[i, j],利用公式 img[i, j] = cdf[ img[i,j] ] / (m*n)*255进行计算,得到均衡化后的像素值,然后再计算均衡化后的图片的直方图,就得到均衡化后的直方图
使用PCV库的histeq函数均衡化:传入图像im,返回均衡化后的直方图和累计直方图cdf。
PCV库完成直方图均衡化
课本代码
# -*- coding: utf-8 -*-
from PIL import Image
from pylab import *
from PCV.tools import imtools

# 添加中文字体支持
from matplotlib.font_manager import FontProperties
font = FontProperties(fname=r"c:\windows\fonts\SimSun.ttc", size=14)

im = array(Image.open('tire.jpg').convert('L'))  # 打开图像,并转成灰度图像
im2, cdf = imtools.histeq(im)

figure()
subplot(2, 2, 1)
axis('off')
gray()
title(u'原始图像', fontproperties=font)
imshow(im)

subplot(2, 2, 2)
axis('off')
title(u'直方图均衡化后的图像', fontproperties=font)
imshow(im2)

subplot(2, 2, 3)
axis('off')
title(u'原始直方图', fontproperties=font)
hist(im.flatten(), 128, density=True)

subplot(2, 2, 4)
axis('off')
title(u'均衡化后的直方图', fontproperties=font)
hist(im2.flatten(), 128, density=True)

show()
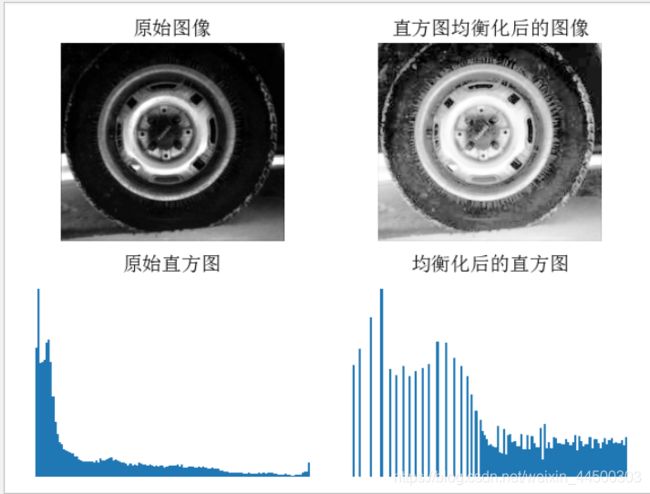
运行结果

通过运行结果可以得到,因为原图像整体较暗(黑),是的原图像的直方图在低像素上出现的频率较高,高像素的频率低。通过直方图均衡化后,图像整体变亮,观察直方图发现低像素的频率有所降低,而高像素的频率升高,使得图像有了更明显的对比度
高斯滤波
基本原理
什么是高斯滤波:高斯滤波是一种线性平滑滤波,它将正太分布用于图像处理,适用于消除高斯噪声,能够对图片进行模糊处理,使图像变得平滑,使图片产生模糊的效果。
高斯滤波原理:高斯滤波是用户指定一个模板,然后通过这个模板对图像进行卷积,所进行的卷积操作就是将模板中心周围的像素值进行加权平均后替换模板中心的像素值

opencv高斯滤波实现
代码实现
import cv2
import matplotlib.pyplot as plt

im=cv2.imread("tire.jpg")
# 高斯滤波
img_Guassian = cv2.GaussianBlur(im,(5,5),0)

plt.subplot(121)
plt.imshow(im)
plt.subplot(122)
plt.imshow(img_Guassian)

plt.show()


