数据来源:
来自kaggle的数据集Titanic:Titanic: Machine Learning from Disaster包含两个数据集train.csv和test.csv。
分析目的:
主要通过已有的数据集的几个维度,探索各维度数据与生存之间的关系,然后通过数据清洗,数据处理,建立模型预测test数据的生存情况。
数据探索:
变量字段释义:
PassengerId:乘客序号
Pclass:乘客等级
Name:乘客姓名
Sex:乘客性别
Age:乘客年龄
SibSp:乘客兄弟姐妹数
Parch:乘客父母子女数
Ticket:船票码
Fare:船费
Cabin:乘客仓号
Embarked:乘客乘船地点
导入数据后观察各变量的情况,发现Age列,Embarked列,Fare列,Cabin列存在缺失值
train.csv数据集变量探索:
PassengerId:
对于PassengerId变量,我们认为只是序号,姑且不考虑参与模型。
Pclass:
train_data['Survived'].value_counts().plot.pie(autopct='%1.1f%%')
plt.title('生存与遇难比')
生存与遇难者的比例为61.6%:38.4%≈1.6:1,正负样本比例能够接受,所以后续不用对样本进行采样。
pd.crosstab(train_data.Pclass,train_data.Survived).plot.bar()
plt.title('乘客等级与生存之间的关系')
图中我们可以得到随着等级从1-3变化,遇难几率会更大,当乘客的等级为1时存活率最高。
Sex:
train_data.groupby(['Sex','Survived'])['Survived'].count().plot(kind='bar')
plt.title('性别与生存之间的关系')
对于性别而言,女性的存活率要高于男性,符合当时欧洲‘女士优先’的观念,符合逻辑。
Age:
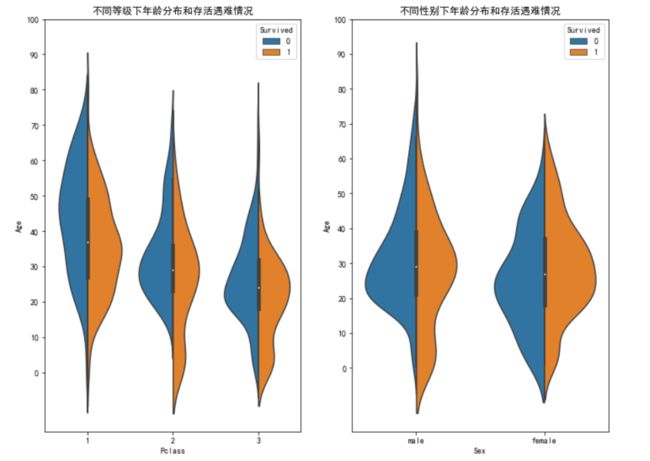
f,ax=plt.subplots(1,2,figsize=(12,9))
sns.violinplot("Pclass","Age", hue="Survived", data=train_data,split=True,ax=ax[0])
ax[0].set_title('Pclass and Age vs Survived')
ax[0].set_yticks(range(0,110,10))
sns.violinplot("Sex","Age", hue="Survived", data=train_data,split=True,ax=ax[1])
ax[1].set_title('Sex and Age vs Survived')
ax[1].set_yticks(range(0,110,10))
plt.show()
分析不同等级和性别下的年龄情况,发现总体而言,虽然乘客等级不同生存下来的人年龄都比遇难的要小。而对于性别,生存男性的年龄分布比遇难的小,女性由于’女士优先‘的缘故,使得存活的女性整体年龄分布要大于遇难女性。
Embarked:
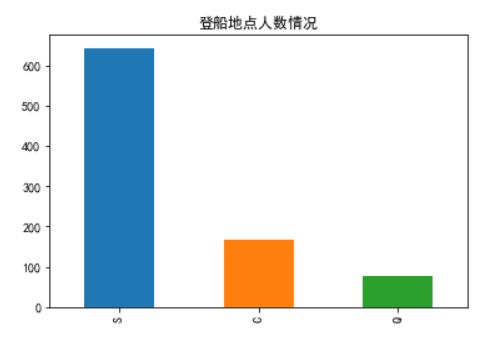
train_data.Embarked.value_counts().plot.bar()
plt.title('登船地点人数情况')
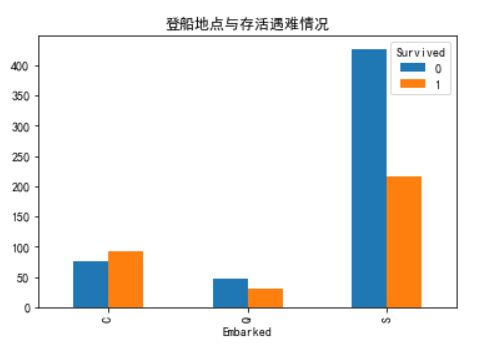
pd.crosstab(train_data.Embarked,train_data.Survived).plot.bar()
plt.title('登船地点与存活遇难情况')
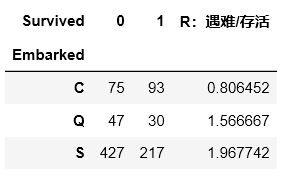
f=pd.crosstab(train_data.Embarked,train_data.Survived)
f['R:遇难/存活']=f[0]/f[1]
f
由图表可知在S地点登船的人遇难比率最高,C地点存活率最高
Parch & SibSp:
t,ax=plt.subplots(1,2,figsize=(12,8))
pd.crosstab(train_data.Parch,train_data.Survived).plot.bar(ax=ax[0])
ax[0].set_title('父母孩子与生存')
pd.crosstab(train_data.SibSp,train_data.Survived).plot.bar(ax=ax[1])
ax[1].set_title('兄弟姐妹与生存')
因为兄弟姐妹和父母孩子都算是亲属,我们尝试把他们结合起来:
pd.crosstab(train_data.Parch+train_data.SibSp+1,train_data.Survived).plot.bar()
算上自己所以加1
通过图表我们发现对于单独一人的生存率比较低。
Ticket & Fare:
通过观察数据集我们发现Ticket有单人票和团体票,若是团体票,每个人的Fare项显示的是团体票的价格。
数据清洗与处理:
由前面得知Ticket项和Fare项的关系以及数据处理在对train数据集处理后也要用同样的方法对test数据集处理,因此,我们把train数据集和test数据集结合在一起同时清理
train_data_temp = pd.read_csv(r'C:\Users\zhang\Desktop\train.csv')
test_data_temp = pd.read_csv(r'C:\Users\zhang\Desktop\test.csv')
test_data_temp['Survived'] = 0 #先对此赋值为0,后续drop掉
combined_train_test = train_data_temp.append(test_data_temp,sort=False)
对于缺失值:
Embarked:采用众数填充缺失值,由于Embarked项有三个取值,所以填充后用独立热编码处理
combined_train_test.Embarked[combined_train_test.Embarked.isnull()]=combined_train_test.Embarked.dropna().mode().values
emb_dummies_df = pd.get_dummies(combined_train_test['Embarked'],prefix='E')
combined_train_test = pd.concat([combined_train_test, emb_dummies_df], axis=1)
Sex:对原来的male和female做映射,映射成1和0
combined_train_test['Sex']=combined_train_test.Sex.map({'male':1,'female':0})
Age:同样采取众数填充缺失值
combined_train_test['Age']=combined_train_test['Age'].fillna(combined_train_test.Age.mean())
combined_train_test['Fare']=combined_train_test['Fare'].fillna(combined_train_test.Fare.mean())
SibSp & Parch:结合之前的探索分析,将两者结合成为新的变量Family_Size
combined_train_test['Family_Size'] = combined_train_test['Parch'] + combined_train_test['SibSp'] + 1
Ticket & Fare:通过前面的观察我们可以知道,因为团体票的存在和每个购买团体票的Fare是团体票的价格,因此将团体票的价格平摊到每个购买团体票的人的身上
combined_train_test['Group_Ticket'] = combined_train_test['Fare'].groupby(by=combined_train_test['Ticket']).transform('count')
combined_train_test['Fare'] = combined_train_test['Fare'] / combined_train_test['Group_Ticket']
combined_train_test.drop(['Group_Ticket'], axis=1, inplace=True)
Cabin:数据确实太多,因此去掉
Name:此项不纳入考虑
将多余和不纳入考虑的变量去掉
combined_train_test=combined_train_test.drop(['Cabin','Ticket','Name','Embarked','PassengerId'],axis=1)
重新检查一次我们数据集的情况:
清洗完毕,接下来将train数据集和test数据集分开,同时将原来添加的Survived项删除还原:
train_data = combined_train_test[:891]
test_data = combined_train_test[891:]

f_X_test = test_data.drop(['Survived'],axis=1)#原test测试集,改名f_X_test
数据建模:
考虑使用交叉验证,将测试数据集分为训练集和测试集
X = train_data.drop(['Survived'],axis=1)
y= train_data['Survived']
X_train, X_test, y_train, y_test = train_test_split(X, y, test_size=0.3, random_state=0)
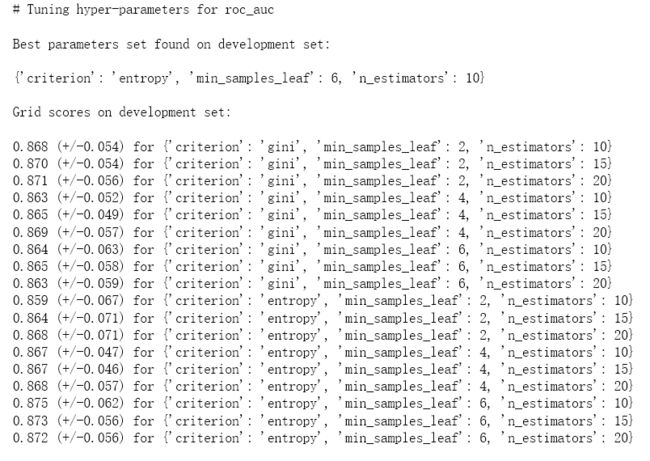
用GridSearchCv调参,得到最优参数和相关情况:
# Set the parameters by cross-validation

parameter_space = {

    "n_estimators": [10, 15, 20],

    "criterion": ["gini", "entropy"],

    "min_samples_leaf": [2, 4, 6],

}


#scores = ['precision', 'recall', 'roc_auc']

scores = ['roc_auc']


for score in scores:

    print("# Tuning hyper-parameters for %s" % score)

    print()


    clf = RandomForestClassifier(random_state=14)

    grid = GridSearchCV(clf, parameter_space, cv=5, scoring='%s' % score)

    #scoring='%s_macro' % score:precision_macro、recall_macro是用于multiclass/multilabel任务的

    grid.fit(X_train, y_train)


    print("Best parameters set found on development set:")

    print()

    print(grid.best_params_)

    print()

    print("Grid scores on development set:")

    print()

    means = grid.cv_results_['mean_test_score']

    stds = grid.cv_results_['std_test_score']

    for mean, std, params in zip(means, stds, grid.cv_results_['params']):

        print("%0.3f (+/-%0.03f) for %r"

              % (mean, std * 2, params))

    print()

    print("Detailed classification report:")

    print()

    print("The model is trained on the full development set.")

    print("The scores are computed on the full evaluation set.")

    print()

    bclf = grid.best_estimator_

    bclf.fit(X_train, y_train)

    y_true = y_test

    y_pred = bclf.predict(X_test)

    y_pred_pro = bclf.predict_proba(X_test)

    y_scores = pd.DataFrame(y_pred_pro, columns=bclf.classes_.tolist())[1].values

    print(classification_report(y_true, y_pred))

    auc_value = roc_auc_score(y_true, y_scores)

    #绘制ROC曲线

fpr, tpr, thresholds = roc_curve(y_true, y_scores, pos_label=1.0)

plt.figure()

lw = 2

plt.plot(fpr, tpr, color='darkorange', linewidth=lw, label='ROC curve (area = %0.4f)' % auc_value)

plt.plot([0, 1], [0, 1], color='navy', linewidth=lw, linestyle='--')

plt.xlim([0.0, 1.0])

plt.ylim([0.0, 1.05])

plt.xlabel('False Positive Rate')

plt.ylabel('True Positive Rate')

plt.title('Receiver operating characteristic example')

plt.legend(loc="lower right")

plt.show()
参数信息:
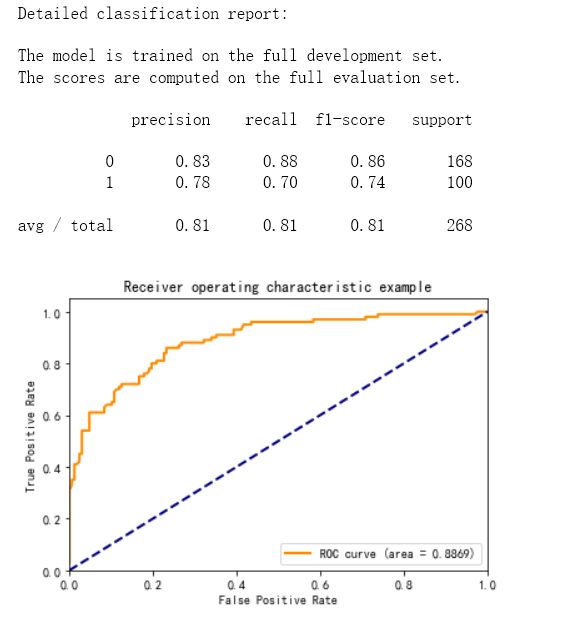
因为Roc值0.8869,结果还可以,因而对搜索出来的参数建模:
clf = RandomForestClassifier(criterion='entropy', min_samples_leaf= 6, n_estimators= 10,random_state=14)

clf.fit(X_train,y_train)

accuracy_score(y_test, clf.predict(X_test))
准确率0.813
对测试集拟合得到的模型精确率0.81
召回率0.81
F1score:0.81
最后将test数据集(改名为f_X_test )predict即可获得生存情况。
f_y_Pred=clf.predict(f_X_test)


