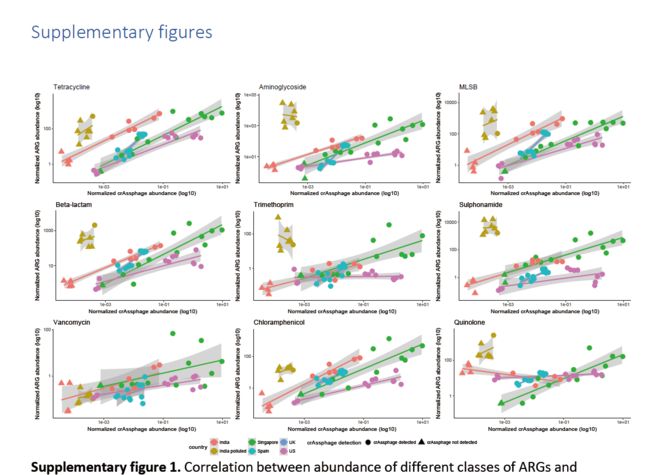
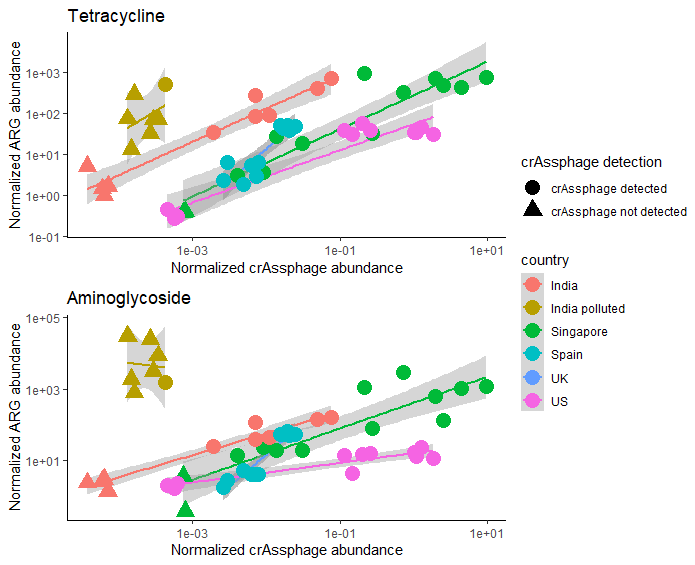
今天继续 跟着Nature Communications学画图系列第五篇。学习R语言ggplot2包画图。然后多个图拼接到一起。对应的是论文中的补充材料图一。
对应的 Nature Communications 的论文是 Fecal pollution can explain antibiotic resistance gene abundances in anthropogenically impacted environments
这篇论文数据分析和可视化的部分用到的数据和代码全部放到了github上 https://github.com/karkman/crassphage_project
非常好的R语言学习素材。
ggplot2画图后多个图拼接到一起,我目前知道的有三个包可以实现。
第一个是ggpubr,对应的函数是ggarrange()
第二个是cowplot,对应的函数是plot_grid()
第三个是aplot,对应的函数是insert_bottom() right()top()left()
这个论文里提供的拼图方法是自定义了一个函数,函数是
grid_arrange_shared_legend <- function(..., ncol = length(list(...)), nrow = 1,
                                       position = c("bottom", "right")) {
  require(gridExtra)
  require(grid)
  plots <- list(...)
  position <- match.arg(position)
  g <- ggplotGrob(plots[[1]] + theme(legend.position = position))$grobs
  legend <- g[[which(sapply(g, function(x) x$name) == "guide-box")]]
  lheight <- sum(legend$height)
  lwidth <- sum(legend$width)
  gl <- lapply(plots, function(x) x + theme(legend.position="none"))
  gl <- c(gl, ncol = ncol, nrow = nrow)

  combined <- switch(position,
                     "bottom" = arrangeGrob(do.call(arrangeGrob, gl),
                                            legend,
                                            ncol = 1,
                                            heights = unit.c(unit(1, "npc") - lheight, lheight)),
                     "right" = arrangeGrob(do.call(arrangeGrob, gl),
                                           legend,
                                           ncol = 2,
                                           widths = unit.c(unit(1, "npc") - lwidth, lwidth)))
  grid.newpage()
  grid.draw(combined)
  # return gtable invisibly
  invisible(combined)
}
这个函数我有的地方还看不太懂,但是不影响使用,直接复制过来套用就可以了
用这个函数需要指定拼图的对象,指定几行几列,指定图例的位置,图例的位置只有右和下可以选。这个函数有一个好处是可以共享图例
下面试一下他的代码
首先是读入数据
crass_categ <- read.table("data/crAss_categ.txt")
加载ggplot2
library(ggplot2)
分别作图
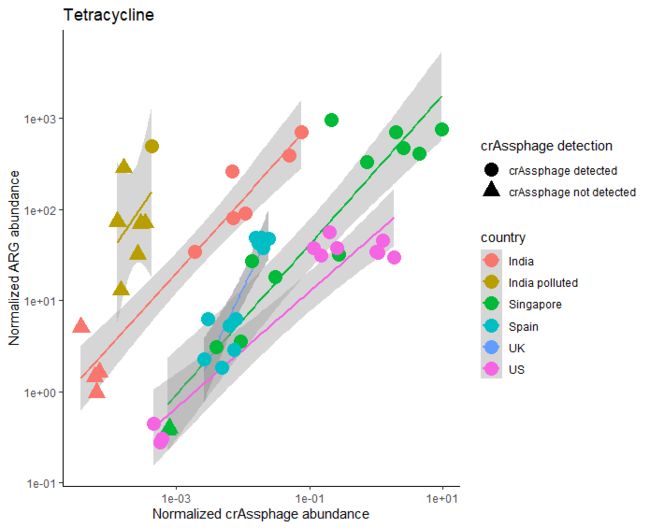
p1 <- ggplot(crass_categ, aes(rel_crAss, rel_tet, color=country)) +
  geom_smooth(method="lm") +
  geom_point(aes(shape=crAss_detection), size=5) +
  scale_x_log10() + scale_y_log10() +
  labs(y = "Normalized ARG abundance", x="Normalized crAssphage abundance",
       title="Tetracycline", shape="crAssphage detection") +
  theme_classic()
p1
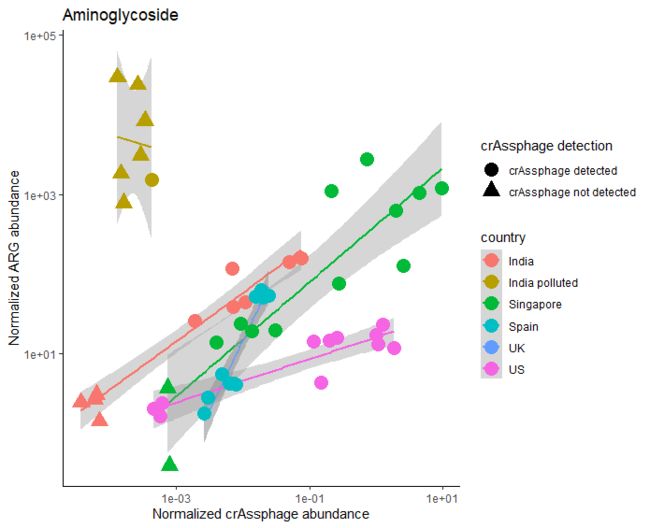
p2 <- ggplot(crass_categ, aes(rel_crAss, rel_amino, color=country))  +
  geom_smooth(method="lm") +
  geom_point(aes(shape=crAss_detection), size=5) +
  scale_x_log10() + scale_y_log10() +
  labs(y = "Normalized ARG abundance", x="Normalized crAssphage abundance",
       title="Aminoglycoside", shape="crAssphage detection") +
  theme_classic()
p2
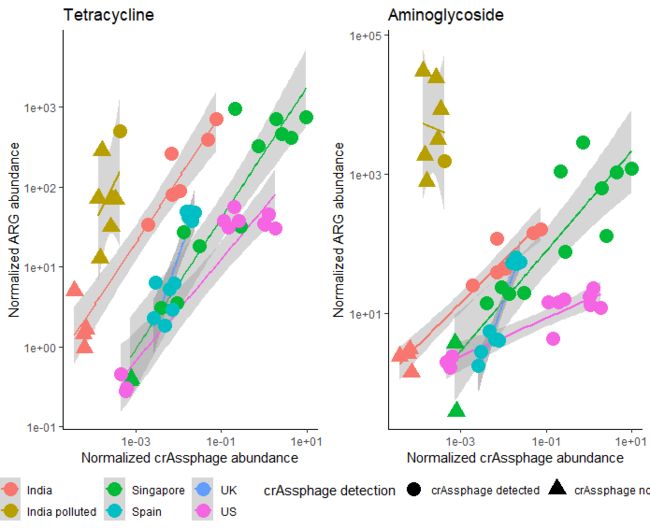
两幅图如果按照一行两列来拼的话,图例位置参数不写,默认的是放下面
grid_arrange_shared_legend(p1,p2,ncol=2,nrow=1)
图例放到右面去直接加一个position参数就可以了
grid_arrange_shared_legend(p1,p2,ncol=1,nrow=2,
                           position = "right")
今天的内容主要的收获是知道了一个自定义的拼图函数。如果有需要的话可以直接拿来使用。
欢迎大家关注我的公众号
小明的数据分析笔记本
