使用pandas对数据进行处理时的DataFrame的小技巧(一)
下面的例子都以train_df举例,因为常用于观察训练集数据的特征
1、从整个DataFrame中找出数值为数字的列:
train_df.select_dtypes(include=np.number)如果再进一步,只想获取列值为数字的列名:
train_df.select_dtypes(include=np.number).columns.values注意,上面返回的是一个nd.array类型的数组,那么你可以转成列表来做其他的处理:
list(train_df.select_dtypes(include=np.number).columns.values)这样就能获取某个DataFrame中的值为数值类型的列名!
2、获取DataFrame的总览信息(可以对数据有一个大体的认识,并且可以观察到是否有空缺的行)
train_df.describe().T可以对数据有一个总览的观察
注意:这里使用了T进行转置,因为转置过后的矩阵更方便我们观察!
还有一点:这里能得到的信息只有是值为数值类型的列的信息!
3、判断DataFrame中是否有空值
train_df['列名'].isnull().any()如果有空值,那么就返回True,否则返回False
注意:这个方法可以在数值类型的列进行处理,也适用于非数值的列!
4、获取DataFrame中到底有多少空值
train_df.isnull().values.sum()返回值为一个具体的值!统计了在这个DataFrame中空值个数。
is_null()函数可以将train_df中的非空值替换为False,空值替换为True
然后使用values来获取一个ndarray类型的数组
最后使用sum()函数,统计里面为True的总数
总结:是一个很实用的小技巧
如果不使用values属性,可以获得下面的结果:
train_df.isnull().sum()5、获取DataFrame中的空值都分布在哪些列中
 with pd.option_context('display.max_rows',None,'display.max_rows',None):
        print(train_df.isna().sum())
6、对DataFrame中的数值列进行可视化,观察其中的空值分布
import missingno as msno
import matplotlib.pyplot as plt
#num_vals存储所有列值为数值的列名
msno.matrix(train_df[num_vals])
plt.show()
可以通过使用missingno库,对DataFrame中的数据进行可视化观察分布
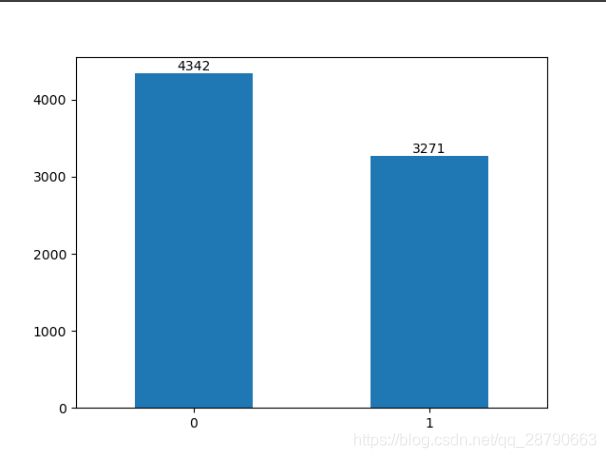
7、统计一下数据集里面的标签分布,然后可视化
train_df['target'].value_counts()上面的代码就可以对训练集的标签(target)列进行统计,可以看到标签为0的有4342个,标签为1的有3271条。
#可视化
plt.figure()
ax = train['target'].value_counts().plot.bar()
#在条形图顶部显示数字
for p in ax.patches:
    print(p)
    ax.annotate(np.round(p.get_height(),decimals=2),
                ((p.get_x()+p.get_width()/2.0),p.get_height()),
                ha='center',
                va='center',
                xytext=(0,5),
                textcoords='offset points')
plt.xticks(rotation=360)
plt.show()
8\


