6.4.1 条形图简介
条形图( bar diagram)是用一个单位长度表示一定的数量,根据数量的多少画成长短不同的直条。 其优点是非常直观的比较出各种属性统计值的标量。
6.4.2 条形图的绘制
快速绘制条形图
以电影数据集为例,本数据集fandango_scores.csv可以从网站上下载(地址www.joy888.com)。通过数据集可视化处理,可以直观的看出不同的电影评分网站对同一电影的评分比较。
首先利用Pandas库读取数据集,示例代码:
import pandas as pd
reviews = pd.read_csv("fandango_scores.csv")
cols = ['FILM', 'RT_user_norm', 'Metacritic_user_nom', 'IMDB_norm', 'Fandango_Ratingvalue', 'Fandango_Stars']
norm_reviews = reviews[cols]
print(norm_reviews[:1])
运行结果:
                             FILM  RT_user_norm  Metacritic_user_nom  \
0  Avengers: Age of Ultron (2015)           4.3                 3.55

   IMDB_norm  Fandango_Ratingvalue  Fandango_Stars
0        3.9                   4.5             5.0
由结果可以看出,5个不同的电影网站对同一电影(Avengers:Age of Ultron)的评分值。
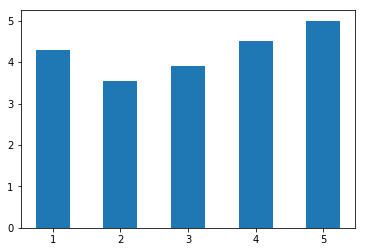
下面引入matplotlib库并绘制条形图,条形图需要利用子图对象的bar方法,其中bar参数需要设定条形图的起始位置(即与原点的距离),以及每个条形长度(bar_heights)和粗度,示例代码:
import matplotlib.pyplot as plt
from numpy import arange
num_cols = ['RT_user_norm', 'Metacritic_user_nom', 'IMDB_norm', 'Fandango_Ratingvalue', 'Fandango_Stars']
bar_heights = norm_reviews.ix[0, num_cols].values        # 定义条形的高度
bar_positions = arange(5)+1        # 定义条形距离原点的距离
fig,ax = plt.suplots()
ax.bar(bar_positions, bar_heights, 0.5)        # 0.5表示定义条形的粗度
plt.show()
显示结果:
条形图细化
下面,对以上条形图进行细化,要指明图形的名称(set_title),x轴(set_xlabel)和y轴(set_ylabel)的定义,以及x轴的刻度(set_xticks或者set_xticklabels),示例代码:
num_cols = ['RT_user_norm', 'Metacritic_user_nom', 'IMDB_norm', 'Fandango_Ratingvalue', 'Fandango_Stars']
bar_heights = norm_reviews.ix[0, num_cols].values
bar_positions = arange(5) + 1
tick_positions = range(1,6)
fig, ax = plt.subplots()

ax.bar(bar_positions, bar_heights, 0.5)
ax.set_xticks(tick_positions)
ax.set_xticklabels(num_cols, rotation=45)

ax.set_xlabel('Rating Source')
ax.set_ylabel('Average Rating')
ax.set_title('Average User Rating For Avengers: Age of Ultron (2015)')
plt.show()
显示结果:
水平条形图
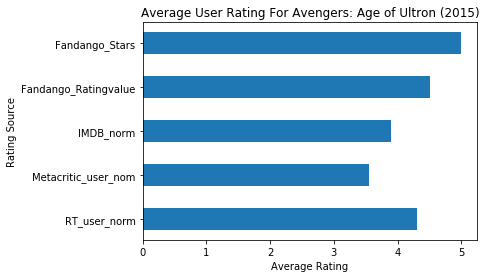
以上绘制的是垂直条形图,我们可以利用matplotlib库的barh方法绘制水平条形图,其中每个条形的长度由bar_height修改为bar_width,x轴和y轴的参数对调,示例代码:
import matplotlib.pyplot as plt
from numpy import arange
num_cols = ['RT_user_norm', 'Metacritic_user_nom', 'IMDB_norm', 'Fandango_Ratingvalue', 'Fandango_Stars']

bar_widths = norm_reviews.ix[0, num_cols].values
bar_positions = arange(5) + 1
tick_positions = range(1,6)
fig, ax = plt.subplots()
ax.barh(bar_positions, bar_widths, 0.5)

ax.set_yticks(tick_positions)
ax.set_yticklabels(num_cols)
ax.set_ylabel('Rating Source')
ax.set_xlabel('Average Rating')
ax.set_title('Average User Rating For Avengers: Age of Ultron (2015)')
plt.show()
显示结果:


