python掷骰子_Python入门案例(七):模拟掷骰子
一、模拟掷骰子V1.0
主要知识点:
- random库:生成随机数
- enumerate()函数:用于将可遍历的组合转换为一个索引序列,一般用于for循环中,同时列出元素和元素的索引号
# -*- coding:utf-8 -*-
"""
@author:Angel
@file:lect08_V1.0.py
@time:2018/11/27 16:09
@1.0功能:模拟掷骰子
"""
import random


def roll_dice():
    # 模拟掷骰子
    roll = random.randint(1, 6)
    return roll


def main():
    total_times = 50
    # 初始化列表
    result_list = [0] * 6

    for i in range(total_times):
        roll = roll_dice()
        for j in range(1, 7):
            if roll == j:
                result_list[j - 1] += 1

    for i, result in enumerate(result_list):
        print('点数{}的次数:{},频率:{}'.format(i+1, result, result / total_times))


if __name__ == '__main__':
    main()
二、模拟掷骰子V2.0
主要知识点:
- zip()函数:用于将对应的元素打包成一个个元组
# -*- coding:utf-8 -*-
"""
@author:Angel
@file:lect08_V2.0.py
@time:2018/11/27 16:09
@1.0功能:模拟掷1个骰子,并输出其结果
@2.0功能:模拟掷2个骰子,并输出其结果
"""
import random


def roll_dice():
    # 模拟掷骰子
    roll = random.randint(1, 6)
    return roll


def main():
    total_times = 1000
    # 初始化列表
    result_list = [0] * 11
    roll_list = list(range(2, 13))
    roll_dict = dict(zip(roll_list, result_list))

    for i in range(total_times):
        roll1 = roll_dice()
        roll2 = roll_dice()
        for j in range(2, 13):
            if roll1 + roll2 == j:
                roll_dict[j] += 1

    for i, result in roll_dict.items():
        print('点数{}的次数:{},频率:{}'.format(i, result, result / total_times))


if __name__ == '__main__':
    main()
三、模拟掷骰子V3.0
主要知识点:
- Python数据可视化:matplotlib模块
- 子模块pyplot提供了2D图表制作的基本函数
# -*- coding:utf-8 -*-
"""
@author:Angel
@file:lect08_V3.0.py
@time:2018/11/27 16:09
@1.0功能:模拟掷1个骰子,并输出其结果
@2.0功能:模拟掷2个骰子,并输出其结果
@3.0功能:可视化输出掷2个骰子的结果
"""
import random
import matplotlib.pyplot as plt


def roll_dice():
    # 模拟掷骰子
    roll = random.randint(1, 6)
    return roll


def main():
    total_times = 100
    # 初始化列表
    result_list = [0] * 11
    roll_list = list(range(2, 13))
    roll_dict = dict(zip(roll_list, result_list))

    # 记录骰子的结果
    roll1_list = []
    roll2_list = []

    for i in range(total_times):
        roll1 = roll_dice()
        roll2 = roll_dice()

        roll1_list.append(roll1)
        roll2_list.append(roll2)

        for j in range(2, 13):
            if roll1 + roll2 == j:
                roll_dict[j] += 1

    for i, result in roll_dict.items():
        print('点数{}的次数:{},频率:{}'.format(i, result, result / total_times))

    # 数据可视化
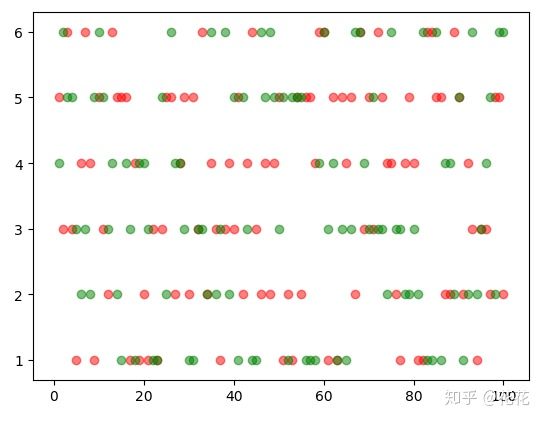
    x = range(1, total_times+1)
    plt.scatter(x, roll1_list, c='red', alpha=0.5)
    plt.scatter(x, roll2_list, c='green', alpha=0.5)
    plt.show()


if __name__ == '__main__':
    main()
图形如下:
四、模拟掷骰子V4.0
主要知识点:简单的数据分析
# -*- coding:utf-8 -*-
"""
@author:Angel
@file:lect08_V4.0.py
@time:2018/11/27 16:09
@1.0功能:模拟掷1个骰子,并输出其结果
@2.0功能:模拟掷2个骰子,并输出其结果
@3.0功能:可视化输出掷2个骰子的结果
@4.0功能:对结果进行简单的数据统计和分析,直方图
"""
import random
import matplotlib.pyplot as plt

# 解决中文显示的问题
plt.rcParams['font.sans-serif'] = ['SimHei']
plt.rcParams['axes.unicode_minus'] = False


def roll_dice():
    # 模拟掷骰子
    roll = random.randint(1, 6)
    return roll


def main():
    total_times = 100

    # 记录骰子的结果
    roll_list = []

    for i in range(total_times):
        roll1 = roll_dice()
        roll2 = roll_dice()

        roll_list.append(roll1+roll2)

    # 数据可视化,直方图
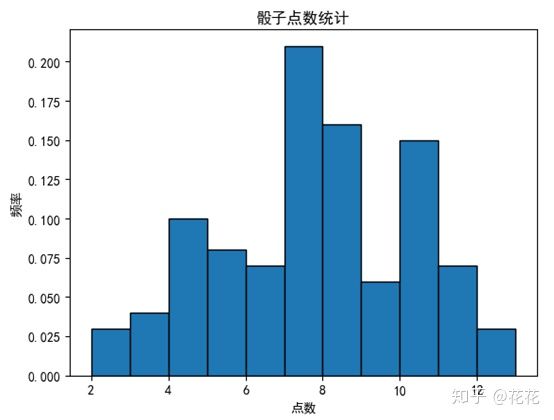
    plt.hist(roll_list, bins=range(2, 14), normed=1, edgecolor='black', linewidth=1)
    plt.title('骰子点数统计')
    plt.xlabel('点数')
    plt.ylabel('频率')
    plt.show()


if __name__ == '__main__':
    main()
直方图:
五、模拟掷骰子V5.0
主要知识点:科学计算库NumPy
# -*- coding:utf-8 -*-
"""
@author:Angel
@file:lect08_V5.0.py
@time:2018/11/27 16:09
@1.0功能:模拟掷1个骰子,并输出其结果
@2.0功能:模拟掷2个骰子,并输出其结果
@3.0功能:可视化输出掷2个骰子的结果
@4.0功能:对结果进行简单的数据统计和分析,直方图
@5.0功能:使用科学计算库简化程序,完善数据可视化结果
"""
import matplotlib.pyplot as plt
import numpy as np

# 解决中文显示的问题
plt.rcParams['font.sans-serif'] = ['SimHei']
plt.rcParams['axes.unicode_minus'] = False


def main():
    total_times = 100

    # 记录骰子的结果
    roll1_arr = np.random.randint(1, 7, size=total_times)
    roll2_arr = np.random.randint(1, 7, size=total_times)
    result_arr = roll1_arr + roll2_arr

    hist, bins = np.histogram(result_arr, bins=range(2, 14))
    print(hist)
    print(bins)

    # 数据可视化,直方图
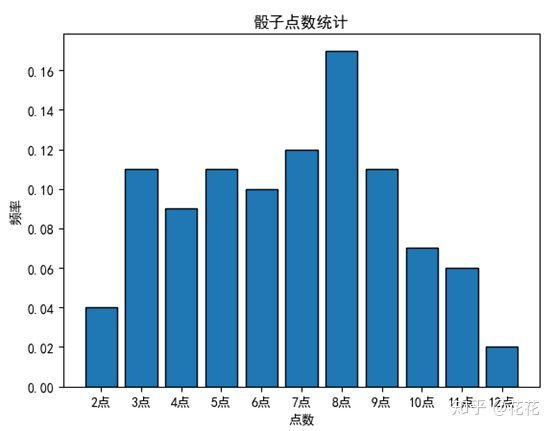
    plt.hist(result_arr, bins=range(2, 14), normed=1, edgecolor='black', linewidth=1, rwidth=0.8)

    # 设置X轴坐标点
    tick_labels = ['2点', '3点', '4点', '5点', '6点', '7点', '8点', '9点', '10点', '11点', '12点']
    tick_pos = np.arange(2, 13)+0.5
    plt.xticks(tick_pos, tick_labels)

    plt.title('骰子点数统计')
    plt.xlabel('点数')
    plt.ylabel('频率')
    plt.show()


if __name__ == '__main__':
    main()
直方图:


