matplotlib实现直方图hist和折线图
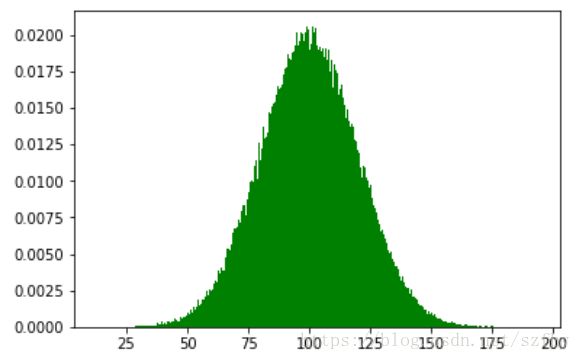
单变量直方图
import numpy as np
import matplotlib.pyplot as plt

mu = 100 # mean of distribution
sigma = 20 #standard deviatioin of distribution
x = mu + sigma * np.random.randn(200000)
#绘制单变量的直方图
plt.hist(x, bins=500, color='green', normed=True)
plt.show()
双变量直方图
import numpy as np
import matplotlib.pyplot as plt

#双变量联合分布直方图
x = np.random.randn(1000) + 2
y = np.random.randn(1000) + 3

plt.hist2d(x, y, bins=40)
plt.show()
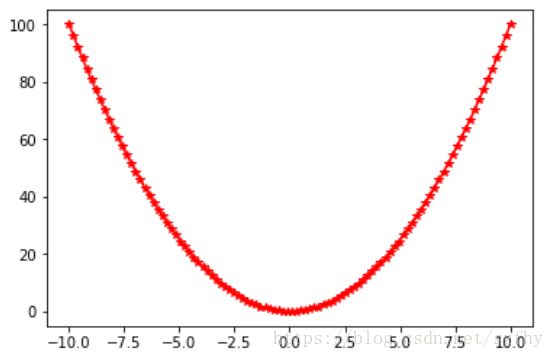
折线图
import numpy as np
import matplotlib.pyplot as plt

x = np.linspace(-10,10,100)
y = x**2
plt.plot(x,y,c='r',marker='*')
plt.show()

