说明:仅根据官网指南加个人理解,目前官网上发布了3.0版本的指南,下面内容是2.4版本,内容上有些许出入。
整合分析的目的:
1. 鉴定在两种数据集中都存在的细胞类型
2. 得到在实验组和对照组中都存在细胞类型markers
3. 将两种数据集进行对比,找到对刺激特异性反应的细胞类型
1.构建Seurat对象
library(Seurat)
#导入数据
ctrl.data <- read.table("~/Downloads/immune_control_expression_matrix.txt.gz", sep = "\t")
stim.data <- read.table("~/Downloads/immune_stimulated_expression_matrix.txt.gz", sep = "\t")

#对control对象进行处理
#创建Seurat对象,min.cells参数控制一个基因至少在5个细胞中被检测到
ctrl <- CreateSeuratObject(raw.data = ctrl.data, project = "IMMUNE_CTRL", min.cells = 5)

#对ctrl对象设定标签,后面作图的时候会用到
[email protected]$stim <- "CTRL"

#根据基因的表达过滤细胞,筛选出至少有00个基因的细胞
ctrl <- FilterCells(ctrl, subset.names = "nGene", low.thresholds = 500, high.thresholds = Inf)

#数据标准化
ctrl <- NormalizeData(ctrl)
ctrl <- ScaleData(ctrl, display.progress = F)

#对stim组进行相同的处理
stim <- CreateSeuratObject(raw.data = stim.data, project = "IMMUNE_STIM", min.cells = 5)
[email protected]$stim <- "STIM"
stim <- FilterCells(stim, subset.names = "nGene", low.thresholds = 500, high.thresholds = Inf)
stim <- NormalizeData(stim)
stim <- ScaleData(stim, display.progress = F)

#挑选差异基因进行后续的CCA分析
ctrl <- FindVariableGenes(ctrl, do.plot = F)
stim <- FindVariableGenes(stim, do.plot = F)
g.1 <- head(rownames([email protected]), 1000)
g.2 <- head(rownames([email protected]), 1000)
genes.use <- unique(c(g.1, g.2))
genes.use <- intersect(genes.use, rownames([email protected]))
genes.use <- intersect(genes.use, rownames([email protected]))
2.进行CCA分析
#CCA类似于PCA,降维的一种方法
#RunCCA这一个函数将两个对象整合成一个对象
#num.cc指的是Number of canonical vectors to calculate
immune.combined <- RunCCA(ctrl, stim, genes.use = genes.use, num.cc = 30)
#可视化CCA结果
#reduction.use参数表示选用哪一种降维的方法,默认是pca,还可以选择tsne、ica、cca
#features.plot参数表示用来展示的特征(这里是CC1),可以是基因表达、pc分数等
p1 <- DimPlot(object = immune.combined, reduction.use = "cca", group.by = "stim", pt.size = 0.5, do.return = TRUE)
p2 <- VlnPlot(object = immune.combined, features.plot = "CC1", group.by = "stim", do.return = TRUE)
plot_grid(p1, p2)

#这一步可以查看定义特定CC的基因
PrintDim(object = immune.combined, reduction.type = "cca", dims.print = 1:2, genes.print = 10)

#根据曲线的走势确定
#根据下方的图,选定CC1-20进行分析
p3 <- MetageneBicorPlot(immune.combined, grouping.var = "stim", dims.eval = 1:30, display.progress = FALSE)

#用DimHeatmap函数查看每一个CC中的top gene对细胞分群的影响
#这里查看的是9个CC
DimHeatmap(object = immune.combined, reduction.type = "cca", cells.use = 500, dim.use = 1:9, do.balanced = TRUE)

4.整合分析
#reduction.use参数指的是选择降维方法,默认是pca
#dims.use参数指的是上述选择的CC个数
#resolution参数指的是分辨率,越大群分的越细
immune.combined <- RunTSNE(immune.combined, reduction.use = "cca.aligned", dims.use = 1:20, do.fast = T)
immune.combined <- FindClusters(immune.combined, reduction.type = "cca.aligned", resolution = 0.6, dims.use = 1:20)

# 可视化
p1 <- TSNEPlot(immune.combined, do.return = T, pt.size = 0.5, group.by = "stim")
p2 <- TSNEPlot(immune.combined, do.label = T, do.return = T, pt.size = 0.5)
plot_grid(p1, p2)

5.鉴定保守的细胞类型marker
#这一步是鉴定在不同条件下都保守的细胞类型marker
nk.markers <- FindConservedMarkers(immune.combined, ident.1 = 7, grouping.var = "stim", print.bar = FALSE)
head(nk.markers)

#查看特定基因在细胞群的表达情况
FeaturePlot(object = immune.combined, features.plot = c("CD3D", "SELL", "CREM", "CD8A", "GNLY", "CD79A", "FCGR3A", "CCL2", "PPBP"), min.cutoff = "q9", cols.use = c("lightgrey", "blue"), pt.size = 0.5)

#在所有群当中查看特定基因的表达和占比情况
#确定细胞群类型
immune.combined@ident <- factor(immune.combined@ident, levels = (c("pDC", "Eryth", "Mk", "DC", "CD14 Mono", "CD16 Mono", "B activated", "B", "CD8 T", "NK", "T activated", "CD4 Naive T", "CD4 Memory T")))
#确定基因
markers.to.plot <- c("CD3D", "CREM", "HSPH1", "SELL", "GIMAP5", "CACYBP", "GNLY", "NKG7", "CCL5", "CD8A", "MS4A1", "CD79A", "MIR155HG", "NME1", "FCGR3A", "VMO1", "CCL2", "S100A9", "HLA-DQA1", "GPR183", "PPBP", "GNG11", "HBA2", "HBB", "TSPAN13", "IL3RA", "IGJ")
#出图
sdp <- SplitDotPlotGG(immune.combined, genes.plot = rev(markers.to.plot), cols.use = c("blue", "red"), x.lab.rot = T, plot.legend = T, dot.scale = 8, do.return = T, grouping.var = "stim")

6.鉴定在不同条件下差异表达的基因
方法一:
#一种方法就是分别查看实验组和对照组的基因表达情况的平均值,以此为依据,鉴定出离群的基因
#这一部分主要是构建函数用于后续分析的使用
LabelPoint <- function(plot, genes, exp.mat, adj.x.t = 0, adj.y.t = 0, adj.x.s = 0,
    adj.y.s = 0, text.size = 2.5, segment.size = 0.1) {
    for (i in genes) {
        x1 <- exp.mat[i, 1]
        y1 <- exp.mat[i, 2]
        plot <- plot + annotate("text", x = x1 + adj.x.t, y = y1 + adj.y.t,
            label = i, size = text.size)
        plot <- plot + annotate("segment", x = x1 + adj.x.s, xend = x1, y = y1 +
            adj.y.s, yend = y1, size = segment.size)
    }
    return(plot)
}

LabelUR <- function(plot, genes, exp.mat, adj.u.t = 0.1, adj.r.t = 0.15, adj.u.s = 0.05,
    adj.r.s = 0.05, ...) {
    return(LabelPoint(plot, genes, exp.mat, adj.y.t = adj.u.t, adj.x.t = adj.r.t,
        adj.y.s = adj.u.s, adj.x.s = adj.r.s, ...))
}

LabelUL <- function(plot, genes, exp.mat, adj.u.t = 0.1, adj.l.t = 0.15, adj.u.s = 0.05,
    adj.l.s = 0.05, ...) {
    return(LabelPoint(plot, genes, exp.mat, adj.y.t = adj.u.t, adj.x.t = -adj.l.t,
        adj.y.s = adj.u.s, adj.x.s = -adj.l.s, ...))
}
#挑选出实验组和对照组中特定的细胞亚群(这里是CD4 Naive T和CD14 Mono)
#算出这一亚群基因表达的平均值,标记出已知的对实验敏感的基因
t.cells <- SubsetData(immune.combined, ident.use = "CD4 Naive T", subset.raw = T)
t.cells <- SetAllIdent(t.cells, id = "stim")
avg.t.cells <- log1p(AverageExpression(t.cells, show.progress = FALSE))
avg.t.cells$gene <- rownames(avg.t.cells)

cd14.mono <- SubsetData(immune.combined, ident.use = "CD14 Mono", subset.raw = T)
cd14.mono <- SetAllIdent(cd14.mono, id = "stim")
avg.cd14.mono <- log1p(AverageExpression(cd14.mono, show.progress = FALSE))
avg.cd14.mono$gene <- rownames(avg.cd14.mono)

genes.to.label1 = c("ISG15", "LY6E", "IFI6", "ISG20", "MX1")
genes.to.label2 = c("IFIT2", "IFIT1")
genes.to.label3 = c("CXCL10", "CCL8")
p1 <- ggplot(avg.t.cells, aes(CTRL, STIM)) + geom_point() + ggtitle("CD4 Naive T Cells")
p1 <- LabelUR(p1, genes = c(genes.to.label1, genes.to.label2), avg.t.cells,
    adj.u.t = 0.3, adj.u.s = 0.23)
p1 <- LabelUL(p1, genes = genes.to.label3, avg.t.cells, adj.u.t = 0.5, adj.u.s = 0.4,
    adj.l.t = 0.25, adj.l.s = 0.25)
p2 <- ggplot(avg.cd14.mono, aes(CTRL, STIM)) + geom_point() + ggtitle("CD14 Monocytes")
p2 <- LabelUR(p2, genes = c(genes.to.label1, genes.to.label3), avg.cd14.mono,
    adj.u.t = 0.3, adj.u.s = 0.23)
p2 <- LabelUL(p2, genes = genes.to.label2, avg.cd14.mono, adj.u.t = 0.5, adj.u.s = 0.4,
    adj.l.t = 0.25, adj.l.s = 0.25)
plot_grid(p1, p2)

#这一步就是用于查找在不同处理条件下差异表达的基因
[email protected]$celltype.stim <- paste0(immune.combined@ident, "_", [email protected]$stim)
immune.combined <- StashIdent(immune.combined, save.name = "celltype")
immune.combined <- SetAllIdent(immune.combined, id = "celltype.stim")
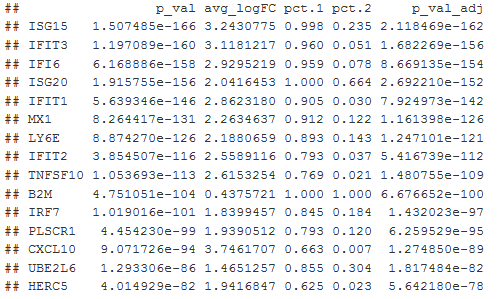
b.interferon.response <- FindMarkers(immune.combined, ident.1 = "B_STIM", ident.2 = "B_CTRL", print.bar = FALSE)
head(b.interferon.response, 15)
方法二:
#将会展示给定基因在不同处理条件下的表达情况
FeatureHeatmap(immune.combined, features.plot = c("CD3D", "GNLY", "IFI6", "ISG15", "CD14", "CXCL10"), group.by = "stim", pt.size = 0.25, key.position = "top", max.exp = 3)
