pyspark_聚类分析
数据集
本次使用得到数据集为莺尾花数据集-iris数据集,共有150条记录,5列[花萼长度、花萼宽度、花瓣长度、花瓣宽度、花朵类别],共有三种类别,每种类别50条记录。
先导入数据
df=spark.read.csv('iris_dataset.csv',inferSchema=True,header=True)
print((df.count(),len(df.columns)))

df.printSchema()
root
|-- sepal_length: double (nullable = true)
|-- sepal_width: double (nullable = true)
|-- petal_length: double (nullable = true)
|-- petal_width: double (nullable = true)
|-- species: string (nullable = true)
df.groupBy("species").count().show()
| species | count |
|---|---|
| virginica | 50 |
| versicolor | 50 |
| setosa | 50 |
特征工程
input_cols=['sepal_length', 'sepal_width', 'petal_length', 'petal_width']
vec_assembler = VectorAssembler(inputCols = input_cols, outputCol='features')
final_data = vec_assembler.transform(df)
构建模型
为了确定K值,我们需要运用肘部法则,需要用不同的K值运行K均值聚类,我们以此获取每个K值的SSE
errors=[]

for k in range(2,10):
    c=0
    kmeans = KMeans(featuresCol='features',k=k)
    model = kmeans.fit(final_data)
    Centers=model.clusterCenters()
    results=model.transform(final_data).toPandas()
    for i in range(results.shape[0]):
        c=c+cost(results["features"][i],Centers[results["prediction"][i]])
    errors.append(c)
    print("With K={}".format(k))
    print("Within Set Sum of Squared Errors = " + str(c))
    print('--'*30)
With K=2
Within Set Sum of Squared Errors = 128.40419523672944
With K=3
Within Set Sum of Squared Errors = 97.3259242343001
With K=4
Within Set Sum of Squared Errors = 90.68324472582259
With K=5
Within Set Sum of Squared Errors = 80.66481627594568
With K=6
Within Set Sum of Squared Errors = 74.09140921271428
With K=7
Within Set Sum of Squared Errors = 68.62516691447532
With K=8
Within Set Sum of Squared Errors = 64.47134802183177
With K=9
Within Set Sum of Squared Errors = 65.68076874800687
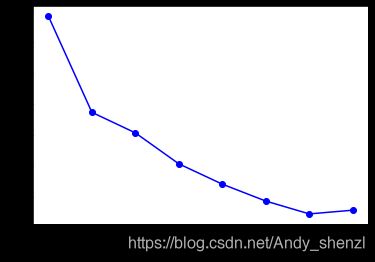
plt.plot(range(2,10), errors, 'bo-')
plt.xlabel('k')

我们可以看到3和4这两个值之间存在一定的肘部形状,我们使用K=3来进行聚类分析
kmeans = KMeans(featuresCol='features',k=3,)
model = kmeans.fit(final_data)
#model.transform(final_data).groupBy('prediction').count().show()
predictions=model.transform(final_data)
predictions.groupBy('species','prediction').count().show()
| species | prediction | count |
|---|---|---|
| virginica | 2 | 36 |
| virginica | 0 | 14 |
| versicolor | 0 | 48 |
| setosa | 1 | 50 |
| versicolor | 2 | 2 |
从最终结果可以看到,setosa分类全部正确;versicolor大部分都分到了一类中,而virginica分类不是很理想。
K均值每次都会生成不同的结果,因为每次都会随机的选择起始的质心。
可视化
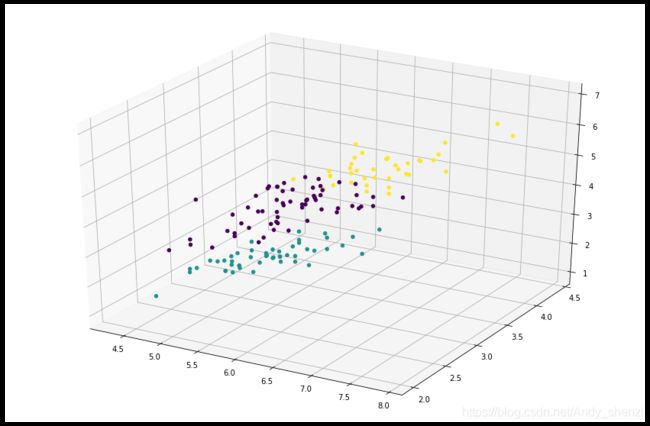
最后,借助matplotlib库来展示一下聚类的结果
首先我们需要吧spark dataframe转换成pandas dataframe:
pandas_df = predictions.toPandas()
cluster_vis = plt.figure(figsize=(15,10)).gca(projection='3d')
cluster_vis.scatter(pandas_df.sepal_length, pandas_df.sepal_width, pandas_df.petal_length, c=pandas_df.prediction,depthshade=False)
plt.show()
