轨迹规划-贝塞尔曲线
1. 简介
贝塞尔曲线于 1962 年,由法国工程师皮埃尔·贝济埃(Pierre Bézier)所广泛发表,他运用贝塞尔曲线来为汽车的主体进行设计,贝塞尔曲线最初由保尔·德·卡斯特里奥于1959年运用德卡斯特里奥算法开发,以稳定数值的方法求出贝塞尔曲线.
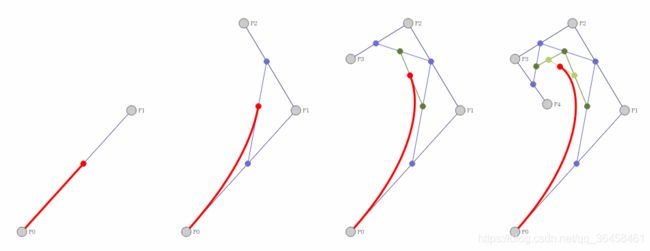
贝塞尔曲线有着很多特殊的性质, 在图形设计和路径规划中应用都非常广泛, 贝塞尔曲线完全由其控制点决定其形状, n个控制点对应着n-1阶的贝塞尔曲线,并且可以通过递归的方式来绘制.
2. 公式及原理
一阶贝塞尔曲线
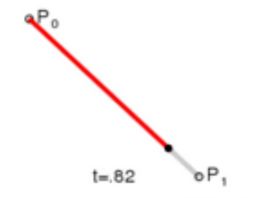
一阶曲线就是很好理解, 就是根据t来的线性插值. P0表示的是一个向量 [x ,y], 其中x和y是分别按照这个公式来计算的.
二阶贝塞尔曲线
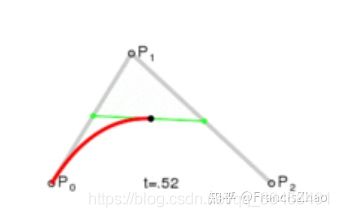
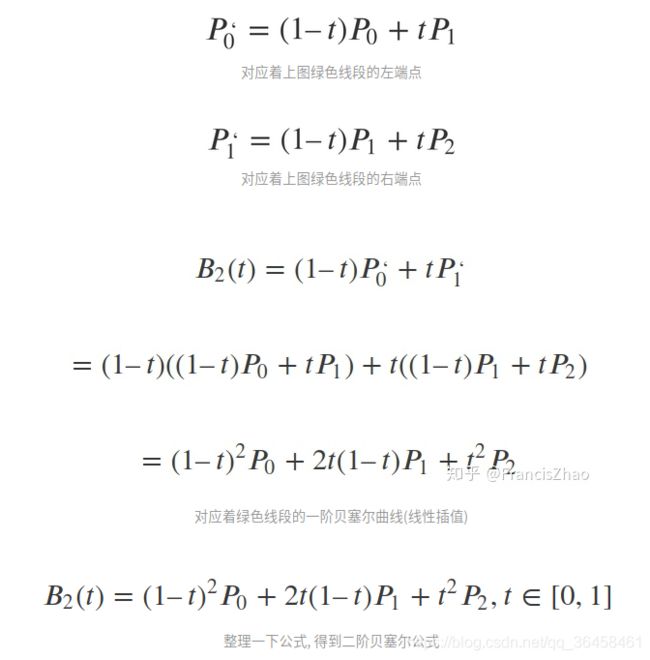
既然重点是递归, 那么二阶贝塞尔必然和一阶有关系.
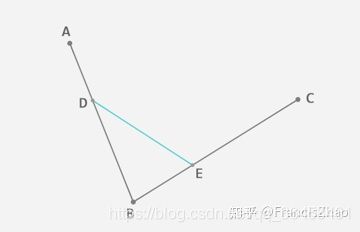
在平面内任选 3 个不共线的点,依次用线段连接。在第一条线段上任选一个点 D。计算该点到线段起点的距离 AD,与该线段总长 AB 的比例。
根据上一步得到的比例,从第二条线段上找出对应的点 E,使得 AD:AB = BE:BC。
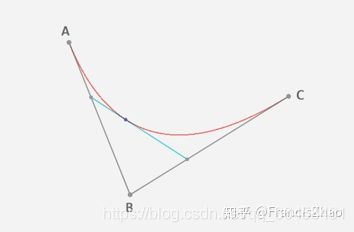
这时候DE又是一条直线了, 就可以按照一阶的贝塞尔方程来进行线性插值了, t= AD:AB
三阶贝塞尔曲线
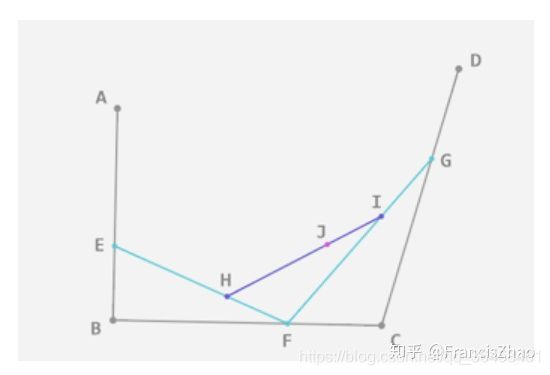
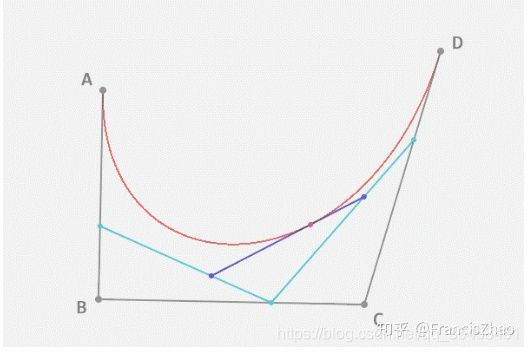
二阶的贝塞尔通过在控制点之间再采点的方式实现降阶, 每一次选点都是一次的降阶.
四个点对应是三次的贝塞尔曲线. 分别在 AB BC CD 之间采EFG点, EFG三个点对应着二阶贝塞尔, 在EF FG之间采集HI点来降阶为一阶贝塞尔曲线.
贝塞尔曲线公式
可以通过递归的方式来理解贝塞尔曲线, 但是还是给出公式才方便计算的.
 仔细看可以发现, 贝塞尔的参数B是二项式(t+(1-t))^n = (1)^n的展开公式. 划重点了: 系数是二项式的展开. 后面的很多的贝塞尔曲线的性质都可以用这个来解释
3. 贝塞尔曲线的性质
贝塞尔曲线具有众多特性,例如:递归性、凸包性、对称性、几何不变性、仿射不变性、拟局部性,保证了生成曲线的平滑性、连续性和可控性。
3.1 各项系数之和为1.
这个很好理解,因为是系数是二项式的展开(t+(1-t))^n = (1)^n非负性. 好理解, 二项式的展开啊
3.2 递归性
递归性指其系数满足下式:
 3.3一阶导数性质
 假设上图中贝塞尔的t是由左到右从0到1增加的,那么贝塞尔曲线在t=0时的导数是和P0P1的斜率(导数)是相同,t=1时的导数是和P2 P3的斜率(导数)是相同
这一点的性质可以用在贝塞尔曲线的拼接,只要保证三点一线中的中间点是两段贝塞尔曲线的连接点,就可以保证两端贝塞尔曲线的导数连续连续.
4. 如何确定贝塞尔曲线的控制点
假设道路上已经有(n+1)个采样点Pi(i=0,1,…,n),需要在相邻的每两个点P(i)和P(i+1)之间,用一条3次Bezier曲线连接。即由4个点确定, P0为起点、P3为终点,另外中间2个控制点P1和P2。
由四个控制点定义的平面三阶贝塞尔曲线可以形式化地表示为:
 如图所示,在轨迹生成过程中,将目标车辆的中心点坐标作为起点P0,以目标车辆的驶意图为引导推理得到的目标点作为P3,其他两个控制点由车辆的约束条件计算得到。
由于车辆在运动过程中无法进行原地滑动移动,所以生成的曲线需要满足起点方向约束。另外,在执行换道和转弯动作时,在终点处行驶轨迹要遵从道路结构化特征的约束,行驶轨迹的切线方向和道路的走势要相同,所以生成轨迹的终点需要满足终点方向约束。为了满足上述方向约束,P1和P2分别通过以起点坐标为起点沿起点航向向前移动距离d,以终点P3为起点沿终点航向的反方向向后移动距离d得到。
简单来说,考虑到车辆起止点速度方向的连续性,即要求曲线函数的一阶导数连续。
5. 代码实现
import matplotlib.pyplot as plt
import numpy as np
import scipy.special

show_animation = True


def calc_4points_bezier_path(sx, sy, syaw, ex, ey, eyaw, offset):
    """
    Compute control points and path given start and end position.

    :param sx: (float) x-coordinate of the starting point
    :param sy: (float) y-coordinate of the starting point
    :param syaw: (float) yaw angle at start
    :param ex: (float) x-coordinate of the ending point
    :param ey: (float) y-coordinate of the ending point
    :param eyaw: (float) yaw angle at the end
    :param offset: (float)
    :return: (numpy array, numpy array)
    """
    dist = np.hypot(sx - ex, sy - ey) / offset
    control_points = np.array(
        [[sx, sy],
         [sx + dist * np.cos(syaw), sy + dist * np.sin(syaw)],
         [ex - dist * np.cos(eyaw), ey - dist * np.sin(eyaw)],
         [ex, ey]])

    path = calc_bezier_path(control_points, n_points=100)

    return path, control_points


def calc_bezier_path(control_points, n_points=100):
    """
    Compute bezier path (trajectory) given control points.

    :param control_points: (numpy array)
    :param n_points: (int) number of points in the trajectory
    :return: (numpy array)
    """
    traj = []
    for t in np.linspace(0, 1, n_points):
        traj.append(bezier(t, control_points))

    return np.array(traj)


def bernstein_poly(n, i, t):
    """
    Bernstein polynom.

    :param n: (int) polynom degree
    :param i: (int)
    :param t: (float)
    :return: (float)
    """
    return scipy.special.comb(n, i) * t ** i * (1 - t) ** (n - i)


def bezier(t, control_points):
    """
    Return one point on the bezier curve.

    :param t: (float) number in [0, 1]
    :param control_points: (numpy array)
    :return: (numpy array) Coordinates of the point
    """
    n = len(control_points) - 1
    return np.sum([bernstein_poly(n, i, t) * control_points[i] for i in range(n + 1)], axis=0)


def bezier_derivatives_control_points(control_points, n_derivatives):
    """
    Compute control points of the successive derivatives of a given bezier curve.

    A derivative of a bezier curve is a bezier curve.
    See https://pomax.github.io/bezierinfo/#derivatives
    for detailed explanations

    :param control_points: (numpy array)
    :param n_derivatives: (int)
    e.g., n_derivatives=2 -> compute control points for first and second derivatives
    :return: ([numpy array])
    """
    w = {
     0: control_points}
    for i in range(n_derivatives):
        n = len(w[i])
        w[i + 1] = np.array([(n - 1) * (w[i][j + 1] - w[i][j])
                             for j in range(n - 1)])
    return w


def curvature(dx, dy, ddx, ddy):
    """
    Compute curvature at one point given first and second derivatives.

    :param dx: (float) First derivative along x axis
    :param dy: (float)
    :param ddx: (float) Second derivative along x axis
    :param ddy: (float)
    :return: (float)
    """
    return (dx * ddy - dy * ddx) / (dx ** 2 + dy ** 2) ** (3 / 2)


def plot_arrow(x, y, yaw, length=1.0, width=0.5, fc="r", ec="k"):  # pragma: no cover
    """Plot arrow."""
    if not isinstance(x, float):
        for (ix, iy, iyaw) in zip(x, y, yaw):
            plot_arrow(ix, iy, iyaw)
    else:
        plt.arrow(x, y, length * np.cos(yaw), length * np.sin(yaw),
                  fc=fc, ec=ec, head_width=width, head_length=width)
        plt.plot(x, y)


def main():
    """Plot an example bezier curve."""
    start_x = 10.0  # [m]
    start_y = 1.0  # [m]
    start_yaw = np.radians(180.0)  # [rad]

    end_x = -0.0  # [m]
    end_y = -3.0  # [m]
    end_yaw = np.radians(-45.0)  # [rad]
    offset = 3.0

    path, control_points = calc_4points_bezier_path(
        start_x, start_y, start_yaw, end_x, end_y, end_yaw, offset)

    # Note: alternatively, instead of specifying start and end position
    # you can directly define n control points and compute the path:
    # control_points = np.array([[5., 1.], [-2.78, 1.], [-11.5, -4.5], [-6., -8.]])
    # path = calc_bezier_path(control_points, n_points=100)

    # Display the tangent, normal and radius of cruvature at a given point
    t = 0.86  # Number in [0, 1]
    x_target, y_target = bezier(t, control_points)
    derivatives_cp = bezier_derivatives_control_points(control_points, 2)
    point = bezier(t, control_points)
    dt = bezier(t, derivatives_cp[1])
    ddt = bezier(t, derivatives_cp[2])
    # Radius of curvature
    radius = 1 / curvature(dt[0], dt[1], ddt[0], ddt[1])
    # Normalize derivative
    dt /= np.linalg.norm(dt, 2)
    tangent = np.array([point, point + dt])
    normal = np.array([point, point + [- dt[1], dt[0]]])
    curvature_center = point + np.array([- dt[1], dt[0]]) * radius
    circle = plt.Circle(tuple(curvature_center), radius,
                        color=(0, 0.8, 0.8), fill=False, linewidth=1)

    assert path.T[0][0] == start_x, "path is invalid"
    assert path.T[1][0] == start_y, "path is invalid"
    assert path.T[0][-1] == end_x, "path is invalid"
    assert path.T[1][-1] == end_y, "path is invalid"

    if show_animation:  # pragma: no cover
        fig, ax = plt.subplots()
        ax.plot(path.T[0], path.T[1], label="Bezier Path")
        ax.plot(control_points.T[0], control_points.T[1],
                '--o', label="Control Points")
        ax.plot(x_target, y_target)
        ax.plot(tangent[:, 0], tangent[:, 1], label="Tangent")
        ax.plot(normal[:, 0], normal[:, 1], label="Normal")
        ax.add_artist(circle)
        plot_arrow(start_x, start_y, start_yaw)
        plot_arrow(end_x, end_y, end_yaw)
        ax.legend()
        ax.axis("equal")
        ax.grid(True)
        plt.show()


def main2():
    """Show the effect of the offset."""
    start_x = 10.0  # [m]
    start_y = 1.0  # [m]
    start_yaw = np.radians(180.0)  # [rad]

    end_x = -0.0  # [m]
    end_y = -3.0  # [m]
    end_yaw = np.radians(-45.0)  # [rad]

    for offset in np.arange(1.0, 5.0, 1.0):
        path, control_points = calc_4points_bezier_path(
            start_x, start_y, start_yaw, end_x, end_y, end_yaw, offset)
        assert path.T[0][0] == start_x, "path is invalid"
        assert path.T[1][0] == start_y, "path is invalid"
        assert path.T[0][-1] == end_x, "path is invalid"
        assert path.T[1][-1] == end_y, "path is invalid"

        if show_animation:  # pragma: no cover
            plt.plot(path.T[0], path.T[1], label="Offset=" + str(offset))

    if show_animation:  # pragma: no cover
        plot_arrow(start_x, start_y, start_yaw)
        plot_arrow(end_x, end_y, end_yaw)
        plt.legend()
        plt.axis("equal")
        plt.grid(True)
        plt.show()


if __name__ == '__main__':
    main()
参考文章:
1.曲线篇-贝塞尔曲线
2.运动规划-贝塞尔Bezier曲线
3.自动驾驶-初探轨迹规划
