-
OC 使用 pod集成 Charts库时 要在podefie中 加上 use_frameworks! ! 如图
 a.png
a.png
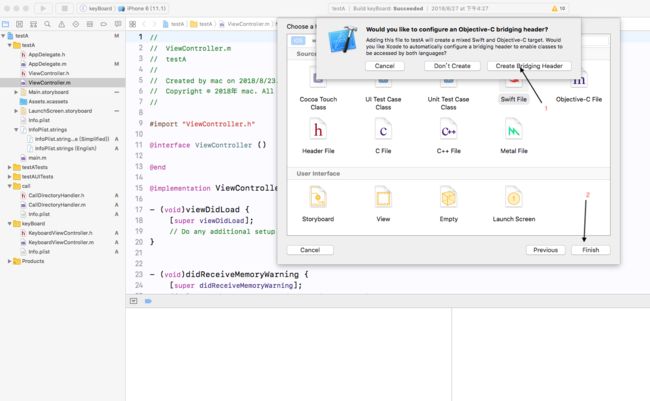
2.在OC项目创建 swift的文件并生成桥接文件


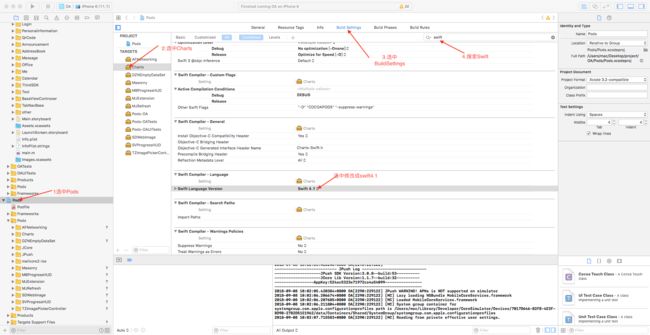
3.如果集成报错做如下操作
到这里就将Charts 集成到及的项目中啦
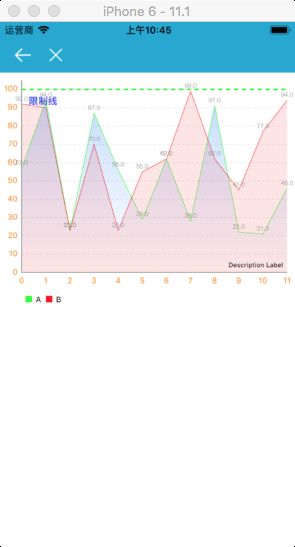
实例1.折线的创建
-(void)zxinit
{
self.lineView=[[LineChartView alloc]initWithFrame:CGRectMake(0, 0, ScreenWidth, 300)];
[self.view addSubview:self.lineView];
self.lineView.delegate=self;
//设置折线图描述
self.lineView.noDataText=@"战无数据"; //没数据时显示
//self.lineView.drawBordersEnabled=YES; //
// self.lineView.drawGridBackgroundEnabled=NO;
self.lineView.scaleYEnabled=NO; //启动Y轴缩放
self.lineView.scaleXEnabled=NO; //启动X轴缩放
self.lineView.doubleTapToZoomEnabled=NO; //取消双击缩放
self.lineView.dragEnabled=YES; //启动拖拽图标
self.lineView.dragDecelerationEnabled=YES; //拖拽后是否有惯性效果
self.lineView.dragDecelerationFrictionCoef = 0.9;//拖拽后惯性效果的摩擦系数(0~1),数值越小,惯性越不明显
//设置X轴样式
ChartXAxis *xAxis = self.lineView.xAxis;
xAxis.axisLineWidth = 1.0/[UIScreen mainScreen].scale;//设置X轴线宽
xAxis.labelCount=11;
xAxis.labelPosition = XAxisLabelPositionBottom;//X轴的显示位置,默认是显示在上面的
xAxis.drawGridLinesEnabled = NO;//不绘制网格线
// xAxis.spaceBetweenLabels = 4;//设置label间隔
xAxis.labelTextColor = [UIColor orangeColor];//label文字颜色

//设置Y轴样式
self.lineView.rightAxis.enabled = NO;//不绘制右边轴
ChartYAxis *leftAxis = self.lineView.leftAxis;//获取左边Y轴
leftAxis.labelCount = 11;//Y轴label数量,数值不一定,如果forceLabelsEnabled等于YES, 则强制绘制制定数量的label, 但是可能不平均
leftAxis.forceLabelsEnabled = NO;//不强制绘制指定数量的label
// leftAxis.showOnlyMinMaxEnabled = NO;//是否只显示最大值和最小值
leftAxis.axisMinimum = 0;//设置Y轴的最小值
leftAxis.drawZeroLineEnabled = YES;//从0开始绘制
leftAxis.axisMaximum = 105;//设置Y轴的最大值
leftAxis.inverted = NO;//是否将Y轴进行上下翻转
leftAxis.axisLineWidth = 1.0/[UIScreen mainScreen].scale;//Y轴线宽
leftAxis.axisLineColor = [UIColor blackColor];//Y轴颜色
// leftAxis.valueFormatter = [[NSNumberFormatter alloc] init];//自定义格式
// leftAxis.valueFormatter.positiveSuffix = @" $";//数字后缀单位
leftAxis.labelPosition = YAxisLabelPositionOutsideChart;//label位置
leftAxis.labelTextColor =[UIColor orangeColor];//文字颜色
leftAxis.labelFont = [UIFont systemFontOfSize:10.0f];//文字字体

//设置网格样式
leftAxis.gridLineDashLengths = @[@3.0f, @3.0f];//设置虚线样式的网格线
leftAxis.gridColor = [UIColor colorWithRed:200/255.0f green:200/255.0f blue:200/255.0f alpha:1];//网格线颜色
leftAxis.gridAntialiasEnabled = YES;//开启抗锯齿

//设置限制线
ChartLimitLine *limitLine = [[ChartLimitLine alloc] initWithLimit:100 label:@"限制线"];
limitLine.lineWidth = 2;
limitLine.lineColor = [UIColor greenColor];
limitLine.lineDashLengths = @[@5.0f, @5.0f];//虚线样式
limitLine.labelPosition = ChartLimitLabelPositionLeftBottom;//位置
limitLine.valueTextColor =[UIColor blueColor];//label文字颜色
limitLine.valueFont = [UIFont systemFontOfSize:12];//label字体
[leftAxis addLimitLine:limitLine];//添加到Y轴上
leftAxis.drawLimitLinesBehindDataEnabled = YES;//设置限制线绘制在折线图的后面

//设置折线图描述及图例样式
//[self.lineView setDescriptionText:@"折线图"];//折线图描述
// [self.lineView setDescriptionTextColor:[UIColor darkGrayColor]];
//   self.lineView.legend.form = ChartLegendFormLine;//图例的样式
//  self.lineView.legend.formSize = 30;//图例中线条的长度
//  self.lineView.legend.textColor = [UIColor darkGrayColor];//图例文字颜色

//汽包
BalloonMarker *markerA=[[BalloonMarker alloc]initWithColor:[UIColor orangeColor] font:[UIFont systemFontOfSize:12] textColor:[UIColor whiteColor] insets:UIEdgeInsetsMake(9.0, 8.0, 20.0, 8.0)];
markerA.chartView=self.lineView;
markerA.minimumSize=CGSizeMake(50.f, 25.f);
self.lineView.marker=markerA;

self.lineView.data=[self zxData];
}
-(LineChartData *)zxData
{
int xVals_count = 12;//X轴上要显示多少条数据
double maxYVal = 100;//Y轴的最大值
//X轴上面需要显示的数据
NSMutableArray *xVals = [[NSMutableArray alloc] init];
for (int i = 0; i < xVals_count; i++) {
[xVals addObject:[NSString stringWithFormat:@"%d", i+1]];
}
//对应Y轴上面需要显示的数据
NSMutableArray *yVals = [[NSMutableArray alloc] init];
for (int i = 0; i < xVals_count; i++) {
    double mult = maxYVal + 1;
    double val = (double)(arc4random_uniform(mult));
    ChartDataEntry *entry =[[ChartDataEntry alloc]initWithX:i y:val]; //[[ChartDataEntry alloc] initWithValue:val xIndex:i];
    [yVals addObject:entry];
}

LineChartDataSet *set1 = nil;
if (self.lineView.data.dataSetCount > 0) {
    LineChartData *data = (LineChartData *)self.lineView.data;
    set1 = (LineChartDataSet *)data.dataSets[0];
    //set1.=yVals;
    return data;
}else{
    //创建LineChartDataSet对象
    set1=[[LineChartDataSet alloc]initWithValues:yVals label:@"A"];
    //设置折线的样式
    set1.lineWidth = 1.0/[UIScreen mainScreen].scale;//折线宽度
    set1.drawValuesEnabled = YES;//是否在拐点处显示数据
    set1.valueColors = @[[UIColor brownColor]];//折线拐点处显示数据的颜色
    [set1 setColor:[UIColor greenColor]];//折线颜色
    //set1.drawSteppedEnabled = NO;//是否开启绘制阶梯样式的折线图

    //折线拐点样式
    set1.drawCirclesEnabled = NO;//是否绘制拐点
    set1.circleRadius = 4.0f;//拐点半径
    set1.circleColors = @[[UIColor redColor], [UIColor greenColor]];//拐点颜色
    //拐点中间的空心样式
    set1.drawCircleHoleEnabled = YES;//是否绘制中间的空心
    set1.circleHoleRadius = 2.0f;//空心的半径
    set1.circleHoleColor = [UIColor blackColor];//空心的颜色
    //折线的颜色填充样式
    //第一种填充样式:单色填充
    //        set1.drawFilledEnabled = YES;//是否填充颜色
    //        set1.fillColor = [UIColor redColor];//填充颜色
    //        set1.fillAlpha = 0.3;//填充颜色的透明度
    //第二种填充样式:渐变填充
    set1.drawFilledEnabled = YES;//是否填充颜色
    NSArray *gradientColors = @[(id)[ChartColorTemplates colorFromString:@"#FFFFFFFF"].CGColor,
                                (id)[ChartColorTemplates colorFromString:@"#FF007FFF"].CGColor];
    CGGradientRef gradientRef = CGGradientCreateWithColors(nil, (CFArrayRef)gradientColors, nil);
    set1.fillAlpha = 0.3f;//透明度
    set1.fill = [ChartFill fillWithLinearGradient:gradientRef angle:90.0f];//赋值填充颜色对象
    CGGradientRelease(gradientRef);//释放gradientRef

    //点击选中拐点的交互样式
    set1.highlightEnabled = YES;//选中拐点,是否开启高亮效果(显示十字线)
    set1.highlightColor = [UIColor darkGrayColor];//点击选中拐点的十字线的颜色
    set1.highlightLineWidth = 1.0/[UIScreen mainScreen].scale;//十字线宽度
    set1.highlightLineDashLengths = @[@5, @5];//十字线的虚线样式

    //将 LineChartDataSet 对象放入数组中
    NSMutableArray *dataSets = [[NSMutableArray alloc] init];
    [dataSets addObject:set1];

    //添加第二个LineChartDataSet对象
    LineChartDataSet *set2 = [set1 copy];
    NSMutableArray *yVals2 = [[NSMutableArray alloc] init];
    for (int i = 0; i < xVals_count; i++) {
        double mult = maxYVal + 1;
        double val = (double)(arc4random_uniform(mult));
        ChartDataEntry *entry =[[ChartDataEntry alloc]initWithX:i y:val];   //[[ChartDataEntry alloc] initWithValue:val xIndex:i];
        [yVals2 addObject:entry];
    }
    // set2.yVals = yVals2;
    set2.values=yVals2;
    set2.label=@"B";
    [set2 setColor:[UIColor redColor]];
    set2.drawFilledEnabled = YES;//是否填充颜色
    set2.fillColor = [UIColor redColor];//填充颜色
    set2.fillAlpha = 0.1;//填充颜色的透明度
    [dataSets addObject:set2];

    //创建 LineChartData 对象, 此对象就是lineChartView需要最终数据对象
    LineChartData *data=[[LineChartData alloc]initWithDataSets:dataSets];
    [data setValueFont:[UIFont fontWithName:@"HelveticaNeue-Light" size:8.f]];//文字字体
    [data setValueTextColor:[UIColor grayColor]];//文字颜色
    // NSNumberFormatter *formatter = [[NSNumberFormatter alloc] init];
    //自定义数据显示格式
    // [formatter setNumberStyle:NSNumberFormatterDecimalStyle];
    // [formatter setPositiveFormat:@"#0.0"];
    //  [data setValueFormatter:formatter];

    return data;

}
//效果如图
实例2.条形图
-(void)txinit
{
self.chartView=[[BarChartView alloc]initWithFrame:CGRectMake(0, 0, ScreenWidth, 300)];
self.chartView.delegate=self;
[self.view addSubview:self.chartView];
self.chartView.noDataText=@"战无数据"; //没数据时显示
self.chartView.drawValueAboveBarEnabled=YES; //数值显示在柱形的上面还是下面
self.chartView.drawBarShadowEnabled=NO; //是否绘制柱形的阴影背景
self.chartView.scaleYEnabled=NO; //启动Y轴缩放
self.chartView.scaleXEnabled=NO; //启动X轴缩放
self.chartView.doubleTapToZoomEnabled=NO; //取消双击缩放
self.chartView.dragEnabled=YES; //启动拖拽图标
self.chartView.dragDecelerationEnabled=YES; //拖拽后是否有惯性效果
self.chartView.dragDecelerationFrictionCoef = 0.9;//拖拽后惯性效果的摩擦系数(0~1),数值越小,惯性越不明显

//设置X轴的样式
ChartXAxis *xAxis=self.chartView.xAxis;
xAxis.axisLineWidth=1; //X轴的线宽
xAxis.labelPosition = XAxisLabelPositionBottom;//X轴的显示位置,默认是显示在上面的
xAxis.drawGridLinesEnabled = NO;//不绘制网格线
xAxis.labelCount=12; //label的个数
//xAxis. = 4;//设置label间隔,若设置为1,则如果能全部显示,则每个柱形下面都会显示label
//xAxis.spaceMin=0;
// xAxis.spaceMax=1;
xAxis.labelTextColor = [UIColor brownColor];//label文字颜色

//设置Y轴的样式
self.chartView.rightAxis.enabled=NO; //不绘制右边轴
ChartYAxis *leftAxis=self.chartView.leftAxis;
leftAxis.forceLabelsEnabled = NO;//不强制绘制制定数量的label
leftAxis.axisMinimum = 0;//设置Y轴的最小值
leftAxis.drawZeroLineEnabled = YES;//从0开始绘制
leftAxis.axisMaximum = 105;//设置Y轴的最大值
leftAxis.inverted = NO;//是否将Y轴进行上下翻转
leftAxis.axisLineWidth = 0.5;//Y轴线宽
// leftAxis.axisMinLabels=1; //轴上标签的最小数目
//leftAxis.axisMaxLabels=100;//轴上标签的最大数目
leftAxis.axisLineColor = [UIColor blackColor];//Y轴颜色
leftAxis.labelCount = 5;  //通过labelCount属性设置Y轴要均分的数量.设置的labelCount的值不一定就是Y轴要均分的数量,这还要取决于forceLabelsEnabled属性,
leftAxis.forceLabelsEnabled = NO; //如果forceLabelsEnabled等于YES, 则强制绘制指定数量的label, 但是可能不是均分的
leftAxis.labelPosition = YAxisLabelPositionOutsideChart;//label位置
leftAxis.labelTextColor = [UIColor brownColor];//文字颜色
leftAxis.labelFont = [UIFont systemFontOfSize:10.0f];//文字字体
// 设置Y轴上标签显示数字的格式,代码如下:
//leftAxis.valueFormatter = [[NSNumberFormatter alloc] init];//自定义格式
//leftAxis.valueFormatter.pos = @" $";//数字后缀单位
// 设置Y轴上网格线的样式,代码如下:
leftAxis.gridLineDashLengths = @[@3.0f, @3.0f];//设置虚线样式的网格线
leftAxis.gridColor = [UIColor colorWithRed:200/255.0f green:200/255.0f blue:200/255.0f alpha:1];//网格线颜色
leftAxis.gridAntialiasEnabled = YES;//开启抗锯齿
//设置限制线
ChartLimitLine *limitLine = [[ChartLimitLine alloc] initWithLimit:80 label:@"限制线"];
limitLine.lineWidth = 2;
limitLine.lineColor = [UIColor greenColor];
limitLine.lineDashLengths = @[@5.0f, @5.0f];//虚线样式
limitLine.labelPosition = ChartLimitLabelPositionRightTop;//位置
[leftAxis addLimitLine:limitLine];//添加到Y轴上
leftAxis.drawLimitLinesBehindDataEnabled = YES;//设置限制线绘制在柱形图的后面
self.chartView.legend.enabled=NO; //不显示图利说明
//    self.chartView.=@"";


//汽包
BalloonMarker *markerA=[[BalloonMarker alloc]initWithColor:[UIColor orangeColor] font:[UIFont systemFontOfSize:12] textColor:[UIColor whiteColor] insets:UIEdgeInsetsMake(9.0, 8.0, 20.0, 8.0)];
markerA.chartView=self.chartView;
markerA.minimumSize=CGSizeMake(50.f, 25.f);
self.chartView.marker=markerA;
self.chartView.data=[self txData]; //数据设置
[self.chartView animateWithYAxisDuration:1]; //设置动画效果
}
//数据设置
-(BarChartData *)txData
{
int xValues=12; //X轴上要显示多少条数据
double maxY=100;// Y轴的最大值
//X轴上面需要显示的数据
NSMutableArray *xV=[[NSMutableArray alloc]init];
for (int i=0; i
}
效果如图

实例3 饼状图
-(void)pieInit{
self.pieChartView=[[PieChartView alloc]initWithFrame:CGRectMake(0, 0, ScreenWidth, 300)];
self.pieChartView.delegate=self;
[self.view addSubview:self.pieChartView];
[self.pieChartView setExtraOffsetsWithLeft:5 top:10 right:70 bottom:5];//饼状图距离边缘的间隙
self.pieChartView.usePercentValuesEnabled = YES;//是否根据所提供的数据, 将显示数据转换为百分比格式
self.pieChartView.dragDecelerationEnabled = YES;//拖拽饼状图后是否有惯性效果
self.pieChartView.drawSlicesUnderHoleEnabled= NO;//如果是的话,这个洞会穿透到薄片的内部尖端
self.pieChartView.chartDescription.enabled = NO;//饼状图描述
self.pieChartView.drawHoleEnabled = YES;//饼状图是否是空心
self.pieChartView.holeRadiusPercent = 0.5;//空心半径占比
self.pieChartView.holeColor = [UIColor clearColor];//空心颜色
self.pieChartView.transparentCircleRadiusPercent = 0.55;//半透明空心半径占比
self.pieChartView.transparentCircleColor = [UIColor colorWithRed:255/255.0 green:255/255.0 blue:255/255.0 alpha:0.3];//半透明空心的颜色
if (self.pieChartView.isDrawHoleEnabled == YES) {
    self.pieChartView.drawCenterTextEnabled = YES;//是否显示中间文字
    //普通文本
    // self.pieChartView.centerText = @"饼状图";//中间文字
    //富文本
    NSMutableAttributedString *centerText = [[NSMutableAttributedString alloc] initWithString:@"饼状图bbb\n饼状图aaa"];
    [centerText setAttributes:@{NSFontAttributeName: [UIFont boldSystemFontOfSize:16],
                                NSForegroundColorAttributeName: [UIColor orangeColor]}
                        range:NSMakeRange(0, centerText.length)];
    self.pieChartView.centerAttributedText = centerText;
}

self.pieChartView.legend.maxSizePercent = 1;//图例在饼状图中的大小占比, 这会影响图例的宽高
self.pieChartView.legend.formToTextSpace = 5;//文本间隔
self.pieChartView.legend.font = [UIFont systemFontOfSize:10];//字体大小
self.pieChartView.legend.textColor = [UIColor grayColor];//字体颜色
// self.pieChartView.legend.position = ChartLegendPositionBelowChartCenter;//图例在饼状图中的位置
self.pieChartView.legend.horizontalAlignment = ChartLegendHorizontalAlignmentRight;
self.pieChartView.legend.verticalAlignment = ChartLegendVerticalAlignmentTop;
self.pieChartView.legend.orientation = ChartLegendOrientationVertical;
self.pieChartView.legend.form = ChartLegendFormCircle;//图示样式: 方形、线条、圆形
self.pieChartView.legend.formSize = 8;//图示大小
[self.pieChartView setRotationEnabled:false];//禁止拖拽
[self pieData];
}
-(PieChartData *)pieData
{
//每个区块的数据
//每个区块的名称或描述
NSMutableArray *arr = [[NSMutableArray alloc]init];
NSMutableArray *nameArr = [[NSMutableArray alloc]init];
[arr addObject:@"6"];
[arr addObject:@"7"];
[arr addObject:@"2"];
[arr addObject:@"4"];
[nameArr addObject:@"A"];
[nameArr addObject:@"B"];
[nameArr addObject:@"C"];
[nameArr addObject:@"D"];
NSMutableArray *values = [[NSMutableArray alloc] init];
// IMPORTANT: In a PieChart, no values (Entry) should have the same xIndex (even if from different DataSets), since no values can be drawn above each other.
for (int i = 0; i < arr.count; I++)
{
NSString * aaa = arr[i];
double bb = aaa.doubleValue;
[values addObject:[[PieChartDataEntry alloc] initWithValue: bb label: nameArr[i]]];
}
//dataSet
PieChartDataSet *dataSet = [[PieChartDataSet alloc] initWithValues:values label:@"aaaf"];
dataSet.drawValuesEnabled = YES;//是否绘制显示数据
NSMutableArray *colors = [[NSMutableArray alloc] init];
[colors addObjectsFromArray:ChartColorTemplates.vordiplom];
[colors addObjectsFromArray:ChartColorTemplates.joyful];
[colors addObjectsFromArray:ChartColorTemplates.colorful];
[colors addObjectsFromArray:ChartColorTemplates.liberty];
[colors addObjectsFromArray:ChartColorTemplates.pastel];
[colors addObject:[UIColor colorWithRed:51/255.f green:181/255.f blue:229/255.f alpha:1.f]];
dataSet.colors = colors;//区块颜色
dataSet.sliceSpace = 5;//相邻区块之间的间距
dataSet.selectionShift = 8;//选中区块时, 放大的半径
dataSet.xValuePosition = PieChartValuePositionInsideSlice;//名称位置
dataSet.yValuePosition = PieChartValuePositionOutsideSlice;//数据位置
//数据与区块之间的用于指示的折线样式
dataSet.valueLinePart1OffsetPercentage = 0.85;//折线中第一段起始位置相对于区块的偏移量, 数值越大, 折线距离区块越远
dataSet.valueLinePart1Length = 0.5;//折线中第一段长度占比
dataSet.valueLinePart2Length = 0.4;//折线中第二段长度最大占比
dataSet.valueLineWidth = 1;//折线的粗细
dataSet.valueLineColor = [UIColor brownColor];//折线颜色
//data
PieChartData *data = [[PieChartData alloc] initWithDataSet:dataSet];
NSNumberFormatter *formatter = [[NSNumberFormatter alloc] init];
formatter.numberStyle = NSNumberFormatterPercentStyle;
formatter.maximumFractionDigits = 0;//小数位数
formatter.multiplier = @1.f;
[data setValueFormatter:[[ChartDefaultValueFormatter alloc] initWithFormatter:formatter]];//设置显示数据格式
[data setValueTextColor:[UIColor brownColor]];
[data setValueFont:[UIFont systemFontOfSize:10]];
self.pieChartView.data = data;
[ self.pieChartView setNeedsDisplay];
return data;
}
//效果如何

实例4 复合图
/*复合图/
-(void)comInit{
self.comView=[[CombinedChartView alloc]initWithFrame:CGRectMake(0, 0, ScreenWidth, 300)];
self.comView.delegate=self;
[self.view addSubview:self.comView];
self.comView.doubleTapToZoomEnabled=NO;//取消双击放大
self.comView.scaleXEnabled=YES; //设置X轴缩放
self.comView.scaleYEnabled=YES;//设置Y轴缩放
self.comView.dragDecelerationEnabled = YES;//拖拽后是否有惯性效果
self.comView.dragDecelerationFrictionCoef = 0.9;//拖拽后惯性效果的摩擦系数(0~1),数值越小,惯性越不明显
self.comView.highlightPerTapEnabled = NO;//取消单击高亮显示
self.comView.highlightPerDragEnabled = NO;//取消拖拽高亮
//设置X轴的样式
ChartXAxis *xAxis=self.comView.xAxis;
xAxis.axisLineWidth=1; //X轴的线宽
xAxis.labelPosition = XAxisLabelPositionBottom;//X轴的显示位置,默认是显示在上面的
xAxis.drawGridLinesEnabled = NO;//不绘制网格线
xAxis.labelCount=12; //label的个数
//xAxis. = 4;//设置label间隔,若设置为1,则如果能全部显示,则每个柱形下面都会显示label
//xAxis.spaceMin=0;
// xAxis.spaceMax=1;
xAxis.labelTextColor = [UIColor brownColor];//label文字颜色

//设置Y轴的样式
self.comView.rightAxis.enabled=NO; //不绘制右边轴
ChartYAxis *leftAxis=self.comView.leftAxis;
leftAxis.forceLabelsEnabled = NO;//不强制绘制制定数量的label
leftAxis.axisMinimum = 0;//设置Y轴的最小值
leftAxis.drawZeroLineEnabled = YES;//从0开始绘制
leftAxis.axisMaximum = 105;//设置Y轴的最大值
leftAxis.inverted = NO;//是否将Y轴进行上下翻转
leftAxis.axisLineWidth = 0.5;//Y轴线宽
// leftAxis.axisMinLabels=1; //轴上标签的最小数目
//leftAxis.axisMaxLabels=100;//轴上标签的最大数目
leftAxis.axisLineColor = [UIColor blackColor];//Y轴颜色
leftAxis.labelCount = 5;  //通过labelCount属性设置Y轴要均分的数量.设置的labelCount的值不一定就是Y轴要均分的数量,这还要取决于forceLabelsEnabled属性,
leftAxis.forceLabelsEnabled = NO; //如果forceLabelsEnabled等于YES, 则强制绘制指定数量的label, 但是可能不是均分的
leftAxis.labelPosition = YAxisLabelPositionOutsideChart;//label位置
leftAxis.labelTextColor = [UIColor brownColor];//文字颜色
leftAxis.labelFont = [UIFont systemFontOfSize:10.0f];//文字字体
// 设置Y轴上标签显示数字的格式,代码如下:
//leftAxis.valueFormatter = [[NSNumberFormatter alloc] init];//自定义格式
//leftAxis.valueFormatter.pos = @" $";//数字后缀单位
// 设置Y轴上网格线的样式,代码如下:
leftAxis.gridLineDashLengths = @[@3.0f, @3.0f];//设置虚线样式的网格线
leftAxis.gridColor = [UIColor colorWithRed:200/255.0f green:200/255.0f blue:200/255.0f alpha:1];//网格线颜色
leftAxis.gridAntialiasEnabled = YES;//开启抗锯齿
//设置限制线
ChartLimitLine *limitLine = [[ChartLimitLine alloc] initWithLimit:80 label:@"限制线"];
limitLine.lineWidth = 2;
limitLine.lineColor = [UIColor greenColor];
limitLine.lineDashLengths = @[@5.0f, @5.0f];//虚线样式
limitLine.labelPosition = ChartLimitLabelPositionRightTop;//位置
[leftAxis addLimitLine:limitLine];//添加到Y轴上
leftAxis.drawLimitLinesBehindDataEnabled = YES;//设置限制线绘制在柱形图的后面
self.comView.legend.enabled=NO; //不显示图利说明
[self.comView animateWithYAxisDuration:1];
//设置数据
CombinedChartData *comData=[[CombinedChartData alloc]init];
comData.barData=[self txData];
comData.lineData=[self zxData];
self.comView.data=comData;
}
效果图
