K-means聚类分析-交互式GUI演示(Matlab)
K-means聚类分析-交互式GUI演示(Matlab)
学习K-means的时候总是想,这应该是一个很酷的算法,那么酷的算法,就应该有比较酷的demo来演示它,于是我写了这个程序就是为了能装逼,哦不,可以更直观的和K-means算法进行互动。原创程序,希望大家可以喜欢,多多指教。
目录
- K-means聚类分析-交互式GUI演示(Matlab)
- 目录
- 原理简介
- 实现效果和功能展示
- 一点体会
- 代码
- KmeansMain.m
- colorMap.m
原理简介
- K-means是无监督学习的聚类算法,是机器学习中最重要的算法之一,他的目的是通过机器学习自动探索一批未知的数据,并将其分类。
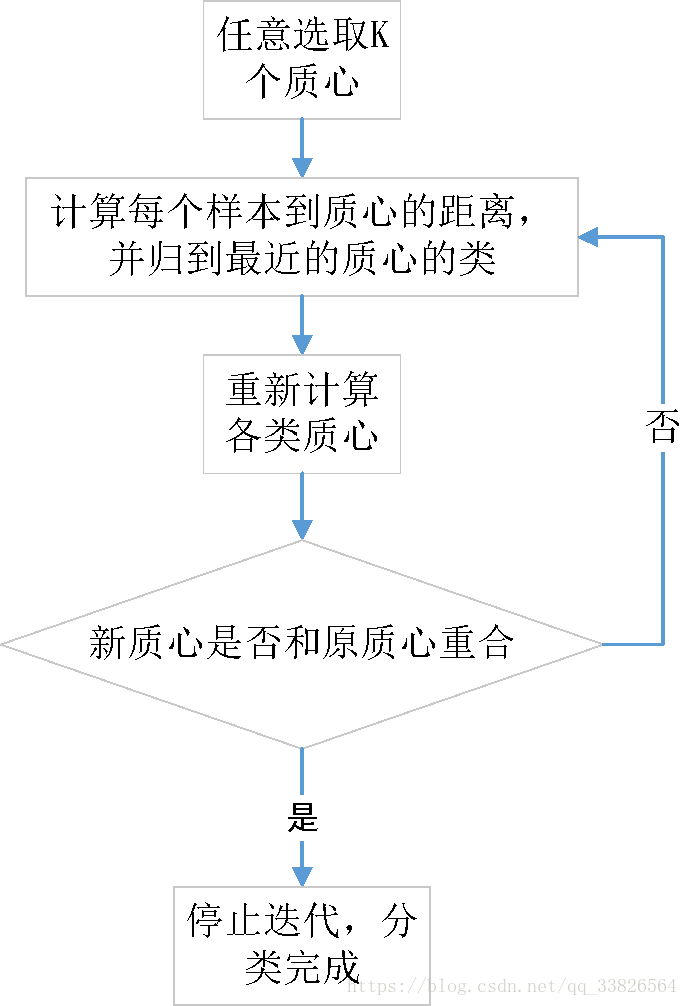
- 具体的算法流程如下:

|
实现效果和功能展示
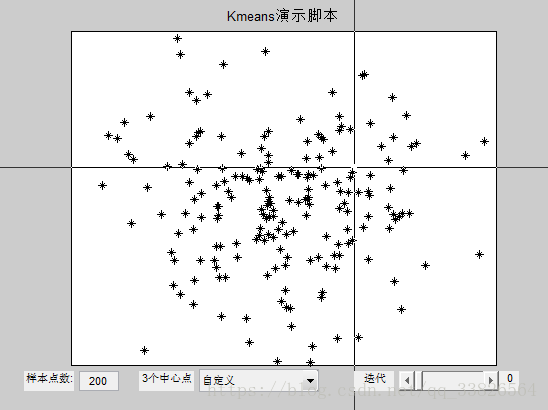
- 参考图2,使用 Matlab 编写 GUI 界面程序,完成对 K-means 算法基本原理的演示,程序界面如图 2所示。点击“样本点数”的
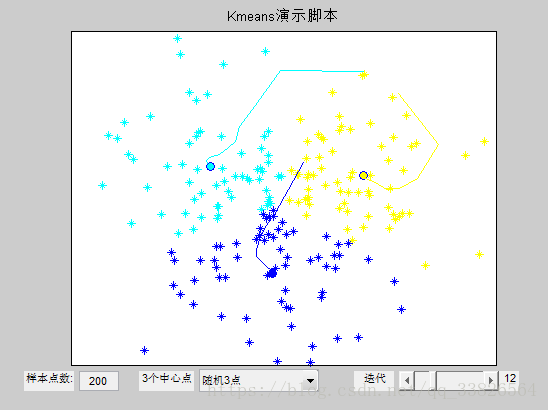
edit框,可以修改初始样本点个数,“中心点”下拉框可以选择投放中心点的方式(如图3所示,若选择“自定义”,则可以使用光标在axes上自定义选择任意位置任意个数中心点如,若选择“随机2点”,则随机产生2个中心点,“随机3点”,“随机4点”同理。),“迭代”进度条,可以拉动以实现迭代,右边的文本框可以实时显示迭代的次数,迭代过程中中心点的运动轨迹将被绘出(如图5所示为随机3个中心点进行迭代分类,不同类用不同的颜色区分)。需要注意的是,该程序可以循环演示,无需退出,重新选择中心点后将会重新初始化整个过程。

|
 图2 程序界面 图2 程序界面
|
 图4 自定义落点 图4 自定义落点
|
 图5 随机3个中心点进行迭代 图5 随机3个中心点进行迭代
|
 图6 自定义7个中心点进行分类 图6 自定义7个中心点进行分类
|
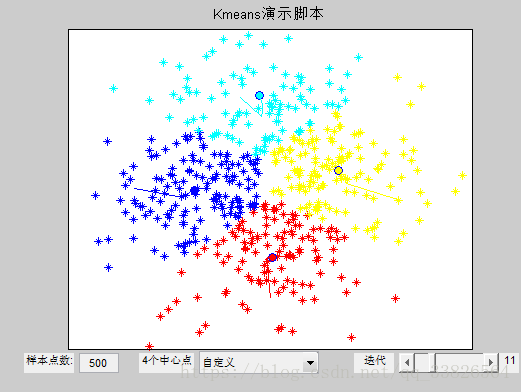
 图7 自定义4点,500个样本 图7 自定义4点,500个样本
|
|
一点体会
内嵌式 Matlab 编程的时候,主函数里面的变量都会被视为
global,为所有子函数可见。在声明回调函数的时候,’callback’,{ @classify,gca},的意思是声明该控件的回调函数为classify,同时传入参数gca,需要注意的是,在定义classify函数的时候,默认是有两个控件参数hObj(当前控件句柄),和event(当前控件事件结构体)的,传入的参数必须放在这两个参数后面,才能实现正常的参数传递,如function classify(hObj,event,ax),传入的参数gca会赋值给临时变量ax。产生多维正态随机变量的时候使用
mvnrnd(Multivariate normal random numbers),语法为R = mvnrnd(MU,SIGMA),其中SIGMA为协方差矩阵而不是方差,应该注意的是多维随机变量(随机向量)要表示其内部随机变量的关系,使用的是协方差,而不是方差,当然,内部随机变量的方差位于这个协方差矩阵的对角。- 若要在
axes中绘点,需要加上点标志,如‘*’或者’.’,才会在plot中绘点,不然其默认为绘制线。
代码
KmeansMain.m
function KmeansMain
    close all;clear;clc;
    %随机生成随机数
    mu = [0 0];
    %协方差矩阵,对角为方差值0.3,0.35
    var = [0.3 0; 0 0.35];
    samNum = 200;
    data = mvnrnd(mu, var, samNum);
    a = figure;
    plot(gca, data(:,1), data(:,2), '*', 'color', 'k');hold on;
    classNum = [];%类数
    iterNum = 0;%迭代次数
    x = [];
    centerPoint = [];
    centerPointPathAarry = [];
    h_plotCenterPoint = [];%中心点绘制handle
    h_plotPath = [];%中心点路径绘制handle
    %centerPointPathAarry结构
    %第1次迭代|中心点1(x,y)|中心点2(x,y)|中心点3(x,y)|中心点n(x,y)
    %第2次迭代|中心点1(x,y)|中心点2(x,y)|中心点3(x,y)|中心点n(x,y)
    h_slider = uicontrol(a,'Style', 'slider',...
             'SliderStep',[0.02 0.02],...
            'Min',0,'Max',50,'Value',0,...
            'Position', [400 20 100 20],...
            'Callback', {@classify,gca});
    h_edit = uicontrol(a,'Style', 'edit',...
           'String', '200',...
            'Position', [80 20 40 20],...
            'Callback', {@paintRandomPoint,gca});
    uicontrol('Style', 'popup',...
               'String', '自定义|随机2点|随机3点|随机4点',...
               'Position', [200 22 120 20],...
               'Callback', {@SpsfPoit,gca});
    h_t1 = uicontrol('Style','text','String','迭代', ...
                       'Position', [355 20 40 20]);
    h_textClassNum = uicontrol('Style','text','String','中心点', ...
                       'Position', [140 20 55 20]);
     uicontrol('Style','text','String','样本点数:', ...
                       'Position', [25 20 50 20]);
    h_textshow = uicontrol('Style','text','String','0','Position', [500 20 20 20]);
    set(gca,'xtick',[],'ytick',[],...
        'title',text('string','Kmeans演示脚本','color','k'));
    xlim([-1.5 1.5]);ylim([-1.5 1.5]);
    %%%%%%%%%%%%%%%%%%%%
    function SpsfPoit(hObj,event,ax)
    set(h_slider,'value',0);    %清零滑动条,以实现从0迭代
    cla;%清空axes
    set(h_textshow,'string',0);%界面显示的迭代次数清零
    %句柄赋值为空
    h_plotCenterPoint = [];
    h_plotPath = [];
    centerPointPathAarry = [];%轨迹归零
    plot(gca, data(:,1), data(:,2), '*', 'color', 'k');%样本点颜色初始化
    val = get(hObj, 'Value');%获得popup menu的值
    if val == 1
        %选择任意若干点作为中心点
         [x, y] = ginput;
         centerPoint = [x y];
        [classNum, ~] = size(centerPoint);
       repaintBeginPoint(h_plotCenterPoint, classNum, centerPoint);
    elseif val == 2
        %选择任意2点作为中心点
       centerPoint = rand(2, 2)*2-0.5;
       [classNum, ~] = size(centerPoint);
       repaintBeginPoint(h_plotCenterPoint, classNum, centerPoint);
    elseif val == 3
       %选择任意3点作为中心点
       centerPoint = rand(3, 2)*2-0.5;
        [classNum, ~] = size(centerPoint);
        repaintBeginPoint(h_plotCenterPoint, classNum, centerPoint);
    elseif val == 4
        %选择任意4点作为中心点
        centerPoint = rand(4,2)*2-0.5;
        [classNum,~] = size(centerPoint);
        repaintBeginPoint(h_plotCenterPoint, classNum, centerPoint);
    end
      [labelSample] = classifyAndShowAndLabel(classNum, centerPoint, data, samNum, gca);
      centerPointPathAarry = [centerPointPathAarry; reshape(centerPoint', 1, classNum*2)];
      set(h_textClassNum, 'string', [num2str(classNum) '个中心点']);
    end
    %%%%%%%%%%%%%%%%%%%%%%%%%%%%%%%%%%%%%%%
    %%%%%%%%%%%%迭代分类函数%%%%%%%%%%%%%%%%%%%%
    function classify(hObj,event,ax)
        iterNum = round(get(hObj, 'value'));
         set(h_textshow, 'string', iterNum);
           %根据起始点分类,并且为不同的类标记不同颜色,返回带标签样本数据
           [labelSample] = classifyAndShowAndLabel(classNum, centerPoint, data, samNum, gca);
          %重新获得起始点矩阵centerPoint(x|y)
          [centerPoint] = recalClassCenter(labelSample, classNum);
         centerPointPathAarry = [centerPointPathAarry; reshape(centerPoint', 1, classNum*2)];
         %重新绘制起始点centerPoint(x|y)到axes上
         repaintBeginPoint(h_plotCenterPoint, classNum, centerPoint);
        disp('path:');
        disp(centerPointPathAarry);%将中心点的轨迹显示出来
        for i = 1:classNum
             [selected_color] = colorMap(i, classNum);
            h_plotPath(i)=plot(centerPointPathAarry(:, (i*2)-1), centerPointPathAarry(:,i*2), 'color',  selected_color);
        end
    end

    %%%%%%%%%%%%%%%函数部分%%%%%%%%%%%%%%%%%%%%%%%%%%%%
    %%%%%%%%%%%%%%%%%%%%%%%%%%%%%%%%%%%%%%%%%%%%%%%%%
    %%%%%%%%%%%%%%%重新绘制起始点函数%%%%%%%%%
        function repaintBeginPoint(handle_plo,classnum,R)
           delete(h_plotCenterPoint);%清除绘制的中心点,并将句柄赋值为空
            h_plotCenterPoint=[];
            %重新绘制起始点,每个起始点的颜色不同
           for i = 1:classnum
            [selected_color] = colorMap(i, classnum);
            h_plotCenterPoint(i) = plot(R(i,1), R(i,2), 'o', 'MarkerSize', 7, 'MarkerFaceColor', selected_color);
        end
        end
    %%%%%%%%%%%%%%%%%%%%%%%%%%%%%%%%%%%%%%%%%%%%%%%%%%
    %%%%%%%%%%%%%%%%%%%%重新计算类重心%%%%%%%%%%%%%%%%%%%%%%
        function [newCenterPoint]=recalClassCenter(labelSample,classNum)
            %R为重新被计算的类中心
            newCenterPoint=[];
           %分类并且计算每个类的重心
          for i=1:classNum
               %取出所有标签为i类的所有行,即第i类的所有点
               classs=labelSample(labelSample(:,3)==i,:);
                 %有用的只有第一列和第二列,去除标签列
               classs=[classs(:,1),classs(:,2)];
              %重新计算重心
               classs_repoint=mean(classs);
               newCenterPoint=[newCenterPoint;classs_repoint];
          end
        end
    %%%%%%%%%%%%%%%%%%%%%%%%%%%%%%%%%%%%%%%%%%%%%%%%%%%%
    %%%%%%根据起始点分类,并且为不同的类标记不同颜色,返回带标签样本数据%%%%%%%%%
       function [labelSample]=classifyAndShowAndLabel(classNum,centerPoint,data1,samNum,gca)
         disArray=[];
        for i=1:classNum
            calproA=[centerPoint(i,:);data1(:,1),data1(:,2)];
            Adist=pdist(calproA,'euclidean');
            Adist=Adist(1:samNum)';
            disArray=[disArray,Adist];
        end
      %拼接,得到距离矩阵,一列代表一个点到所有样本点的距离
      %disArray=[Adist Bdist];
      %disp(disArray);
      %获取每一行最小值所在距离矩阵的列
      %并和原样本矩阵拼接为labelSample
      %labelSample 表示被标记的原始样本,每一行为一个样本
      %每一行的最后一列为标记值,在这里标记是距离哪个样本点最近。
       minn=min(disArray');
       cols=[];
      for i=1:length(minn)
          [row,col] = find(disArray==minn(i));
          cols(i)=col;
      end
      cols=cols';
       labelSample=[data1(:,1),data1(:,2),cols];
       %将不同类的点标上不同的颜色
       for i=1:samNum
            [selected_color]=colorMap(labelSample(i,3),classNum);
           plot(gca,data1(i,1),data1(i,2),'*','color',selected_color);
       end
       end
    %%%%%%%%%%%%%%%%%%%%%%%%%%%%样本点选择并绘制函数%%%%%%%%%%%%%%%%%%%%%%%%%%%
        function paintRandomPoint(hObj,event,ax)
            textt = get(hObj, 'string');
            samNum = str2num(textt);
            data = mvnrnd(mu, var, samNum);
            cla;
            set(h_slider,'value',0);    %清零滑动条,以实现从0迭代
            plot(ax,data(:,1), data(:,2), '*', 'color', 'k');hold on;
        end
end
colorMap.m
function [selected_color] = colorMap(num, max_color_value)
    %颜色映射函数,输入一个数值范围0-max_clor_value,将
    %颜色空间映射到0-max_clor_value的数值中去,输入一个
    % 这个范围里面的数num,可以返回一个颜色值selected_color
    % jet_color = colormap(hsv(max_color_value));
    % jet_color = colormap(cool(max_color_value));
    % jet_color = colormap(hot(max_color_value));
    % jet_color = colormap(pink(max_color_value));
    % jet_color = colormap(gray(max_color_value));
    % jet_color = colormap(pink(max_color_value));
    % jet_color = colormap(bone(max_color_value));
    jet_color = colormap(jet(max_color_value));
    % jet_color = colormap(copper(max_color_value));
    % jet_color = colormap(prim(max_color_value));
    % jet_color = colormap(flag(max_color_value));

    selected_color = jet_color(num,:);
可以复制上面的代码,或者可以到以下链接下载:https://download.csdn.net/download/qq_33826564/10574319
GitHub: https://github.com/swq123459/Kmeans-GUI