echarts常用属性解析
刚开始使用配置项手册的时候最深的感受就是不知道哪个参数对应哪个属性,什么鬼,于是开始看demo结合百度各种搜才能基本满足设计图的要求,下面我总结了几种典型的配置属性以供参考,凑合看看,不是很下饭。
(以折线图(Line)为例)
1. title(标题组件:包含主标题和副标题)
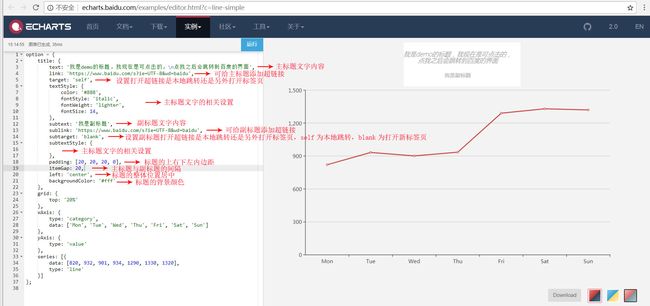
标题组件中一般包含主标题和副标题的文字属性设置,添加超链接的设置,标题组件的内边距、主标题与副标题的间距设置,标题组件的位置设置,背景,边框,阴影设置,图层值设置等,废话不多说,请直接看图:
title: {
  text: '我是demo的标题,我现在是可点击的,\n点我之后会跳转到百度的界面',
  link: 'https://www.baidu.com/',
  target: 'self',
  textStyle: {
    color: '#888',
    fontStyle: 'italic',
    fontWeight: 'lighter',
    fontSize: 14
  },
  subtext: '我是副标题',
  sublink: 'https://www.baidu.com/',
  subtarget: 'blank',
  subtextStyle: {},
  padding: [20, 20, 20, 0],
  itemGap: 20,
  left: 'center',
  backgroundColor:'#fff'
}
2.legend(图例组件)
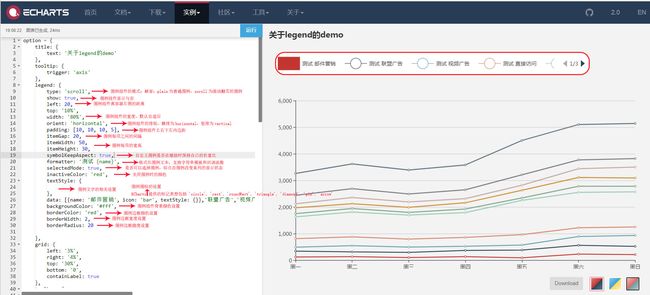
图例组件中一般包含图例组件的类型,位置,宽度,排版模式,内边距,每项图例之间的边距,宽高,是否在缩放时保持自身的长宽比,格式化文本,关闭图例时的颜色, 图例文字的相关设置,图例形状的相关设置,组件背景颜色,组件边框以及组件边框圆度等的设置:
legend: {
  type: 'scroll',
  show: true,
  left: 20,
  top: '10%',
  width: '80%',
  orient: 'horizontal',
  padding: [10, 10, 10, 5],
  itemGap: 20,
  itemWidth: 50,
  itemHeight: 30,
  symbolKeepAspect: true,
  formatter: '测试 {name}',
  selectedMode: true,
  inactiveColor: 'red',
  textStyle: {},
  data: [
    {
      name: '邮件营销',
      icon: 'bar',
      textStyle: {}
    },
    '联盟广告',
    '视频广告',
    '直接访问',
    '邮件营销1',
    '联盟广告1',
    '视频广告1',
    '直接访问1'
  ],
  backgroundColor: '#fff',
  borderColor: 'red',
  borderWidth: 2,
  barBorderRadius: 20
}
3.grid(直角坐标系内绘图网格)
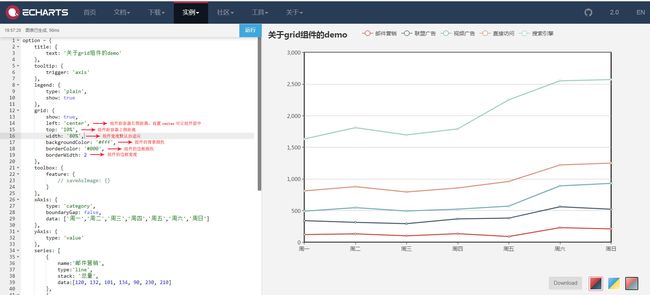
绘图网格组件一般包含位置,背景颜色,边框颜色边框宽度等的设置:
grid: {
  show: true,
  left: 'center',
  top: '10%',
  width: '80%',
  backgroundColor: '#fff',
  borderColor: '#000',
  borderWidth: 2
}
(以柱状图(Bar)为例)
4.xAxis(直角坐标系grid的x轴)
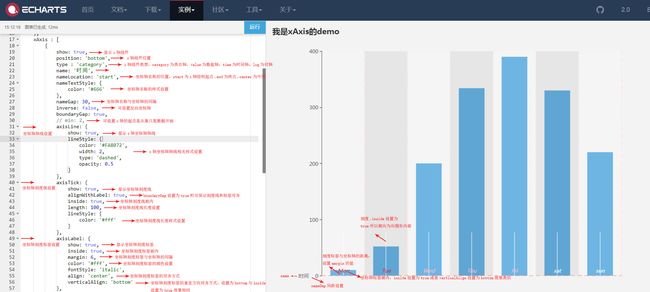
该组件可设置x的标签,刻度,轴线,网格,分隔区域,高亮提示等部分,具体可看案例:
 xAxis: [
  {
    show: true,
    position: 'bottom',
    type : 'category',
    name: '时间',
    nameLocation: 'start',
    nameTextStyle: {
      color: '#666'
    },
    nameGap: 30,
    inverse: false,
    boundaryGap: true,
    // min: 2,
    axisLine: {
      show: true,
      lineStyle: {
        color: '#FA8072',
        width: 2,
        type: 'dashed',
        opacity: 0.5
      }
    },
    axisTick: {
      show: true,
      alignWithLabel: true,
      inside: true,
      length: 100,
      lineStyle: {
        color: '#fff'
      }
    },
    axisLabel: {
      show: true,
      inside: true,
      margin: 6,
      color: '#fff',
      fontStyle: 'italic',
      align: 'center',
      verticalAlign: 'bottom'
    },
    splitLine: {
      show: true,
      lineStyle: {
        color: '#FFE4E1',
        width: 2,
        type: 'dashed'
      }
    },
    splitArea: {
      show: true,
      areaStyle: {}
    },
    data: [
      {
        value: 'Mon',
        textStyle: {
          color: 'red'
        }
      },
      {
        value: 'Tue',
        textStyle: {
          color: 'red'
        }
      },
      {
        value: 'Wed',
        textStyle: {
          color: 'pink'
        }
      },
      {
        value: 'Thu',
        textStyle: {
          color: 'pink'
        }
      },
      {
        value: 'Fri',
        textStyle: {
          color: 'pink'
        }
      },
      'sat',
      'sun'
    ],
    axisPointer: {
      show: true,
      type: 'shadow',
      label: {},
      lineStyle:{}
    },
    z: 2
  }
]
以下图片为设置xAxis组件基本信息,坐标轴轴线设置,刻度线设置,刻度标签设置等信息:
以下图片为设置xAxis组件网格线,分隔区域以及数据的相关设置:
5.dataZoom(框选型数据区域缩放组件)
可设置多个区域缩放组件,位于dataZoom数组内,有两种形式组件类型,slider和inside下文设置以slider为例:
 dataZoom: {
        type: 'slider',
        show: true,
        backgroundColor: '#87CEFA',
        dataBackground: {
            lineStyle: {
                color: '#000'
            },
            areaStyle: {
                color: 'red'
            }
        },
        borderColor: 'green',
        // handleIcon: 'image://http://xxx.xxx.xxx/a/b.png',
        // handleSize: '100%',
        textStyle: {
            color: 'red'
        },
        orient: 'horizontal',
        left: 'center'
    }
以下为配置的效果图说明:
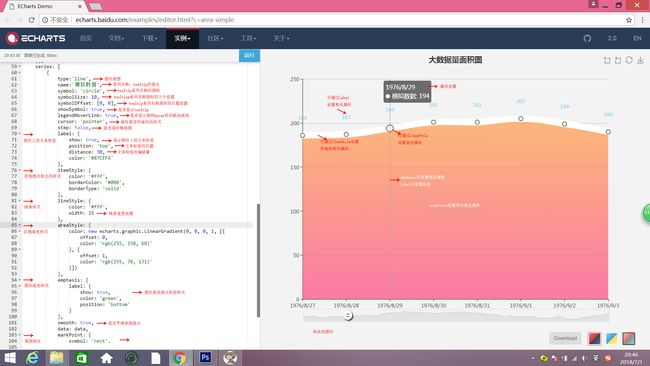
6.series(系列列表):
系列图可对各种类型的图形按照设计图的要求进行具体配置,以下实例以line图为例:
  series: [
        {
            type:'line',
            name:'模拟数据',
            symbol: 'circle',
            symbolSize: 10,
            symbolOffset: [0, 0],
            showSymbol: true,
            legendHoverLink: true,
            cursor: 'pointer',
            step: false,
            label: {
                show: true,
                position: 'top',
                distance: 30,
                color: '#87CEFA'
            },
            itemStyle: {
                color: '#fff',
                borderColor: '#000',
                borderType: 'solid'
            },
            lineStyle: {
                color: '#fff',
                width: 15
            },
            areaStyle: {
                color: new echarts.graphic.LinearGradient(0, 0, 0, 1, [{
                    offset: 0,
                    color: 'rgb(255, 158, 68)'
                }, {
                    offset: 1,
                    color: 'rgb(255, 70, 131)'
                }])
            },
            emphasis: {
                label: {
                    show: false,
                    color: 'green',
                    position: 'top'
                }
            },
            smooth: true,
            data: data,
            markPoint: {
                symbol: 'rect',
                symbolSize: 50,
                label: {},
                itemStyle: {},
                emphasis: {},
                data: []
            }
        }
    ]
今天就写到这里了,echarts配置项手册还有很多很多内容,遇到了就去翻翻手册吧。
