参考文献:http://pyecharts.org/#/zh-cn/
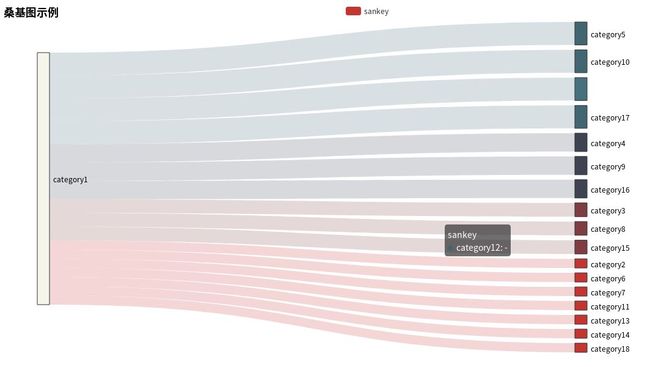
使用桑基图sankey可以实现对流量的形象化分析,准备使用其做流量分析。
1、定义模板
参见:http://pyecharts.org/#/zh-cn/flask
相应的js文件可以从两个地方获取:
第一个地方是(案例程序):https://github.com/pyecharts/pyecharts-app
第二地方是(开发者库):https://github.com/pyecharts/assets
将获取的js文件放入static/echarts/中。
html文件放入 templates/中。
2、编写flask文件
#!/usr/bin/env python2
# -*- coding: utf-8 -*-
import random
from pyecharts import Scatter3D
from pyecharts import Sankey
from flask import Flask, render_template
import socket
app = Flask(__name__)
nodes = [
{'name': 'category1'}, {'name': 'category2'}, {'name': 'category3'},
{'name': 'category4'}, {'name': 'category5'}, {'name': 'category6'},
{'name': 'category7'}, {'name': 'category8'}, {'name': 'category9'},
{'name': 'category10'}, {'name': 'category11'}, {'name': 'category12'},
{'name': 'category13'}, {'name': 'category14'}, {'name': 'category15'},
{'name': 'category16'}, {'name': 'category17'}, {'name': 'category18'}
]
links = [
{'source': 'category1', 'target': 'category2', 'value': 10},
{'source': 'category1', 'target': 'category3', 'value': 15},
{'source': 'category1', 'target': 'category4', 'value': 20},
{'source': 'category1', 'target': 'category5', 'value': 25},
{'source': 'category1', 'target': 'category6', 'value': 10},
{'source': 'category1', 'target': 'category7', 'value': 10},
{'source': 'category1', 'target': 'category8', 'value': 15},
{'source': 'category1', 'target': 'category9', 'value': 20},
{'source': 'category1', 'target': 'category10', 'value': 25},
{'source': 'category1', 'target': 'category11', 'value': 10},
{'source': 'category1', 'target': 'category12', 'value': 25},
{'source': 'category1', 'target': 'category13', 'value': 10},
{'source': 'category1', 'target': 'category14', 'value': 10},
{'source': 'category1', 'target': 'category15', 'value': 15},
{'source': 'category1', 'target': 'category16', 'value': 20},
{'source': 'category1', 'target': 'category17', 'value': 25},
{'source': 'category1', 'target': 'category18', 'value': 10}
]
@app.route("/")
def hello():
s3d = scatter3d()
return render_template(
"pyecharts.html",
myechart=s3d.render_embed(),
script_list=s3d.get_js_dependencies(),
)
@app.route('/sankey')
def sankexy():
_sankey = sankeyexm()
return render_template(
"pyecharts.html",
myechart=_sankey.render_embed(),
script_list=_sankey.get_js_dependencies(),
)
def sankeyexm():
sankey = Sankey("桑基图示例", width=1200, height=600)
sankey.add("sankey",nodes,links,line_opacity=0.2,line_curve=0.5,line_color="target",is_label_show=True,label_pos="right",)
return sankey
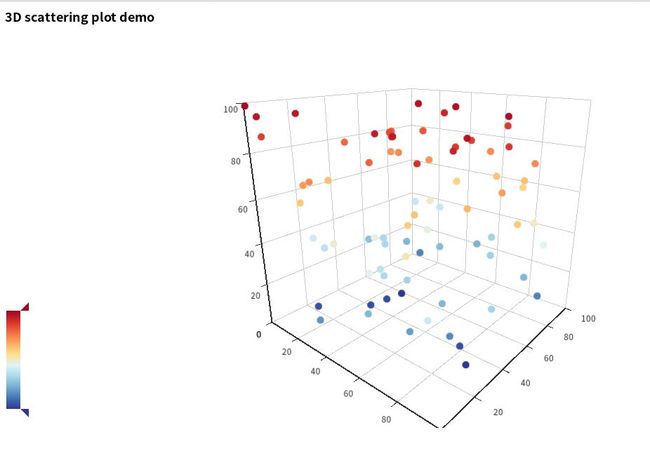
def scatter3d():
data = [generate_3d_random_point() for _ in range(80)]
range_color = [
"#313695",
"#4575b4",
"#74add1",
"#abd9e9",
"#e0f3f8",
"#fee090",
"#fdae61",
"#f46d43",
"#d73027",
"#a50026",
]
scatter3D = Scatter3D("3D scattering plot demo", width=1200, height=600)
scatter3D.add("", data, is_visualmap=True, visual_range_color=range_color)
return scatter3D
def generate_3d_random_point():
return [
random.randint(0, 100), random.randint(0, 100), random.randint(0, 100)
]
if __name__ == "__main__":
hostname = socket.gethostname()
ip = socket.gethostbyname( hostname )
print ip
app.run( host="0.0.0.0",port=5000,debug=False)
3、效果图
(1)桑基图
(2)3D散点图


