2020年4月14日,Sanger研究团队于nature communication在线发表了题为Single-cell transcriptomics identifies an effectorness gradient shaping the response of CD4+ T cells to cytokines的研究内容,作者使用蛋白质组学、bulk RNA-seq和单细胞转录组测序对人体40,000个以上的naïve and memory CD4+ T cells进行分析,发现细胞类型之间的细胞因子反应差异很大。memory T细胞不能分化为Th2表型,但可以响应iTreg极化获得类似Th17的表型。单细胞分析表明,T细胞构成了一个转录连续体(transcriptional continuum),从幼稚到中枢和效应记忆T细胞,形成了一种效应梯度,并伴随着趋化因子和细胞因子表达的增加。最后,作者表明,T细胞活化和细胞因子反应受效应梯度的影响。
该文献通过蛋白质组学((液相色谱-串联质谱法,LC-MS/MS)进行了探索性分析,样品对应于从健康个体的外周血中分离的幼稚和记忆T细胞,并用多种细胞因子刺激5天,每个条件平均3个生物学重复。
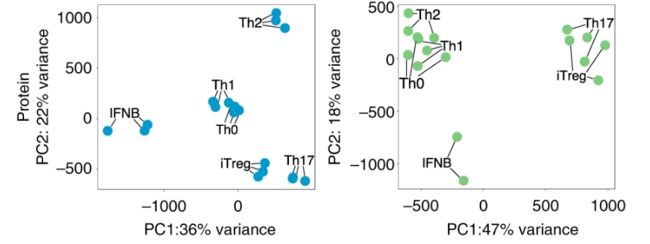
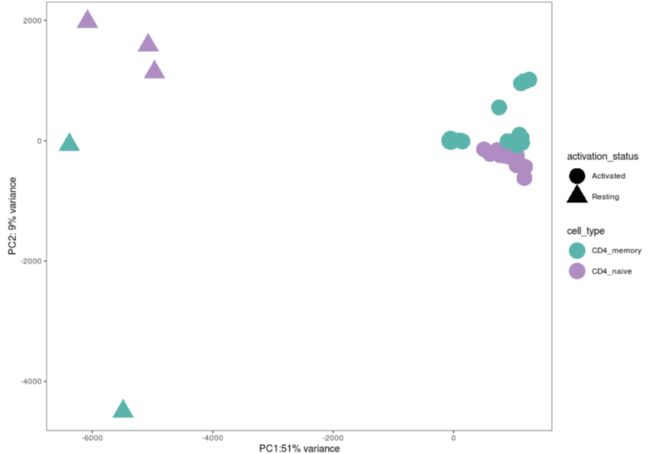
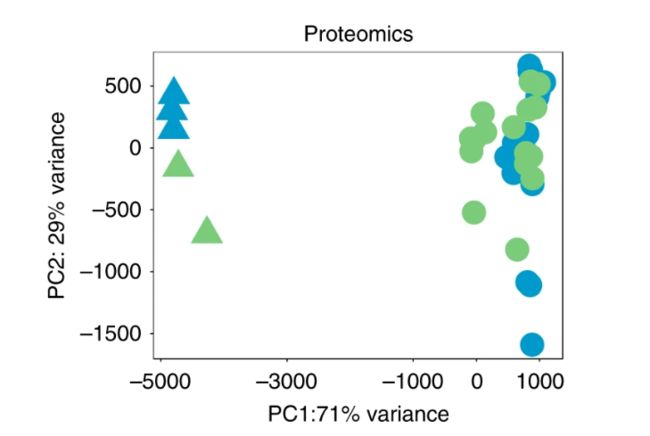
这次复现Fig1cPCA图和Fig2aPCA图的另一部分,这次作者是通过蛋白组学数据进行PCA的展现:
以上是Fig1c原图,图注为“PCA plots from the whole transcriptome of TN and TM cells. Different colors correspond to cell types and different shades to stimulation time points. PCA plots were derived using 21 naive and 19 memory T cell samples for proteomics”
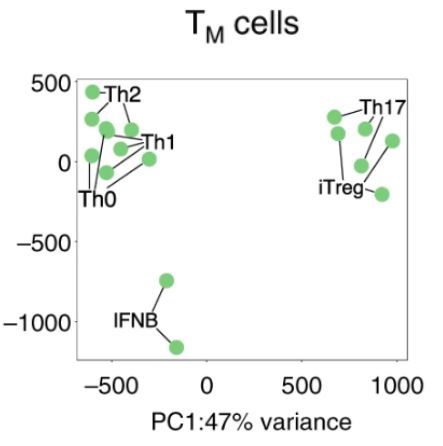
以上为Fig 2a原图,图注为“PCA plot from the full transcriptome of TN and TM cells following five days of cytokine stimulations. Only stimulated cells were included in this analysis. PCA plots were derived using 18 naive and 17 memory T cells samples ”
我们需要复现该图之前,先需要下载数据,可以点击https://www.opentargets.org/projects/effectorness对proteomics的abundances数据和metadata数据进行下载,然后进行以下步骤:
library(SummarizedExperiment)
library(annotables)
library(rafalib)
library(ggplot2)
library(ggrepel)library(limma)
加载数据
加载标准化后的丰度:
MassSpec_data <- read.table("NCOMMS-19-7936188_MassSpec_scaled_abundances.txt", header = T, stringsAsFactors = F)
View(MassSpec_data)#从以上可以看出,每列除了代表每个样本外,前三列分别为Protein_id,Gene_id和Gene_name,每行代表一个蛋白
建立SummarizedExperiment object
创建带有蛋白质注释的dataframe
protein_annotations <- data.frame(MassSpec_data[,c("Protein_id","Gene_id","Gene_name")], row.names = MassSpec_data$Gene_name)
rownames(MassSpec_data) <- MassSpec_data$Gene_name#构成一个由"Protein_id","Gene_id","Gene_name"的数据框MassSpec_data <- MassSpec_data[,-c(1:3)]
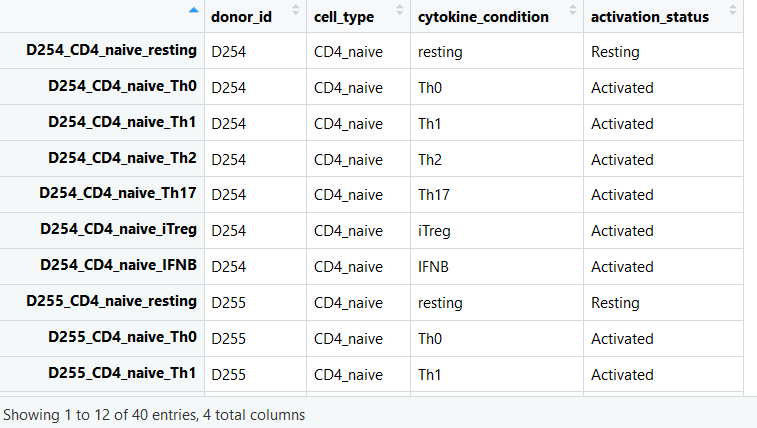
创建带有sample注释的dataframe
sample_ids <- colnames(MassSpec_data)
sample_annotations <- data.frame(row.names = sample_ids,
donor_id = sapply(sample_ids, function(x){strsplit(x, split = "_")[[1]][1]}),
cell_type = paste("CD4",
sapply(sample_ids, function(x){strsplit(x, split = "_")[[1]][3]}),
sep="_"),
cytokine_condition = sapply(sample_ids, function(x){strsplit(x, split = "_")[[1]][4]}),
stringsAsFactors = T)
sample_annotations$activation_status <- ifelse(sample_annotations$cytokine_condition == "resting", "Resting", "Activated")View(sample_annotations)
创建relevant metadata的变量
meta <- list(
Study="Mapping cytokine induced gene expression changes in human CD4+ T cells",
Experiment="Quantitative proteomics (LC-MS/MS) panel of cytokine induced T cell polarisations",
Laboratory="Trynka Group, Wellcome Sanger Institute",
Experimenter=c("Eddie Cano-Gamez",
"Blagoje Soskic",
"Deborah Plowman"),
Description="To study cytokine-induced cell polarisation, we isolated human naive and memory CD4+ T cells in triplicate from peripheral blood of healthy individuals. Next, we polarised the cells with different cytokine combinations linked to autoimmunity and performed LC-MS/MS.",
Methdology="LC-MS/MS with isobaric labelling",
Characteristics="Data type: Normalised, scaled protein abundances",
Date="September, 2019",
URL="https://doi.org/10.1101/753731")
建立SummarizedExperiment object
proteomics_data <- SummarizedExperiment(assays=list(counts=as.matrix(MassSpec_data)),
colData=sample_annotations,
rowData=protein_annotations,
metadata=meta)saveRDS(proteomics_data, file="proteinAbundances_summarizedExperiment.rds")
数据可视化
将NA值设置为零
注意:此操作仅出于可视化目的。执行统计测试时,NA不会设置为零。
assay(proteomics_data)[is.na(assay(proteomics_data))] <- 0定义函数:
提取蛋白质表达值;
进行主成分分析;
返回一个矩阵,其中包含每个样品和样品注释的PC坐标;
返回每个主要成分解释的方差百分比。
getPCs <- function(exp){
pcs <- prcomp(t(assay(exp)))
pVar <- pcs$sdev^2/sum(pcs$sdev^2)
pca.mat <- data.frame(pcs$x)
pca.mat$donor_id <- colData(exp)$donor_id
pca.mat$cell_type <- colData(exp)$cell_type
pca.mat$cytokine_condition <- colData(exp)$cytokine_condition
pca.mat$activation_status <- colData(exp)$activation_status
res <- list(pcs = pca.mat, pVar=pVar)
return(res)}
对所有样本执行PCA
pcs <- getPCs(proteomics_data)ggplot(data=pcs$pcs, aes(x=PC1, y=PC2, color=cell_type, shape=activation_status)) +
geom_point(size = 8) +
xlab(paste0("PC1:", round(pcs$pVar[1]*100), "% variance")) +
ylab(paste0("PC2: ", round(pcs$pVar[2]*100), "% variance")) +
scale_colour_manual(values = c("#5AB4AC","#AF8DC3")) +
scale_alpha_discrete(range = c(0.5,1)) +
coord_fixed() + theme_bw() +theme(panel.grid = element_blank())去掉个体间变异性:
proteomics_data_regressed <- proteomics_data
assay(proteomics_data_regressed) <- removeBatchEffect(assay(proteomics_data_regressed),
batch = factor(as.vector(colData(proteomics_data_regressed)$donor_id)))
重新计算PCA:
pcs <- getPCs(proteomics_data_regressed)ggplot(data=pcs$pcs, aes(x=PC1, y=PC2, color=cell_type, shape=activation_status)) +
geom_point(size = 8) +
xlab(paste0("PC1:", round(pcs$pVar[1]*100), "% variance")) +
ylab(paste0("PC2: ", round(pcs$pVar[2]*100), "% variance")) +
scale_colour_manual(values = c("#5AB4AC","#AF8DC3")) +
scale_alpha_discrete(range = c(0.5,1)) +
coord_fixed() + theme_bw() +theme(panel.grid = element_blank())原图
细胞类型特异性分析
将naive和memory T细胞样本分为仅包含受刺激细胞的两个不同数据集。
proteomics_data_naive <- proteomics_data[,(proteomics_data$cell_type=="CD4_naive") & (proteomics_data$activation_status=="Activated")]proteomics_data_memory <- proteomics_data[,(proteomics_data$cell_type=="CD4_memory") & (proteomics_data$activation_status=="Activated")]Naive T cells
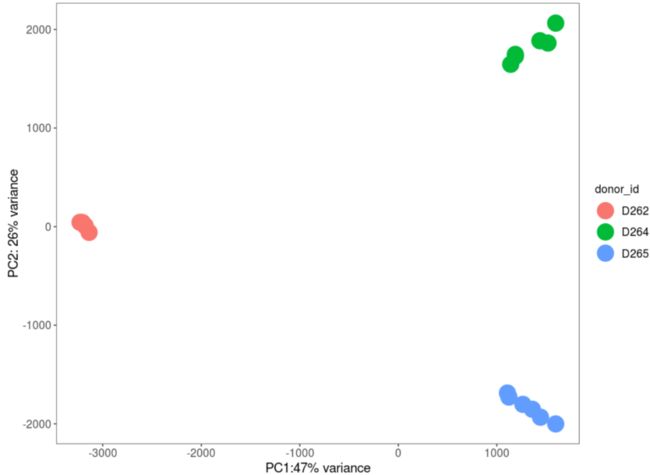
对 5 days-stimulated naive T cells进行PCA:
pcs_naive <- getPCs(proteomics_data_naive)
ggplot(data=pcs_naive$pcs, aes(x=PC1, y=PC2)) + geom_point(aes(color=donor_id), size=8) +
xlab(paste0("PC1:", round(pcs_naive$pVar[1]*100), "% variance")) +
ylab(paste0("PC2: ", round(pcs_naive$pVar[2]*100), "% variance")) +
coord_fixed() + theme_bw() +theme(plot.title=element_text(size=20, hjust=0.5), axis.title=element_text(size=14), panel.grid = element_blank(), axis.text=element_text(size=12),legend.text=element_text(size=12), legend.title=element_text(size=12), legend.key.size = unit(1.5,"lines"))
去掉个体间变异性:
assay(proteomics_data_naive) <- removeBatchEffect(assay(proteomics_data_naive),
batch = factor(as.vector(colData(proteomics_data_naive)$donor_id))
)
pcs_naive <- getPCs(proteomics_data_naive)
ggplot(data=pcs_naive$pcs, aes(x=PC1, y=PC2, color=cytokine_condition)) +
geom_point(size = 8) + geom_label_repel(aes(label=cytokine_condition, color=cytokine_condition)) +
xlab(paste0("PC1: ", round(pcs_naive$pVar[1]*100), "% variance")) +
ylab(paste0("PC2: ", round(pcs_naive$pVar[2]*100), "% variance")) +
scale_colour_brewer(palette = "Dark2") +
scale_fill_brewer(palette = "Dark2") +
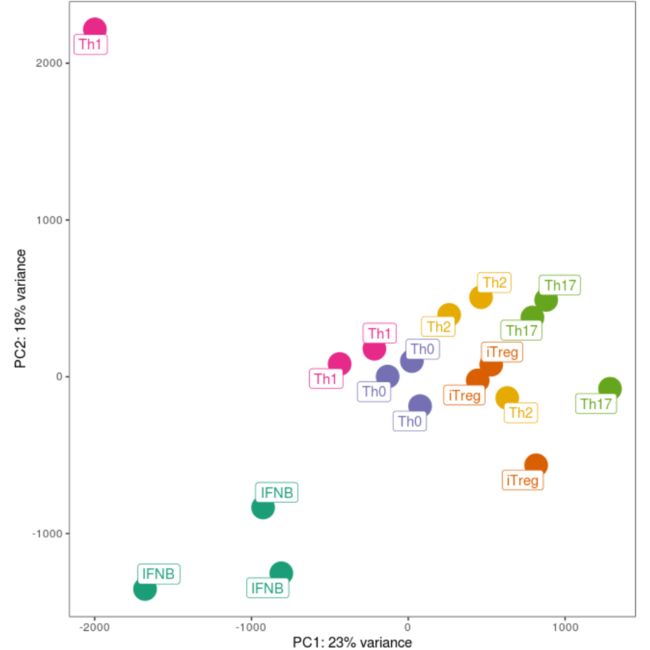
coord_fixed() + theme_bw() +theme(panel.grid = element_blank(), legend.position = "none")
删除由PCA标识的异常样本:
proteomics_data_naive <- proteomics_data_naive[, colnames(proteomics_data_naive) != "D257_CD4_naive_Th1"]pcs_naive <- getPCs(proteomics_data_naive)ggplot(data=pcs_naive$pcs, aes(x=PC1, y=PC2, color=cytokine_condition)) +
geom_point(size = 8) + geom_label_repel(aes(label=cytokine_condition, color=cytokine_condition)) +
xlab(paste0("PC1: ", round(pcs_naive$pVar[1]*100), "% variance")) +
ylab(paste0("PC2: ", round(pcs_naive$pVar[2]*100), "% variance")) +
scale_colour_brewer(palette = "Dark2") +
scale_fill_brewer(palette = "Dark2") +
coord_fixed() + theme_bw() +theme(panel.grid = element_blank(), legend.position = "none")原图
Memory T cells
again。。。
Performing PCA on 5 days-stimulated memory T cells only.
```{r compute_pca_naive, message=FALSE, warning=FALSE}pcs_memory <- getPCs(proteomics_data_memory)
ggplot(data=pcs_memory$pcs, aes(x=PC1, y=PC2)) + geom_point(aes(color=donor_id), size=8) +
xlab(paste0("PC1:", round(pcs_memory$pVar[1]*100), "% variance")) +
ylab(paste0("PC2: ", round(pcs_memory$pVar[2]*100), "% variance")) +
coord_fixed() + theme_bw() +theme(plot.title=element_text(size=20, hjust=0.5), axis.title=element_text(size=14), panel.grid = element_blank(), axis.text=element_text(size=12),legend.text=element_text(size=12), legend.title=element_text(size=12), legend.key.size = unit(1.5,"lines"))Regressing out inter-individual variability
assay(proteomics_data_memory) <- removeBatchEffect(assay(proteomics_data_memory),
batch = factor(as.vector(colData(proteomics_data_memory)$donor_id)))
再次计算PCs
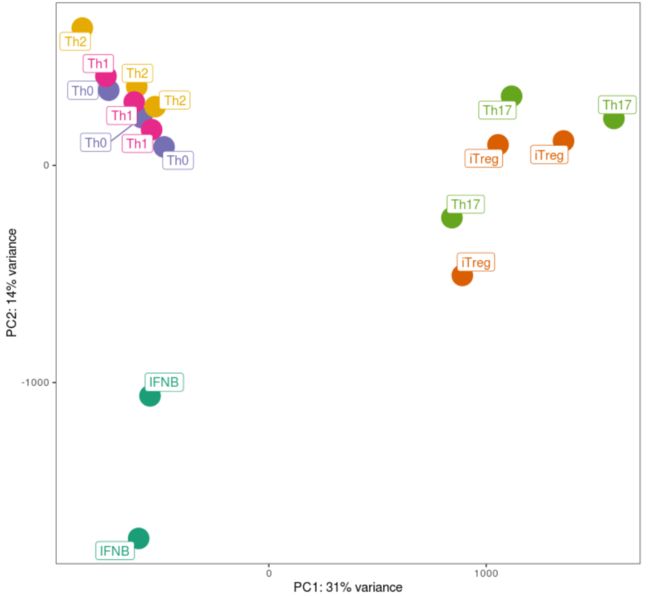
pcs_memory <- getPCs(proteomics_data_memory)ggplot(data=pcs_memory$pcs, aes(x=PC1, y=PC2, color=cytokine_condition)) +
geom_point(size = 8) + geom_label_repel(aes(label=cytokine_condition, color=cytokine_condition)) +
xlab(paste0("PC1: ", round(pcs_memory$pVar[1]*100), "% variance")) +
ylab(paste0("PC2: ", round(pcs_memory$pVar[2]*100), "% variance")) +
scale_colour_brewer(palette = "Dark2") +
scale_fill_brewer(palette = "Dark2") +
coord_fixed() + theme_bw() +theme(panel.grid = element_blank(), legend.position = "none")原图
基本分布还是差不多的,,,,
快去试一试呀!
你可能还想看
蛋白质组学研究概述
PCA主成分分析实战和可视化 附R代码和测试数据
用了这么多年的PCA可视化竟然是错的!!!
什么?你做的差异基因方法不合适?
NBT:单细胞转录组新降维可视化方法PHATE

