【神经网络与深度学习-TensorFlow实践】-中国大学MOOC课程(七)(数字图像基础))
【神经网络与深度学习-TensorFlow实践】-中国大学MOOC课程(七)(数字图像基础)
- 第7讲 数字图像基础
-
- 7.1 数字图像基本概念
-
- 7.1.1 图像的离散化
-
- 7.1.1.1 连续图像和数字图像
- 7.1.1.2 像素、位图、色彩深度/位深度、BMP格式
- 7.1.1.3 色彩模式
-
- 7.1.1.3.1 二值图像(Binary Image)
- 7.1.1.3.2 灰度图像(Gray Image)
- 7.1.1.3.3 彩色图像(RGB)
- 7.1.1.3.4 RGBA图像
- 7.1.1.3.5 256色彩色图像
- 7.1.1.3.6 CMYK-印刷四粉色
- 7.1.1.3.7 YCbCr
- 7.1.1.3.8 HSI 色彩模型
- 7.1.1.4 图像格式
- 7.1.1.5 图像压缩
- 7.1.1.5.1 JPEG格式
- 7.1.1.5.2 PNG格式(Portable Network Graphics,PNG)
- 7.1.1.5.3 GIF格式(Graphics Interchange Format)
- 7.1.1.5.4 TIFF格式(Tag Image File Format)
- 7.1.1.6 图像类型
-
- 7.1.1.6.1 平面二维图像
- 7.1.1.6.2 序列图像
- 7.1.1.6.3 深度图像(Depth Map):
- 7.2 Pillow图像处理库
-
- 7.2.1 一些图像处理库
-
- 7.2.1.1 matplotlib.image方式
- 7.2.1.2 PIL(Python Imaging Library)
- 7.2.2 Pillow库
-
- 7.2.2.1 安装和导入包/模块
-
- 7.2.2.1.1 Pillow的安装
- 7.2.2.1.2 导入PIL.image模块
- 7.2.2.1.3 导入matplotlib.pyplot模块
- 7.2.2.2 打开图像--Image.open()函数
- 7.2.2.3 保存图像-save()方法
- 7.2.2.4 图像对象的主要属性
- 7.2.2.5 显示图像
- 7.2.2.6 分别显示不同类别的图像
- 7.2.2.7 转换图像的色彩模式
- 7.2.2.8 颜色通道的分离与合并
- 7.2.2.9 转化为数组
-
- 7.2.2.9.1 将灰度图像lena_gray.bmp转化为数组(反色)
- 7.2.2.10 对图像的缩放、旋转和镜像
-
- 7.2.2.10.1 缩放图像
- 7.2.2.10.1.1 img.resize()方法
- 7.2.2.10.1.2 img.thumbnail()方法
- 7.2.2.10.2 旋转、镜像(即左右翻转)
- 7.2.2.11 裁剪图像
- 7.2.3 常用的图像处理库
- 7.3 实例:手写数字数据集MNIST
-
- 7.3.1 图像操作汇总表
- 7.3.2 MNIST数据集
-
- 7.3.2.1 下载MNIST数据集
- 7.3.2.2 输出训练集和测试集的长度
- 7.3.2.3 输出图像数据和标记数据的形状
- 7.3.2.4 显示手写数字图片
-
- 7.3.2.4.1 输出数据集中的第1个样本
- 7.3.2.4.2 显示图片
- 7.3.2.4.3 随机显示4幅手写数字图片
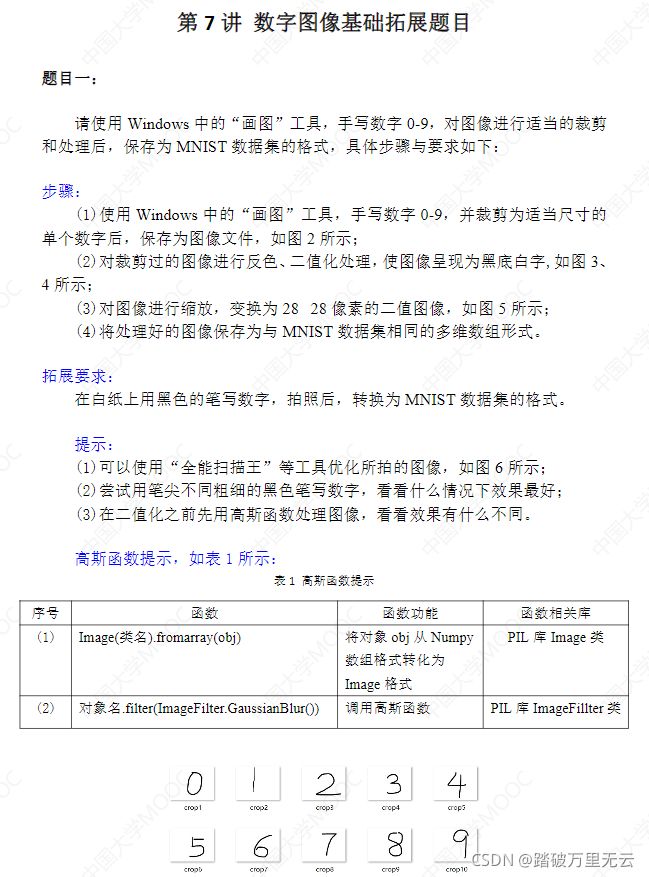
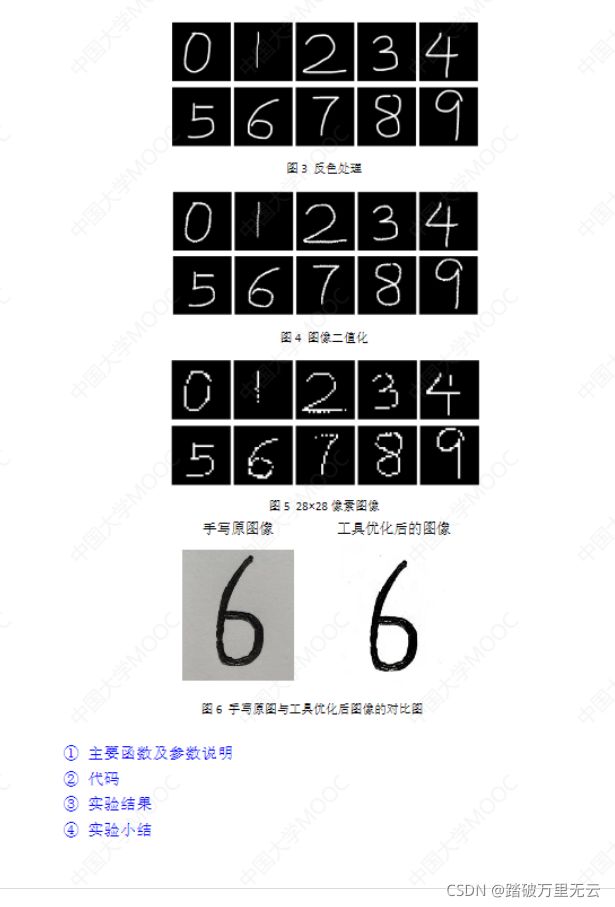
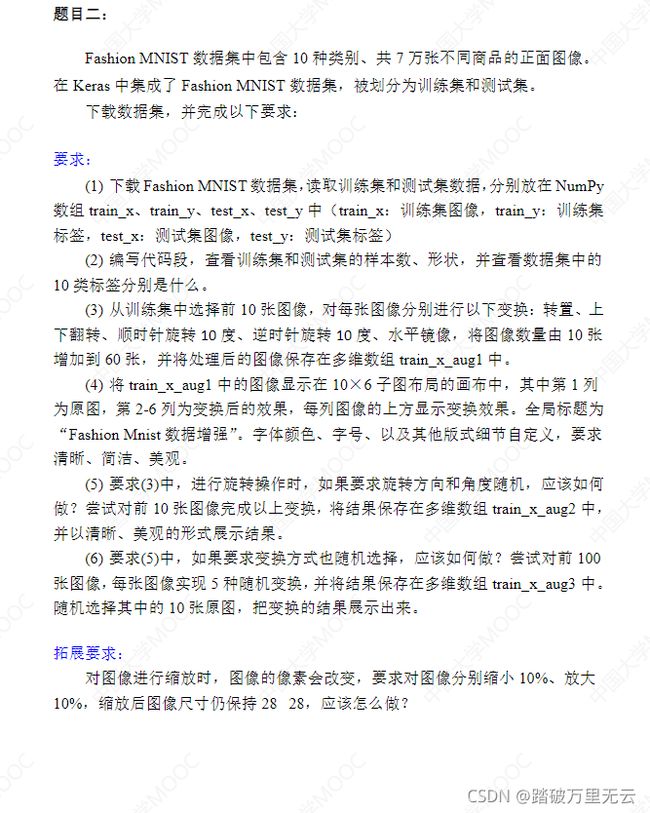
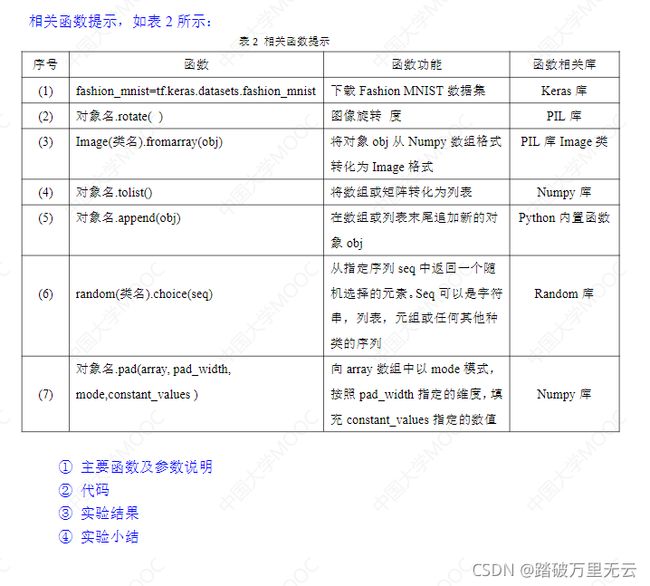
- 7.3.3 习题及相关库补充(未作,有时间写)
第7讲 数字图像基础
7.1 数字图像基本概念
- 有人说:计算机视觉是人工智能的大门(我不信),倒是一道门
- 计算机视觉成为人工智能应用方面的领头羊
- 本课实例都是与图像有关的
7.1.1 图像的离散化
7.1.1.1 连续图像和数字图像
- 连续图像:人眼直接感受到的图像
- 数字图像:把连续的图像数字化、离散化之后的图像,它是对连续图像的一种近似
7.1.1.2 像素、位图、色彩深度/位深度、BMP格式
图像是如何被离散化的?
- 像素(pixel):是图像中的一个最小单位
- 位图(bitmap):通过记录每一个像素值来存储和表达的图像
- 色彩深度/位深度:位图中每个像素点要用多少个二进制位来表示
- BMP格式:Windows系统的标准位图格式,他能够很好的兼容各种windows程序
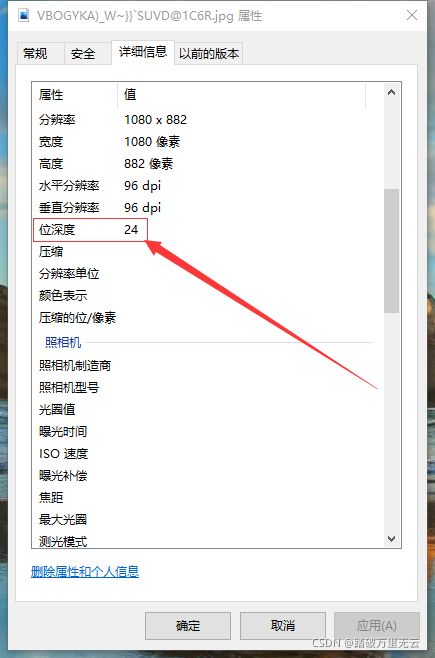
可以通过windows图片属性查看位深度,决定存储的字节数,这里称为24位真彩色
7.1.1.3 色彩模式
为什么称为真彩色,除了24位,还有那些喃?
7.1.1.3.1 二值图像(Binary Image)
- 每个像素只有2种可能的取值,使用1位二进制来表示,位深度为1;最简单的图像表示方式
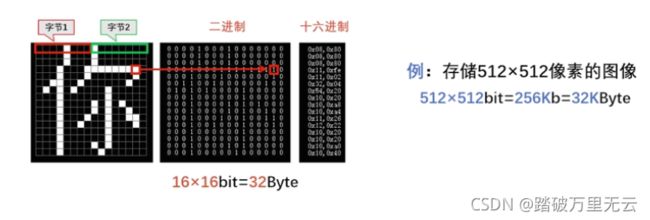
- 在图像处理和分析时,常常首先对图像进行二值化处理
凸显出感兴趣的目标,有效的减少数据量 - 只要是仅有两种颜色的图像,都可以被称为二进制图像
7.1.1.3.2 灰度图像(Gray Image)
7.1.1.3.3 彩色图像(RGB)
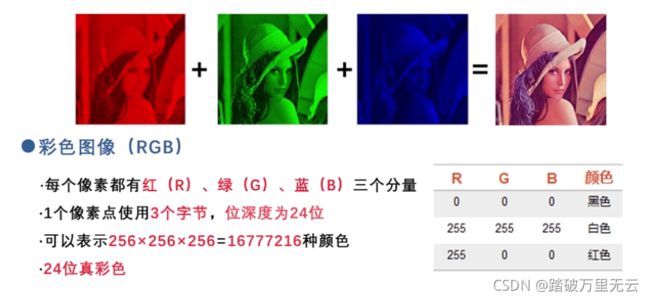
- 每个像素都有红(R)、绿(G)、蓝(B)三个分量
- 1个像素点使用3个字节,位深度为24位
- 可以表示256×256×256=16777216种颜色
- 对于人眼,已经可以反映出真实世界,所以称为24位真彩色
- 通常讲RGB三种分量称为通道,如红色通道
7.1.1.3.4 RGBA图像
- RGB图像+8位透明度信息Alpha
- 这个透明度称为透明度通道,或者Alpha通道
7.1.1.3.5 256色彩色图像
- 每个像素用8位二进制表示,是调色版中的索引值
- 二进制数并不代表确定的颜色,而是调色板中的索引值,对应的颜色是按照索引值在调色板中查询出来的
- 对于不同的图像,所对应的这256种颜色的集合是不一样的
- 在保存和加载这种类型的位图时,需要将调色板和图像一同保存和加载
7.1.1.3.6 CMYK-印刷四粉色
- 每个像素用32位二进制表示
- C:Cyan = 青色
- M:Magenta = 洋红色
- Y:Yellow = 黄色
- K:black = 黑色
7.1.1.3.7 YCbCr
- 是DVD、摄像机、数字电视等消费类视频产品中色彩编码方案
- Y:亮度分量
- Cb:蓝色亮度分量
- Cr:红色亮度分量
7.1.1.3.8 HSI 色彩模型
- 用H、S、I三个分量来描述
- H:色调
- S:饱和度
- I:亮度
7.1.1.4 图像格式
- BMP格式:占用存储空间大,不支持文件压缩,不适用于网页
7.1.1.5 图像压缩
- 适当降低图像质量来减小它所占用的空间
- 不同的图像压缩算法,对应不同得图像格式
7.1.1.5.1 JPEG格式
- 它是一种有损压缩方案
- 可以在保证高质量得前提下去除冗余的色彩和图像数据
- 压缩率高,所占空间小
- 可以压缩到原图的1/20大小,而图片的质量不会有明显的下降,非常适合存储照片以及在网页中显示照片
- 适合于色彩丰富、细节清晰细腻得大图像
- 不适合所含颜色较少,具有大块颜色相近得区域,或亮度差异十分明显的简单图片
- 每次编辑都会降低图像质量,不适合需要进行多次编辑的情况
7.1.1.5.2 PNG格式(Portable Network Graphics,PNG)
- 无损压缩,对图像本身质量的减损非常低,逐渐流行起来
- 适合于有规律渐变色彩的图像
- 对于色彩丰富,细节清晰细腻的大图表现效果不如JPEG格式
7.1.1.5.3 GIF格式(Graphics Interchange Format)
- 支持静态格式和动态格式
- 静态格式于JPEG格式的图片类似
- 动态图片由多幅图片保存为一个图片,循环显示,形成动画效果
- 只支持256色,适用于色彩简单、颜色较少的小图像
7.1.1.5.4 TIFF格式(Tag Image File Format)
- 是最复杂的一种图像格式
- 定义了4类不同类型的格式
- 二值图像(TIFF-B)
- 黑白灰度图像(TIFF-G)
- 带调色板的彩色图像(TIFF-P)
- RGB真彩图像(TIFF-R)
- 支持RGB、JPEG等多种编码方法
- 具有非常好的扩展性、方便性、可改性,是印刷行业中最常用的格式
- Web浏览器不支持TIFF格式
7.1.1.6 图像类型
7.1.1.6.1 平面二维图像
- 前面介绍的所有图像都是平面二维图像
7.1.1.6.2 序列图像
- 序列图像:时间上有一定顺序和间隔、内容上相关的一组图像
- 视频图像就是一种特殊的序列图像
- 其中的每幅图像称为帧图像
- 帧图像之间的时间间隔是固定的
7.1.1.6.3 深度图像(Depth Map):
- 是一种三维场景信息的表达方式
- 每个像素点的取值,代表这个点离摄像机的距离
- 采用灰度图表示,每个像素点由一个字节表示
- 深度图像中,像素点的取值并不代表实际的距离,颜色的深浅只是代表相对距离的远近
7.2 Pillow图像处理库
上节回顾
- 位图:通过记录每一个像素的颜色值,来存储和表达图像
- 图像格式:BMP、JPEG、PNG、GIF、TIFF
- 色彩模式:二值图像、灰度图像、RGB图像、RGBA图像、256色图像、CMYK、YCbCr、HSI
7.2.1 一些图像处理库
7.2.1.1 matplotlib.image方式
- 仅支持导入PBG格式的图像,且功能有限
7.2.1.2 PIL(Python Imaging Library)
- 功能丰富,且简单易用
- 但是仅支持Python2.x版本,且已经停止更新
7.2.2 Pillow库
- 在PIL的基础上发展而成的兼容版本
- 支持python 3
7.2.2.1 安装和导入包/模块
7.2.2.1.1 Pillow的安装
- 使用Anaconda已经安装好
- 使用pip命令安装
pip install pillow
7.2.2.1.2 导入PIL.image模块
- pillow的核心仍是PIL,所以在使用之前仍要导入PIL中image模块
from PIL import Image
- iamge模块中有一个image类,通过image类的函数和方法和属性完成对图像的读取、显示和简单的操作
7.2.2.1.3 导入matplotlib.pyplot模块
- 要使用matplotlib.pyplot来显示图片
import matplotlib.pyplot as plt
7.2.2.2 打开图像–Image.open()函数
Image.open(路径)# 返回image对象
有一个经常使用的图像叫做lena.tiff可以在网上下载,网址为http://www.lenna.org/
然后可以在该文件目录下打开
img = Image.open('lena.tiff')
得到图像对象img
7.2.2.3 保存图像-save()方法
图像对象.save(文件路径)
- 参数是被保存的文件路径
- 对于上述lena.tiff图片就是
img.save('test.tiff')
- save()方法不仅能够保存图像,还可以改变文件名的后缀,就可以转换图像格式
img.save('lena.jpg') # 将原图存储为jpg格式
img.save('lena.bmp') # 将原图存储为bpm格式
7.2.2.4 图像对象的主要属性
| 属性 | 说明 |
|---|---|
| 图像对象.format | 图像格式 |
| 图像对象.size | 图像尺寸 |
| 图像对象.mode | 色彩模式 |
例如:
>>> from PIL import Image
>>> import matplotlib.pyplot as plt

>>> img = Image.open('lena.tiff')
>>> img.save('test.tiff')
>>> img.save('test.jpg')
>>> img.save('test.bmp')
>>> img1 = Image.open("test.jpg")
>>> img2 = Image.open("test.bmp")


>>> print("image:",img.format)
image: TIFF
>>> print("image1:",img1.format)
image1: JPEG
>>> print("image2:",img2.format)
image2: BMP


>>> print("size:",img.size)
size: (512, 512)
>>> print("mode:",img.mode)
mode: RGB
7.2.2.5 显示图像
*可以使用matpltlib.pyplot模块中的 imshow()函数和show()函数显示图像
- **plt.figure()**首先创建画布
- **imshow()**函数负责对图像进行处理,并且显示它的格式
- 参数cmap=“gray”;意思是图像都是以灰度图像显示的
plt.imshow(image对象/Numpy数组)
- 然后调用**show()**函数显示出来
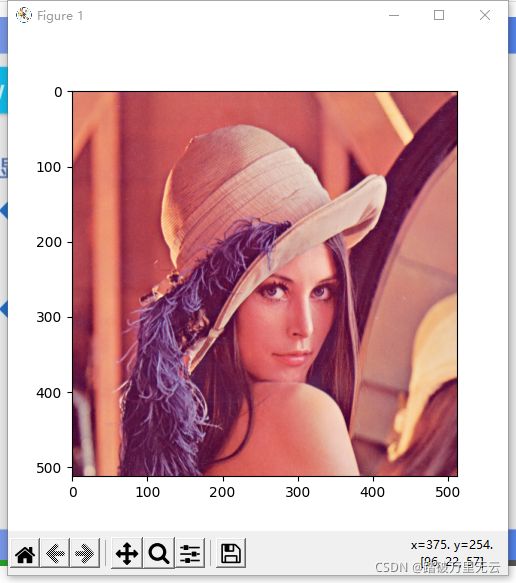
>>> plt.figure(figsize=(5,5))
<Figure size 500x500 with 0 Axes>
>>> plt.imshow(img)
<matplotlib.image.AxesImage object at 0x0000022508D1B908>
>>> plt.show()
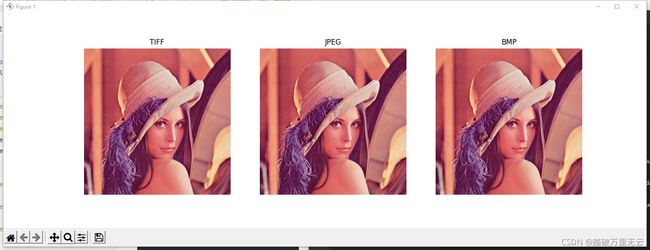
7.2.2.6 分别显示不同类别的图像
from PIL import Image
import matplotlib.pyplot as plt

img = Image.open('lena.tiff')
img.save('test.tiff')
img.save('test.jpg')
img.save('test.bmp')
img = Image.open("test.tiff")
img1 = Image.open("test.jpg")
img2 = Image.open("test.bmp")

plt.figure(figsize=(15,5))

plt.subplot(131)
plt.axis("off")
plt.imshow(img)
plt.title(img.format)

plt.subplot(132)
plt.axis("off")
plt.imshow(img1)
plt.title(img1.format)

plt.subplot(133)
plt.axis("off")
plt.imshow(img2)
plt.title(img2.format)

plt.show()
7.2.2.7 转换图像的色彩模式
| 取值 | 色彩模式 |
|---|---|
| 1 | 二值图像(每个像素8位二进制) |
| L | 灰度图像 |
| P | 8位彩色图像 |
| RGB | 24位彩色图像 |
| RGBA | 32位彩色图像 |
| CMYK | CMYK彩色图像 |
| YCbCr | YCbCr彩色图像 |
| I | 32位整型灰度图像 |
| F | 32位浮点灰度图像 |
图像对象.convert(色彩模式)
例如:
img_gray = img.convert("L")
print("mode=",img_gray.mode)

plt.figure(figsize=(5,5))
plt.imshow(img_gray)
plt.show()
输出结果为:
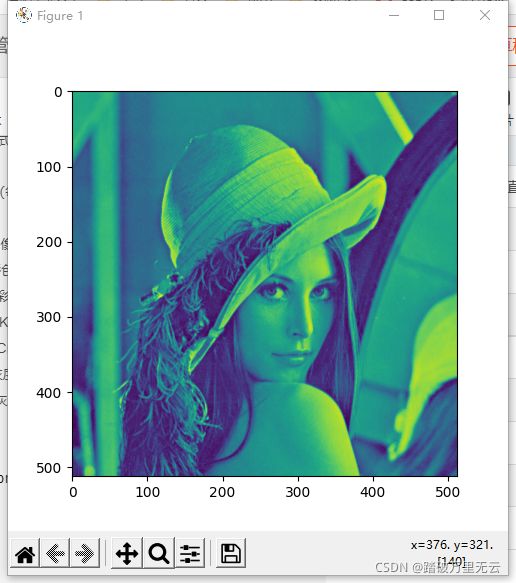
本来我寻思着为啥我这个还带点青色,难道我运行错了,本来想留着这个疑问,但是当我存储以后,发现是这样的:

还可以使用save()方法将其存储为新的文件
img_gray.save("lena_gray.bmp")
- 虽然使用convert()函数也可以把灰度图像转换为彩色图像,但是实际上很难恢复到原来的样子
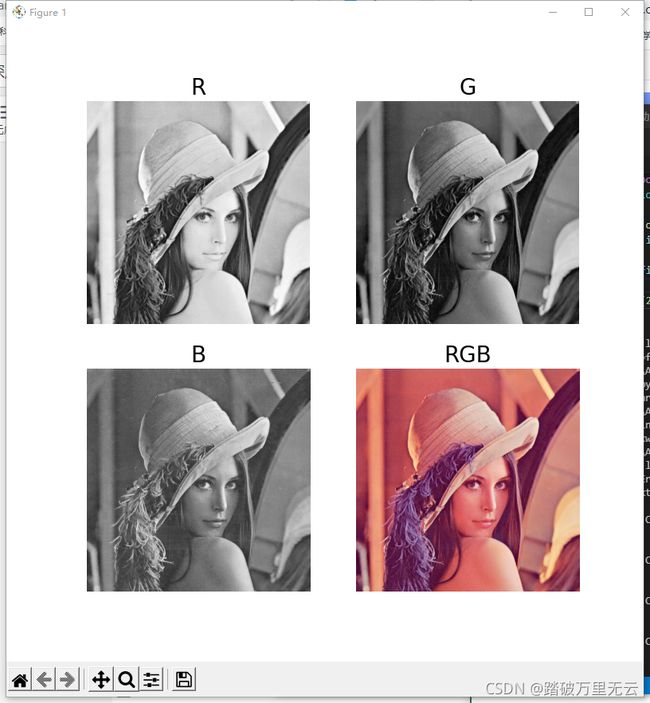
7.2.2.8 颜色通道的分离与合并
图像对象.split()
Image.merge(色彩模式,图像列表)
例如:
from PIL import Image
import matplotlib.pyplot as plt

img = Image.open('lena.tiff')
img_r,img_g,img_b = img.split()

plt.figure(figsize=(8,8))

plt.subplot(221)
plt.axis("off")
plt.imshow(img_r,cmap="gray")# cmap是以灰度的方式显示
plt.title("R",fontsize=20)

plt.subplot(222)
plt.axis("off")
plt.imshow(img_g,cmap="gray")
plt.title("G",fontsize=20)

plt.subplot(223)
plt.axis("off")
plt.imshow(img_b,cmap="gray")
plt.title("B",fontsize=20)

img_rgb = Image.merge("RGB",[img_r,img_g,img_b])
# 使用merge方法将所有的通道合并
plt.subplot(224)
plt.axis("off")
plt.imshow(img_rgb)
plt.title("RGB",fontsize=20)

plt.show()
- RGB通道采用灰度图表示颜色的亮度,R图R通道中中,颜色越浅,表示红色越亮,颜色越深,表示红色越暗
7.2.2.9 转化为数组
- 计算机处理图象时,有时候会先把转化为数组
- 数组中的元素对应像素中的各个像素点,然后再逐像素的进行计算和处理
- 将图像对象转化为numpy数组
np.array(图像对象)
import numpy as np
arr_img = np.array(img)
print("shape:",arr_img.shape,"\n")
print(arr_img)
输出结果为
shape: (512, 512, 3)

[[[226 137 125]
  [226 137 125]
  [223 137 133]
  ...
  [230 148 122]
  [221 130 110]
  [200  99  90]]

 [[226 137 125]
  [226 137 125]
  [223 137 133]

 ...


 [[ 82  22  57]
  [ 82  22  57]
  [ 96  32  62]
  ...
  [179  70  79]
  [181  71  81]
  [185  74  81]]]
7.2.2.9.1 将灰度图像lena_gray.bmp转化为数组(反色)
from PIL import Image
import matplotlib.pyplot as plt
import numpy as np
# 已经创建了lena_gray.bmp文件

img_gray = Image.open("lena_gray.bmp")
arr_img_gray = np.array(img_gray)
print("\nshape:",arr_img_gray.shape)
print(arr_img_gray)
输出结果为:
shape: (512, 512)

[[162 162 162 ... 170 155 128]
 [162 162 162 ... 170 155 128]
 [162 162 162 ... 170 155 128]
 ...
 [ 43  43  50 ... 104 100  98]
 [ 44  44  55 ... 104 105 108]
 [ 44  44  55 ... 104 105 108]]
我们可以对这个值做一些处理:
from PIL import Image
import matplotlib.pyplot as plt
import numpy as np

img_gray = Image.open("lena_gray.bmp")
arr_img_gray = np.array(img_gray)

# 新数组每个值都是原来的灰度值被255减去
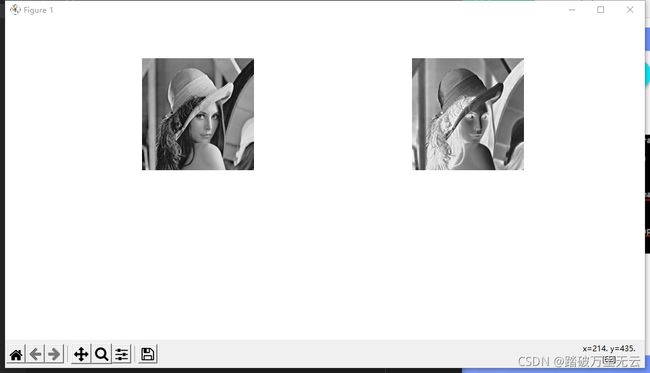
arr_img_new = 255 - arr_img_gray

plt.figure(figsize=(10,5))

plt.subplot(221)
plt.axis("off")
plt.imshow(arr_img_gray,cmap="gray")

plt.subplot(222)
plt.axis("off")
plt.imshow(arr_img_new,cmap="gray")

plt.show()
- 可以看到图像中的灰度和原图正好相反
- Image模块中还提供了很多封装好的函数,可以直接对图片进行更上层的处理,不用转换为数组,对像素进行运算
7.2.2.10 对图像的缩放、旋转和镜像
7.2.2.10.1 缩放图像
7.2.2.10.1.1 img.resize()方法
图像对象.resize((width,height))
例如:
from PIL import Image
import matplotlib.pyplot as plt
import numpy as np

img = Image.open("lena.tiff")

plt.figure(figsize=(5,5))
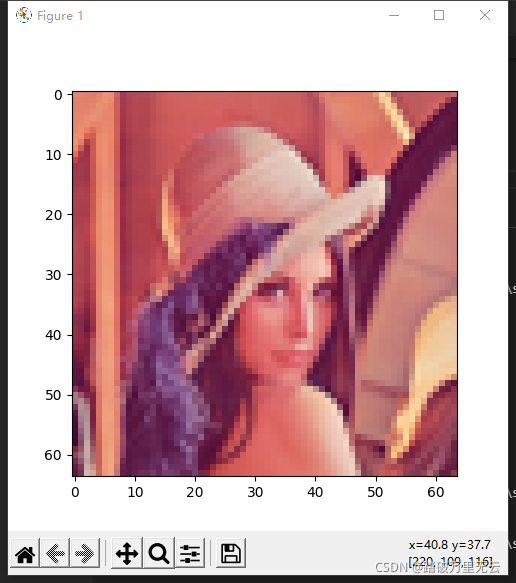
img_small = img.resize((64,64))

#将其保存起来
img_small.save("lena_s.jpg")

plt.imshow(img_small)
plt.show()
- 可以看到图片的质量明显下降了,出现了类似马赛克的效应,可以看到现在图片的尺寸已经变成了64*64,这个操作是一个降采样的过程
7.2.2.10.1.2 img.thumbnail()方法
- 该方法是原地操作,返回值是none
- 也就是说直接对img对象进行了缩放
7.2.2.10.2 旋转、镜像(即左右翻转)
图像对象.transpose(旋转方式)
- 通过参数选择旋转或者翻转的方式
| 参数 | 说明 |
|---|---|
| Image.FLIP_LEFT_RIGHT | 水平翻转 |
| Image.FLIP_TOP_BOTTOM | 上下翻转 |
| Image.ROTATE_90 | 逆时针旋转90° |
| Image.ROTATE_180 | 逆时针旋转180° |
| Image.ROTATE_270 | 逆时针旋转270° |
| Image.TRANSPOSE | 将图像进行转置 |
| Image.TRANSVERSE | 将图像进行转置,再水平翻转 |
例如:
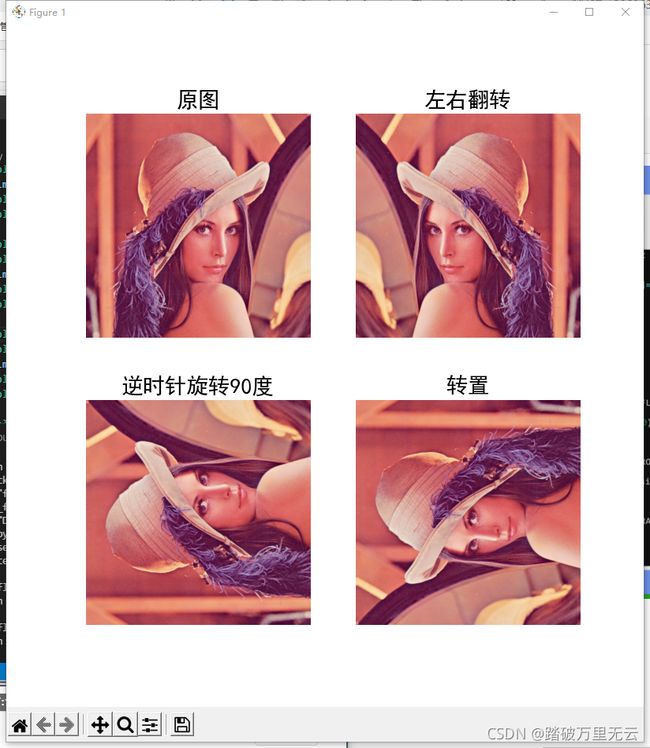
img_flr = img.transpose(Image.FLIP_LEFT_RIGHT)
img_r90 = img.transpose(Image.ROTATE_90)
img_tp = img.transpose(Image.TRANSPOSE)
例如,下面将这些变换的结果分别显示在不同的子途中
from PIL import Image
import matplotlib.pyplot as plt
import numpy as np

plt.rcParams['font.sans-serif'] = "SimHei"
img = Image.open("lena.tiff")

plt.figure(figsize=(10,10))

plt.subplot(221)
plt.axis("off")
plt.imshow(img)
plt.title("原图",fontsize=20)

plt.subplot(222)
plt.axis("off")
img_flr = img.transpose(Image.FLIP_LEFT_RIGHT)
plt.imshow(img_flr)
plt.title("左右翻转",fontsize=20)

plt.subplot(223)
plt.axis("off")
img_r90 = img.transpose(Image.ROTATE_90)
plt.imshow(img_r90)
plt.title("逆时针旋转90度",fontsize=20)

plt.subplot(224)
plt.axis("off")
img_tp = img.transpose(Image.TRANSPOSE)
plt.imshow(img_tp)
plt.title("转置",fontsize=20)

plt.show()
7.2.2.11 裁剪图像
- 裁剪图像:再图像上指定的位置裁剪出一个矩形区域
图像对象.crop((x0,y0,x1,y1))
- x0,y0 为左上角
- x1,y1 为右下角
- 返回值:图像对象
```python
img_region = img.crop((100,100,400,400))
例如:
from PIL import Image
import matplotlib.pyplot as plt

img = Image.open("lena.tiff")

plt.figure(figsize=(10,5))

plt.subplot(121)
plt.imshow(img)

plt.subplot(122)
img_region = img.crop((100,100,400,400))# 注意y轴是从上往下而从小到大的
plt.imshow(img_region)

plt.show()
7.2.3 常用的图像处理库
- skimage
- cv2
7.3 实例:手写数字数据集MNIST
7.3.1 图像操作汇总表
| 图像操作 | 方法/函数/属性 |
|---|---|
| 打开图像 | Image.open(路径) |
| 保存图像 | 图像对象.save() |
| 查看图像的属性 | 图像对象.format、图像对象.size、图像对象.mode |
| 显示图像 | plt.imshow(Image对象/Numpy数组) |
| 转移图像的色彩模式 | 图像对象.convert(色彩模式) |
| 颜色通道的分离和合并 | 图像对象.split()、Image.merge(色彩模式,图像列表) |
| 将图像转换为数组 | np.array(图像对象) |
| 图像的缩放 | 图像对象.resize((width,height)) |
| 旋转和镜像 | 图像对象.transpose(旋转方式) |
7.3.2 MNIST数据集
- Mixed National Institute of standards and Technology and Technology database
- New York University, Yann LeCun
- 60000条训练数据和10000条测试数据
- 由250个不同的人手写而成
- 都是28*28像素,灰度图像
- 将每一副图片存储在28*28的二维数组中,数组中的每个元素对应着图片中的每个像素
- MNIST数据集已经被集成在keras中了,可以使用keras中的datasets模块来访问它
7.3.2.1 下载MNIST数据集
import tensorflow as tf
mnist = tf.keras.datasets.mnist
(train_x,train_y),(test_x,test_y) = mnist.load_data()
第一次会先进行下载:
Downloading data from https://storage.googleapis.com/tensorflow/tf-keras-datasets/mnist.npz
 11493376/11490434 [==============================] - 12s 1us/step
- 下载路径:
C:\Users\Administrator\.keras\datasets\mnist.npz
7.3.2.2 输出训练集和测试集的长度
print("Training set:",len(train_x))
print("testing set:",len(test_x))
输出结果为:
Training set: 60000
testing set: 10000
7.3.2.3 输出图像数据和标记数据的形状
print("train_x:",train_x.shape,train_x.dtype)
print("trian_y:",train_y.shape,train_y.dtype)
输出结果为:
train_x: (60000, 28, 28) uint8
trian_y: (60000,) uint8
7.3.2.4 显示手写数字图片
7.3.2.4.1 输出数据集中的第1个样本
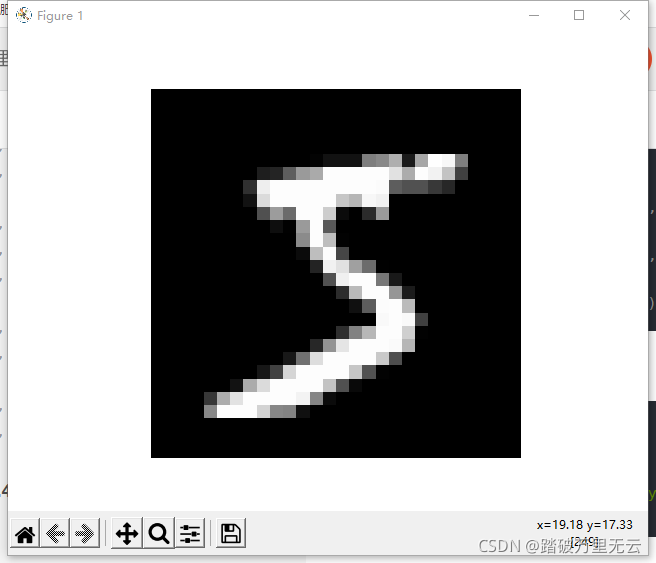
- 这是一个28*28中的数组,数组中的每个元素对应图像的一个像素
- 因为数字的背景为黑色,数字不为零的元素就是手写的笔画的部分
>>> train_x[0]
array([[  0,   0,   0,   0,   0,   0,   0,   0,
0,   0,   0,   0,   0,
          0,   0,   0,   0,   0,   0,   0,   0,
0,   0,   0,   0,   0,
          0,   0],
       [  0,   0,   0,   0,   0,   0,   0,   0,
0,   0,   0,   0,   0,
          0,   0,   0,   0,   0,   0,   0,   0,
0,   0,   0,   0,   0,
          0,   0],
       [  0,   0,   0,   0,   0,   0,   0,   0,
0,   0,   0,   0,   0,
          0,   0,   0,   0,   0,   0,   0,   0,
0,   0,   0,   0,   0,
          0,   0],
       [  0,   0,   0,   0,   0,   0,   0,   0,
0,   0,   0,   0,   0,
          0,   0,   0,   0,   0,   0,   0,   0,
0,   0,   0,   0,   0,
          0,   0],
       [  0,   0,   0,   0,   0,   0,   0,   0,
0,   0,   0,   0,   0,
          0,   0,   0,   0,   0,   0,   0,   0,
0,   0,   0,   0,   0,
          0,   0],
       [  0,   0,   0,   0,   0,   0,   0,   0,
0,   0,   0,   0,   3,
         18,  18,  18, 126, 136, 175,  26, 166, 255, 247, 127,   0,   0,
          0,   0],
       [  0,   0,   0,   0,   0,   0,   0,   0,  30,  36,  94, 154, 170,
        253, 253, 253, 253, 253, 225, 172, 253, 242, 195,  64,   0,   0,
          0,   0],
       [  0,   0,   0,   0,   0,   0,   0,  49, 238, 253, 253, 253, 253,
        253, 253, 253, 253, 251,  93,  82,  82,  56,  39,   0,   0,   0,
          0,   0],
       [  0,   0,   0,   0,   0,   0,   0,  18, 219, 253, 253, 253, 253,
        253, 198, 182, 247, 241,   0,   0,   0,
0,   0,   0,   0,   0,
          0,   0],
       [  0,   0,   0,   0,   0,   0,   0,   0,  80, 156, 107, 253, 253,
        205,  11,   0,  43, 154,   0,   0,   0,
0,   0,   0,   0,   0,
          0,   0],
       [  0,   0,   0,   0,   0,   0,   0,   0,
0,  14,   1, 154, 253,
         90,   0,   0,   0,   0,   0,   0,   0,
0,   0,   0,   0,   0,
          0,   0],
       [  0,   0,   0,   0,   0,   0,   0,   0,
0,   0,   0, 139, 253,
        190,   2,   0,   0,   0,   0,   0,   0,
0,   0,   0,   0,   0,
          0,   0],
       [  0,   0,   0,   0,   0,   0,   0,   0,
0,   0,   0,  11, 190,
        253,  70,   0,   0,   0,   0,   0,   0,
0,   0,   0,   0,   0,
          0,   0],
       [  0,   0,   0,   0,   0,   0,   0,   0,
0,   0,   0,   0,  35,
        241, 225, 160, 108,   1,   0,   0,   0,
0,   0,   0,   0,   0,
          0,   0],
       [  0,   0,   0,   0,   0,   0,   0,   0,
0,   0,   0,   0,   0,
         81, 240, 253, 253, 119,  25,   0,   0,
0,   0,   0,   0,   0,
          0,   0],
       [  0,   0,   0,   0,   0,   0,   0,   0,
0,   0,   0,   0,   0,
          0,  45, 186, 253, 253, 150,  27,   0,
0,   0,   0,   0,   0,
          0,   0],
       [  0,   0,   0,   0,   0,   0,   0,   0,
0,   0,   0,   0,   0,
          0,   0,  16,  93, 252, 253, 187,   0,
0,   0,   0,   0,   0,
          0,   0],
       [  0,   0,   0,   0,   0,   0,   0,   0,
0,   0,   0,   0,   0,
          0,   0,   0,   0, 249, 253, 249,  64,
0,   0,   0,   0,   0,
          0,   0],
       [  0,   0,   0,   0,   0,   0,   0,   0,
0,   0,   0,   0,   0,
          0,  46, 130, 183, 253, 253, 207,   2,
0,   0,   0,   0,   0,
          0,   0],
       [  0,   0,   0,   0,   0,   0,   0,   0,
0,   0,   0,   0,  39,
        148, 229, 253, 253, 253, 250, 182,   0,
0,   0,   0,   0,   0,
          0,   0],
       [  0,   0,   0,   0,   0,   0,   0,   0,
0,   0,  24, 114, 221,
        253, 253, 253, 253, 201,  78,   0,   0,
0,   0,   0,   0,   0,
          0,   0],
       [  0,   0,   0,   0,   0,   0,   0,   0,  23,  66, 213, 253, 253,
        253, 253, 198,  81,   2,   0,   0,   0,
0,   0,   0,   0,   0,
          0,   0],
       [  0,   0,   0,   0,   0,   0,  18, 171, 219, 253, 253, 253, 253,
        195,  80,   9,   0,   0,   0,   0,   0,
0,   0,   0,   0,   0,
          0,   0],
       [  0,   0,   0,   0,  55, 172, 226, 253, 253, 253, 253, 244, 133,
         11,   0,   0,   0,   0,   0,   0,   0,
0,   0,   0,   0,   0,
          0,   0],
       [  0,   0,   0,   0, 136, 253, 253, 253, 212, 135, 132,  16,   0,
          0,   0,   0,   0,   0,   0,   0,   0,
0,   0,   0,   0,   0,
          0,   0],
       [  0,   0,   0,   0,   0,   0,   0,   0,
0,   0,   0,   0,   0,
          0,   0,   0,   0,   0,   0,   0,   0,
0,   0,   0,   0,   0,
          0,   0],
       [  0,   0,   0,   0,   0,   0,   0,   0,
0,   0,   0,   0,   0,
          0,   0,   0,   0,   0,   0,   0,   0,
0,   0,   0,   0,   0,
          0,   0],
       [  0,   0,   0,   0,   0,   0,   0,   0,
0,   0,   0,   0,   0,
          0,   0,   0,   0,   0,   0,   0,   0,
0,   0,   0,   0,   0,
          0,   0]], dtype=uint8)
7.3.2.4.2 显示图片
import tensorflow as tf
import matplotlib.pyplot as plt

mnist = tf.keras.datasets.mnist
(train_x,train_y),(test_x,test_y) = mnist.load_data()

plt.axis("off")
plt.imshow(train_x[0],cmap="gray")
plt.show()
- 下面输出这个图片的标签
>>> train_y[0]
5
7.3.2.4.3 随机显示4幅手写数字图片
import tensorflow as tf
import matplotlib.pyplot as plt
import numpy as np

mnist = tf.keras.datasets.mnist
(train_x,train_y),(test_x,test_y) = mnist.load_data()


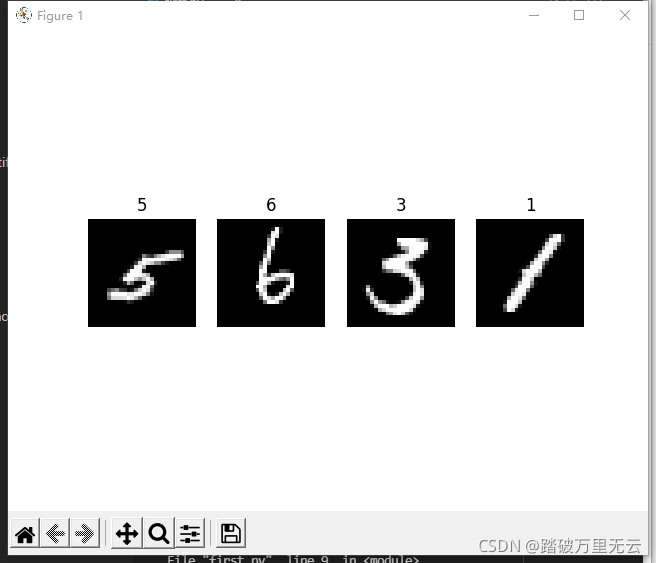
for i in range(4):
	num = np.random.randint(1,60000)

	plt.subplot(1,4,i+1)
	plt.axis("off")
	plt.imshow(train_x[num],cmap="gray")
	plt.title(train_y[num])

plt.show()


