基于CUSUM算法的异常检测(Part 1)
基于CUSUM算法的异常检测(Part 1)
基于文章"The CUSUM Algorithm - a small review Poerre Granjon"的代码复现(待完善)
Algorithm4代码
// An highlighted block
import numpy as np
import matplotlib.pyplot as plt
#Create a synthetic Guassian data set to test
#x = np.concatenate([np.random.rand(1000),
mu0 = 0
mu1 = 1
sigma = 1
delta = 1
n1 = 1000
n = 1300
n2 = n - n1
x = np.concatenate([np.random.normal(mu0, sigma, n1), np.random.normal(mu1, sigma, n2)])
#initialize
h = 100
S = Gx = s = np.zeros(n)
S[0] =s[0] = Gx[0] = x[0] - 0.5

#S[-1] = Gx[-1] = 0
k = 1
nd = 0
nc_estimation = 0
#the cumulative vector of x
xc = np.cumsum(x-0.5,0)# exactly, xc is S, but why they are not the same?
sum_hat =  np.cumsum(x, 0)
#iterate:
s = x - 0.5
mu_hat = np.zeros(n)
mu_hat[0] = x[0]
sigma_hat = np.zeros(n)
for k in range(len(x)):
    mu_hat[k] = sum_hat[k]/(k+1)
    sigma_hat[k] = (k*sigma_hat[k-1]+(x[k]-mu_hat[k])*(x[k]-mu_hat[k]))/[k+1]
    s[k] = (delta/sigma_hat[k])*(x[k]-mu_hat[k]-delta/2)
    S[k] = S[k-1] + s[k]
    Gx[k] = max(Gx[k-1] + s[k], 0)
    '''if Gx[k]<0:
        k = k + 1
        Gx[k-1] = 0
    elif Gx[k] > h:
        k = k + 1
        nd = k
        nc_estimation = np.argmin(xc)'''
    if Gx[k] > h:
        k = k + 1
        nd = k
        nc_estimation = np.argmin(xc)
        #break
    else:
        k = k + 1

'''
print("xc=", xc)
print('s=',s)
print('length(s)=',len(s))

print('Gx=',Gx)
'''
print('S=',S)
print("nd=",nd)
print("nc_estimation=",nc_estimation)
print("k=",k)
print("s=",s)
print("x=",x)
print('Gx=',Gx)

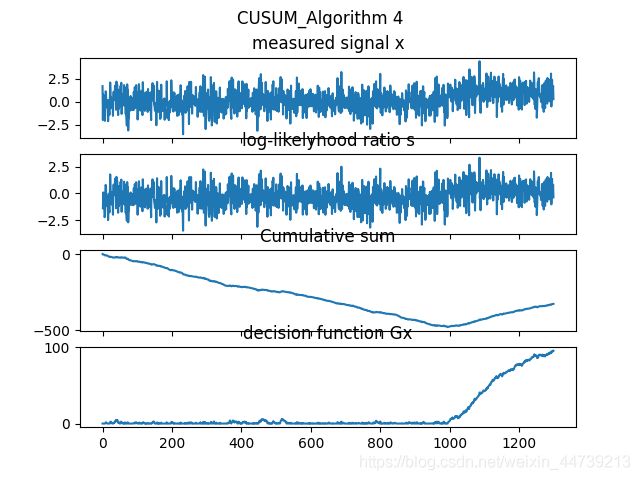
#plot the figure
f, axs = plt.subplots(4,1,sharex='col')
f.subplots_adjust()
axs[0].plot(x)
axs[0].set_title("measured signal x")
axs[1].plot(s)
axs[1].set_title("log-likelyhood ratio s")
axs[2].plot(xc)
axs[2].set_title("Cumulative sum")
axs[3].plot(Gx)
axs[3].set_title("decision function Gx")
plt.suptitle('CUSUM_Algorithm 4')
plt.show()
// An highlighted block
import numpy as np
from numpy import *
#import math
import matplotlib.pyplot as plt
#Create a synthetic Guassian data set to test
#x = np.concatenate([np.random.rand(1000),
mu0 = 0
mu1 = 1
sigma = 1
delta = 1
n1 = 1000
n = 1300
n2 = n - n1
x = np.concatenate([np.random.normal(mu0, sigma, n1), np.random.normal(mu1, sigma, n2)])
#initialize
h = 50
S = Gx = s = np.zeros(n)
#S[0] =s[0] = Gx[0] = x[0] - 0.5
S[-1] = Gx[-1] = 0
nd = 0
nc_estimation = 0
#the cumulative vector of x
#xc = np.cumsum(x-0.5,0)
sum_hat = np.cumsum(x, 0)
#iterate:
n_sub = array(range(1,n+1))
mu_hat = sum_hat/n_sub
sigma_hat = np.dot(x - mu_hat, x - mu_hat)/n_sub

#sigma_hat = np.zeros(n)#sigma_hat[0]=0
for k in range(len(x)):#k begins from 0
    #mu_hat[k] = sum_hat[k]/(k+1)#maximum likelihood estimation
    #sigma_hat[k] = np.dot((x[0:k]- mu_hat[0:k]),(x[0:k] - mu_hat[0:k])) / (k+1)#maximum likelihood estimation
    if sigma_hat[k] == 0:
        sigma_hat[k] = 0.01
    #s[k] = (delta / sigma_hat[k]) * (x[k] - mu_hat[k] - delta / 2)
    #S[k] = S[k - 1] + s[k]
    #Gx[k] = max(Gx[k - 1] + s[k], 0)
s = (delta/sigma_hat) * (x - mu_hat - delta / 2)
S = np.cumsum(s, 0)
nc_estimation = np.argmin(S)
print('nc_estimation=',nc_estimation)
i = 1
while i < len(x)-1:
    nc = np.argmin(S[0:i+1])
    Gx[i] = S[i]- np.min(S[0:nc])
    i = i + 1
for k in range(len(x)):
    if Gx[k] > h:
        nd = i
print('sigma_hat=',sigma_hat,'\ns=',s,'\nS=',S)
print('Gx=', Gx)

print('S=',S)
print("nd=",nd)
print("nc_estimation=",nc_estimation)
print("k=",k)
print("s=",s)
print("x=",x)
print('Gx=',Gx)

#plot the figure
f, axs = plt.subplots(4,1,sharex='col')
f.subplots_adjust()
axs[0].plot(x)
axs[0].set_title("measured signal x")
axs[1].plot(s)
axs[1].set_title("log-likelyhood ratio s")
axs[2].plot(S)
axs[2].set_title("Cumulative sum")
axs[3].plot(Gx)
axs[3].set_title("decision function Gx")
plt.suptitle('CUSUM_Algorithm 4')
plt.show()
