数据分析项目:CDNOW用户消费数据分析(基于MySQL实现)
CDNow网站销售数据分析
- 项目背景
- 分析目的及思路
- 数据处理
-
- 数据导入
- 数据清洗
-
- 1、字段空格处理
- 2、数据类型转换
- 3、缺失数据处理
- 4、数据重复处理
- 5、数据0值
- 数据分析
-
- 产品销售分析
- 产品价格分析
-
- 1、所有订单CD均价
- 2、单品订单CD价格
- 3、高低价CD月销售分析
- 用户行为分析
-
- 用户消费金额分析
-
- 1、全体用户消费金额分析
- 2、个体用户消费金额分析
- 用户消费时间分析
-
- 1、用户首次消费时间
- 2、用户末次消费时间
- 3、用户购物时间间隔
- 4、用户生命周期分析
- 5、用户消费累计金额
- 用户消费价值分析
-
- 1、复购率分析
- 2、回购率分析
- 3、同期群分析
- 4、RFM模型用户分层
项目背景
CDNow曾经是一家在线音乐零售平台,后被德国波泰尔斯曼娱乐集团公司出资收购,其资产总价值在最辉煌时曾超过10亿美元。
分析目的及思路
本次报告主要利用MYSQL和EXCEL对CDNOW网站用户的消费数据进行分析,了解该网站营业情况。
具体分析从产品分析和用户分析展开。
数据处理
数据导入
数据来源:
和鲸社区:https://www.heywhale.com/mw/project/5e67586ef278cf002d533f89/dataset
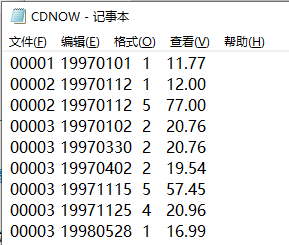
数据展示:
1、CDNow曾经是一家在线音乐零售平台,数据集为CDNow网站的用户在1997年1月1日至1998年6月30日期间内购买CD交易明细;
2、文件大小1.85M,数据格式TXT,原始数据共69659条记录;
3、数据集一共有用户ID,购买日期,订单数,订单金额4个字段,文件中无字段名;我理解的这里的订单数指的是该订单含有的CD张数;金额的单位是美元。
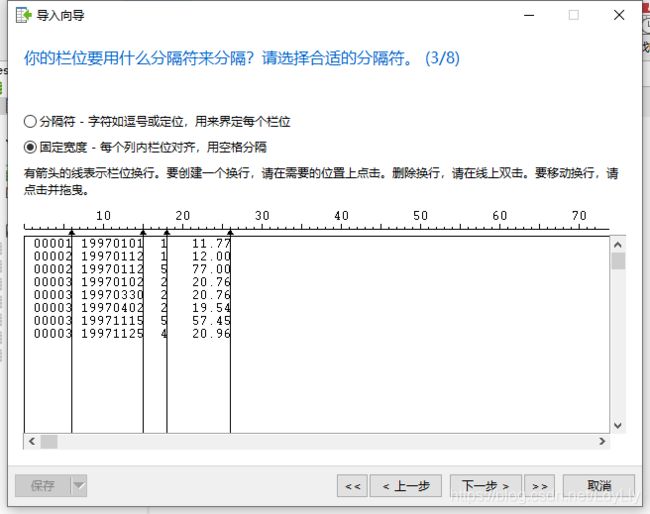
Navicat for MySQL导入数据
数据清洗
1、字段空格处理
用trim函数去除每一字段值中左右两边空格
update cdnow
set user_id =trim(user_id),
    purchase_date=trim(purchase_date),
    order_cdnum=trim(order_cdnum),
    order_amount=trim(order_amount);
2、数据类型转换
在设计表选项中修改数据类型,确保金额数据显示正常,并避免后续数据分析出现错误

3、缺失数据处理
select count(*) from cdnow;
#69659
select count(user_id),count(purchase_date),count(order_cdnum),count(order_amount) from cdnow;
#69659
表中不存在null值,无需处理
4、数据重复处理
看到别人的链接中没有处理重复数值,有的链接表示,重复记录是因为同一个用户一天下单两次。我对这个项目数据的理解是,每一记录都是已完成的订单,不存在取消订单等情况;其中订单数order_cdnum就是中用户购买的CD张数,4个字段都一样的记录是重复记录,所以在这里做了重复数据处理这一步。
#第一步,找是否有所有字段都重复的重复记录,确实存在重复记录
select count(user_id),count(purchase_date),count(order_cdnum),count(order_amount) from cdnow;
#69659
select count(distinct user_id,purchase_date,order_cdnum,order_amount) from cdnow;
#69404

#第二步,加上主键id列,辅助重复值的删除
ALTER table cdnow add column id int(14) primary key auto_increment first;

#第三步,删除重复记录
with t as (
select distinct c1.* FROM cdnow c1 join cdnow c2
on c1.user_id=c2.user_id and c1.purchase_date=c2.purchase_date and c1.order_cdnum=c2.order_cdnum and c1.order_amount=c2.order_amount
and c1.id<> c2.id )

delete from cdnow
where
id in (select id from t)
and
id not in (select min(id) as id_min from t group by t.user_id,t.purchase_date,t.order_cdnum,t.order_amount);

#第四步,用第一步语句检查,并去掉添加的主键id列,这里是考虑到不同引擎可能会导致重新启动时候id列不连续,所以先去掉
alter table cdnow drop column id;
5、数据0值
观察到金额数据存在 0值。
select * from cdnow where order_amount=0 or order_cdnum=0;#80
select * from cdnow where order_amount=0 and order_cdnum=0; #null
select * from cdnow where order_amount=0;#80,存在80条有订单数但无订单金额的记录
select * from cdnow where order_cdnum=0;#=' '和=0是等价的,null
存在80条订单金额为0的数据,但是订单数存在。这些数据可能是优惠活动赠送、限免、优惠券抵扣的订单,或者是数据缺失。无法判断数值意义,先不删除,当作正常数据。
数据预处理后得到69404条数据。
数据分析
产品销售分析
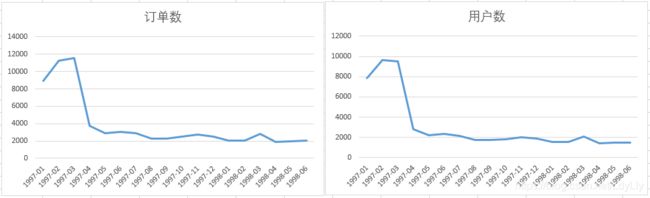
数据集的时间跨度为1997年1月1日至1998年6月30日,可以做季度或月度为单位的销售分析。

以上4个图表说明:
(1)1997年的第一季度,所有指标的数据较高,从1997年4月开始便处于平稳状态,至1998年6月,数据维持在一定水平上下波动;
(2)一般,我们以销售额作为电商零售业务的核心指标。观察CD销售额,发现在1997年3月,1997年7月,1997年11月,1998年3月,销售额相较于相邻前后两月数据,均出现小幅提升。
通过4个图表相互对比发现:
(1)每个月的CD销量和CD销售额变动趋势完全一致;
(2)1997年3月,环比上月用户数下降,但订单数、销量和销售额均提升,说明该月用户有多次购买的行为;
(3)1997年7月,环比上月用户数下降,订单数下降,但销量和销售额均有提升,说明该月订单中有较大额度的订单;
(4)1997年11月和1998年3月,环比上月销量和销售额提升的同时,用户数和订单数都在提升;
(5)后续分析用户价值时可以着重考虑引起1997年3月和1997年7月销量和销售额增长的用户行为规律。
产品价格分析
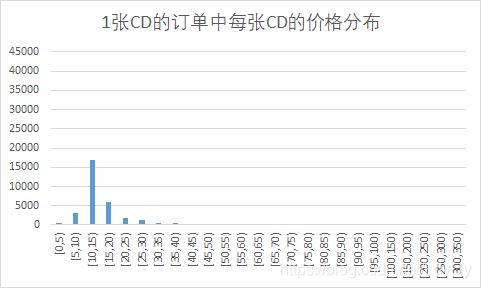
浏览部分数据,发现每张CD的单价大多在10元左右,于是分析网站的产品价格,对网站的产品价格档次进行探索。
1、所有订单CD均价
先考虑所有订单的平均单张CD价格(order_amount/order_cdnum),分布整体右偏,均价在10元到15元之间的产品最多,98.5%的产品分布在0元至40元区间内。大于40元的CD销量在图上几乎看不到。
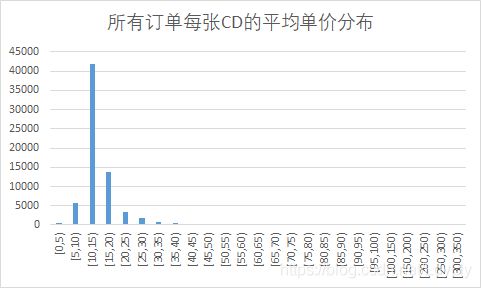
为了避免均值处理的对实际订单情况的统计误差,下面只对仅1张CD的订单,即单品订单进行分析。
2、单品订单CD价格
对于order_cdnum=1的所有订单(31221条,占总体45.0%),各个区间的频数由以下条形图展现,可以看出该网站的CD价格分布整体右偏,单价在10元到15元之间的产品最多,97.3%的产品分布在0元至40元区间内。由于CD数为1的订单数量较大,CD数为1的订单与整体订单结论类似。大于40元的CD销量在图上几乎看不到。
初次了解情况时将价格细分较细,也可以将分组间隔取大。
select sum(case when a.cd_price>=0  and a.cd_price <5  then 1 end) as num_5,
	   sum(case when a.cd_price>=5  and a.cd_price <10 then 1 end) as num_10,
	   sum(case when a.cd_price>=10 and a.cd_price <15 then 1 end) as num_15,
	   sum(case when a.cd_price>=15 and a.cd_price <20 then 1 end) as num_20,
	   sum(case when a.cd_price>=20 and a.cd_price <25 then 1 end) as num_25,
	   sum(case when a.cd_price>=25 and a.cd_price <30 then 1 end) as num_30,
	   sum(case when a.cd_price>=30 and a.cd_price <35 then 1 end) as num_35,
	   sum(case when a.cd_price>=35 and a.cd_price <40 then 1 end) as num_40,
	   sum(case when a.cd_price>=40 and a.cd_price <45 then 1 end) as num_45,
	   sum(case when a.cd_price>=45 and a.cd_price <50 then 1 end) as num_50,
	   sum(case when a.cd_price>=50 and a.cd_price <55 then 1 end) as num_55,
	   sum(case when a.cd_price>=55 and a.cd_price <60 then 1 end) as num_60,
	   sum(case when a.cd_price>=60 and a.cd_price <65 then 1 end) as num_65,
	   sum(case when a.cd_price>=65 and a.cd_price <70 then 1 end) as num_70,
	   sum(case when a.cd_price>=70 and a.cd_price <75 then 1 end) as num_75,
	   sum(case when a.cd_price>=75 and a.cd_price <80 then 1 end) as num_80,
	   sum(case when a.cd_price>=80 and a.cd_price <85 then 1 end) as num_85,
	   sum(case when a.cd_price>=85 and a.cd_price <90 then 1 end) as num_90,
	   sum(case when a.cd_price>=90 and a.cd_price <95 then 1 end) as num_95,
	   sum(case when a.cd_price>=95 and a.cd_price <100 then 1 end) as num_100,
	   sum(case when a.cd_price>=100 and a.cd_price <150 then 1 end) as num_150,
	   sum(case when a.cd_price>=150 and a.cd_price <200 then 1 end) as num_200,
	   sum(case when a.cd_price>=200 and a.cd_price <250 then 1 end) as num_250,
	   sum(case when a.cd_price>=250 and a.cd_price <300 then 1 end) as num_300,
	   sum(case when a.cd_price>=300 and a.cd_price <350 then 1 end) as num_350
from
	(select user_id, purchase_date, order_amount, order_cdnum,
	 		order_amount/order_cdnum as cd_price
	 from cdnow) a;
3、高低价CD月销售分析
将小于40元的CD称为低价CD,大于40元的称为高价CD。两种类型的CD的购买时间分布在这18个月中,两种CD每月的销售情况如下:
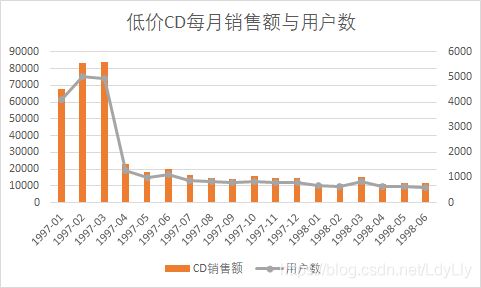
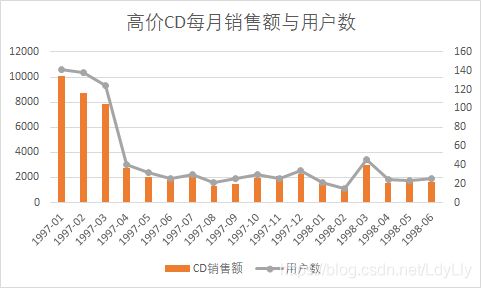
由上面2图可见:
(1)1998年3月,两种CD的销售额均有一定幅度提高,低价CD在1998年3月的销售额环比2月提高了36.2%,高价CD在3月的销售额环比2月提高了198.1%;
(2)该月高低价CD的均价环比上月波动小,不超出1$,所以销售额提升与促销活动关系无关;
(3)下单用户数波动明显,低价CD在3月的下单用户数环比2月提高了27.0%,高价CD在3月的下单用户数环比2月提高了206.7%;
综上可见,1998年3月,高价CD的销售情况较好,可能是有了两种类型的CD都有了新的产品,或者是采用了有效的增长策略。
#CD数=1的便宜CD
select date_format(purchase_date,'%Y-%m') ,count(*),
	   count(distinct user_id),sum(order_amount) ,sum(order_amount)/count(*)
from cdnow
where order_cdnum=1 and order_amount<40
group by date_format(purchase_date,'%Y-%m')
order by date_format(purchase_date,'%Y-%m');

#CD数=1的贵CD
select date_format(purchase_date,'%Y-%m') ,count(*),
	   count(distinct user_id),sum(order_amount) ,sum(order_amount)/count(*)
from cdnow
where order_cdnum=1 and order_amount>=40
group by date_format(purchase_date,'%Y-%m')
order by date_format(purchase_date,'%Y-%m');
显然销售额与用户数呈现正相关。进一步分析用户行为,制定用户增长策略,才能够实现产品销售额的提升。
用户行为分析
本部分是分析重点,绝大多数链接针对用户行为展开。
用户消费金额分析
1、全体用户消费金额分析
对全部用户计算每月用户平均消费金额 和 每月用户平均消费次数。
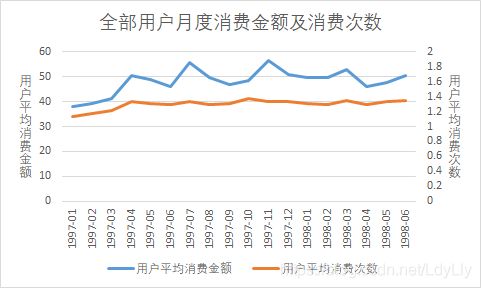
由上图看出:
(1)对比消费金额和订单数量在1997年第一季度的高位后陡然下降,人均消费金额和人均订单量的图形走势在1997年第一季度中逐渐提高然后二季度开始后趋于平稳;
(2)经过1997年第一季度的增长,后续15个月的人均消费金额在50元上下波动,人均消费次数在1.4次上下波动;
(3)1997年第一季度后的15个月,每个月用户总体的平均消费次数和平均消费金额都比较稳定,结合前面销售总额的数值的平稳,可以判断网站CD售卖业务稳定发展。
下面的用户行为分析可以划分为两个阶段(1997年1月至3月、1997年4月至1998年6月)进行。
select date_format(purchase_date,'%Y-%m') ,
	   round(sum(order_amount)/count(distinct user_id),2),
	   round(count(*)/count(distinct user_id),2)
from cdnow
group by date_format(purchase_date,'%Y-%m')
order by date_format(purchase_date,'%Y-%m');
2、个体用户消费金额分析
A. 用户消费额、CD购买量的描述性统计
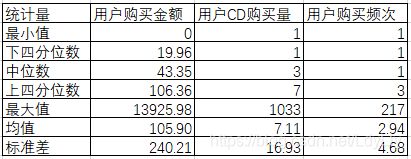
根据上表,可以对所有时段所有用户的消费金额及购买量有初步的认知:
(1)用户平均购买了7张CD,而CD购买量的中位数为3,说明小部分用户购买了大量的CD,导致右偏;
(2)用户平均消费105.90元,中位值为43.35元,说明小部分用户购买金额较大,低消费人群占多数;
(3)用户平均消费频次为3.94,中位值为3,大多用户消费频次低。
#最大值、最小值、均值、标准差
select max(jine),min(jine),avg(jine),stddev(jine),
	   max(goumai),min(goumai),avg(goumai),stddev(goumai)
from (
		select user_id,sum(order_amount) jine,sum(order_cdnum) goumai
	    from cdnow
		group by user_id) a;
上下四分位数百度百科-四分位数
这里给出销售额的上下四分位数计算,按照公式(n+1)/4和3(n+1)/4确定位置,按照距离远近计算四分位数的数值。
#销售额 的下四分位数Q1
select if(num1=num2,jine1,
		  if(xsd1<0.5,jine1*xsd1+jine2*(1-xsd1),jine1*(1-xsd1)+jine2*xsd1)) as q1
from(
	select b.num1,min(t.jine) as jine1,b.num2,max(t.jine) as jine2,b.xsd1
	from
		(select jine,row_number() over(order by jine) rk
		 from (select user_id,sum(order_amount) jine from cdnow group by user_id)s) t,
		(select floor((count(user_id)+1)/4) num1,ceil((count(user_id)+1)/4) num2,
				right(round((count(user_id)+1)/4,2),2)/100 xsd1
		 from (select distinct user_id from cdnow) a) b
where t.rk=b.num1 or t.rk=b.num2 ) c;
#销售额 的上四分位数Q3
select if(num3=num4,jine3,
		  if(xsd2<0.5,jine3*xsd2+jine4*(1-xsd2),jine3*(1-xsd2)+jine4*xsd2)) as q3
from(
	select b.num3,min(t.jine) as jine3,b.num4,max(t.jine) as jine4,b.xsd2
	from
		(select jine,row_number() over(order by jine) rk
		 from (select user_id,sum(order_amount) jine from cdnow group by user_id)s) t,
		(select floor((count(user_id)+1)/4*3) num3,ceil((count(user_id)+1)/4*3) num4,
		        right(round((count(user_id)+1)/4*3,2),2)/100 xsd2
		 from (select distinct user_id from cdnow) a) b
where t.rk=b.num3 or t.rk=b.num4) c;
B. 用户消费金额和产品购买量的分布
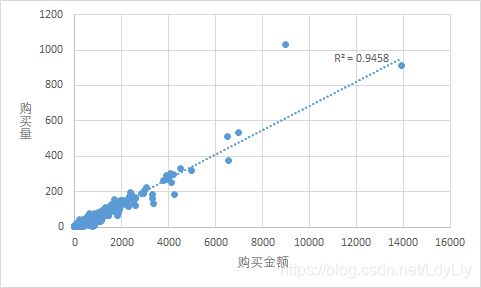
上图为每一用户购买金额与CD购买量的分布关系,即使包含离群值,数据点分布规律依旧具有较强的线性相关性,并且离群值较少。表明该网站CD产品的价格比较单一,回归线斜率反应了产品平均单价。
select user_id,sum(order_amount),sum(order_cdnum)
from cdnow
group by user_id
order by user_id;
C. 用户消费金额分布
根据前面的分析结果,大量用户的消费金额较小,所以,以50元作为区间间隔,研究用户消费金额的分布。
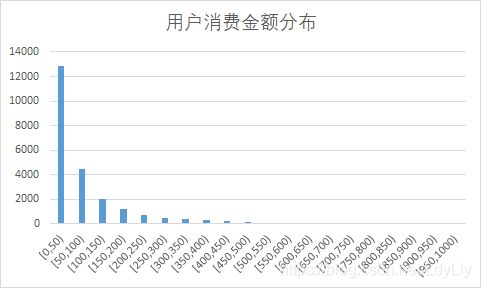
以购物总金额小于1000元的用户为研究,可以看出:
(1)99.2%的用户消费金额在1000元以下,54.5%的用户消费金额不超过50元,73.6%的用户消费金额小于100元;
(2)消费大于500元的用户数在图中几乎看不到,虽然有极端高消费的用户,但大多数用户消费处于较低档次,也比较符合消费行业规律。
#又来case when,jine
select sum(case when jine>=0 and jine<50 then 1 end) as num_50,
			 sum(case when jine>=50 and jine<100 then 1 end) as num_100,
			 sum(case when jine>=100 and jine<150 then 1 end) as num_150,
			 sum(case when jine>=150 and jine<200 then 1 end) as num_200,
			 sum(case when jine>=200 and jine<250 then 1 end) as num_250,
			 sum(case when jine>=250 and jine<300 then 1 end) as num_300,
			 sum(case when jine>=300 and jine<350 then 1 end) as num_350,
			 sum(case when jine>=350 and jine<400 then 1 end) as num_400,
			 sum(case when jine>=400 and jine<450 then 1 end) as num_450,
			 sum(case when jine>=450 and jine<500 then 1 end) as num_500,
			 sum(case when jine>=500 and jine<550 then 1 end) as num_550,
			 sum(case when jine>=550 and jine<600 then 1 end) as num_600,
			 sum(case when jine>=600 and jine<650 then 1 end) as num_650,
			 sum(case when jine>=650 and jine<700 then 1 end) as num_700,
			 sum(case when jine>=700 and jine<750 then 1 end) as num_750,
			 sum(case when jine>=750 and jine<800 then 1 end) as num_800,
			 sum(case when jine>=800 and jine<850 then 1 end) as num_850,
			 sum(case when jine>=850 and jine<900 then 1 end) as num_900,
			 sum(case when jine>=900 and jine<950 then 1 end) as num_950,
			 sum(case when jine>=950 and jine<1000 then 1 end) as num_1000,
			 sum(case when jine>=1000 and jine<1050 then 1 end) as num_1050,
			 sum(case when jine>=1050 and jine<1100 then 1 end) as num_1100,
			 sum(case when jine>=1100 and jine<1150 then 1 end) as num_1150,
			 sum(case when jine>=1150 and jine<1200 then 1 end) as num_1200,
			 sum(case when jine>=1200 and jine<1250 then 1 end) as num_1250,
			 sum(case when jine>=1250 and jine<1300 then 1 end) as num_1300,
			 sum(case when jine>=1300 and jine<1350 then 1 end) as num_1350
from (select sum(order_amount) jine from cdnow
	  where date_format(purchase_date,'%Y-%m') not in ('1997-01','1997-02','1997-03')
	  group by user_id order by jine desc) a;
D. 用户购买量分布
以5张CD为间隔,分析不同购买数量的用户分布。
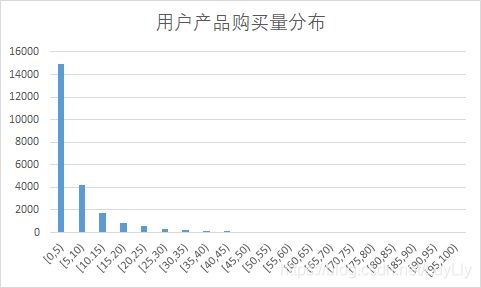
以购物数量小于100张的用户为研究,可以看出:
99.7%的用户消费金额在100张以下,63.2%的用户购买量不超过5张。
E. 用户购买频次分布
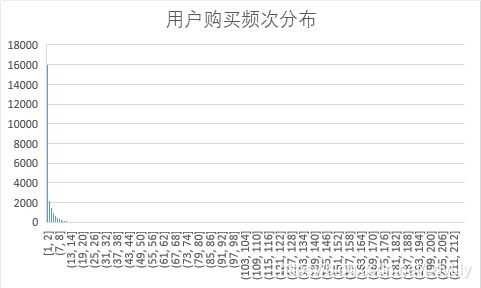
以全部用户的消费频次为研究,可以看出:
50.6%的用户消费频次为1,77.2%的用户消费频次不超过3次。
用户消费时间分析
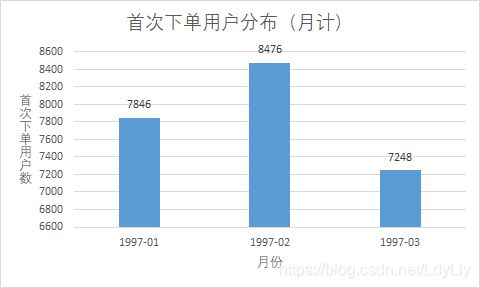
1、用户首次消费时间
首先按月得到首次消费用户分布
按周统计,以周日为每周第一天,跨年周采用第0周表示,第0周有4天,第12周有2天。
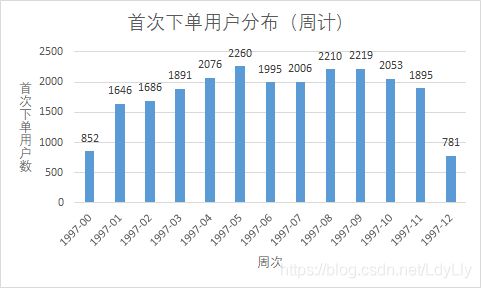
观察两图,可得出结论:
(1)用户首次下单时间分布集中在1997年的1月至3月,后续15个月再无新用户;
(2)由于第0周和第12周天数不足,考虑第1周至第11周期间,用户首次下单在第5周达到巅峰,第6和7周略有下降,结合网站实际运营情况,可以找出影响新用户购买行为的因素。
#首次购买时间分布,按月划分
select date_format(shou,'%Y-%m'),count(user_id)
from(
select user_id, min(purchase_date) shou
from cdnow
group by user_id) a
group by date_format(shou,'%Y-%m')
order by date_format(shou,'%Y-%m');
#首次购买时间分布,按周划分
select date_format(shou,'%Y-%U'),count(user_id)
from(
select user_id, min(purchase_date) shou
from cdnow
group by user_id) a
group by date_format(shou,'%Y-%U')
order by date_format(shou,'%Y-%U');
2、用户末次消费时间

用户最后一次购买比第一次购买分布广,大部分最后一次购买集中在前三月,说明很多用户只购买了一次就不再进行购买,随着时间推移,最后一次购买数也在递增。
由上图可知:
(1)在数据集时段内,末次下单用户分布于每个月,57.6%的用户最后一次购买于前三个月,表明,这些这些用户逐渐流失;
(2)在1997年4月,用户数出现断崖式下跌,与产品销售分析中CD销量和销售金额在4月断崖式下跌的情况吻合;
(3)在1998年3月后,最后一次购买的用户数量显著有增加,可能是因为用户复购,导致购买人数增加,应继续分析用户购买时间间隔、复购率等。
#末次购买时间分布,按月划分
select date_format(mo,'%Y-%m'),count(user_id)
from(
select user_id, max(purchase_date) mo
from cdnow
group by user_id) a
group by date_format(mo,'%Y-%m')
order by date_format(mo,'%Y-%m');
3、用户购物时间间隔
用户两次购物时间间隔分析如下。
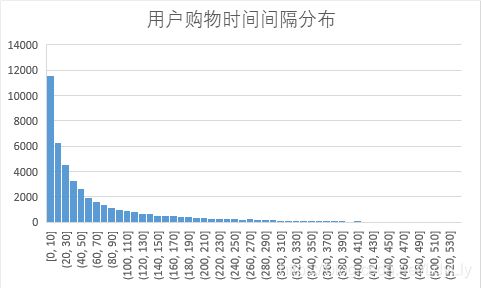
由图表可知,
(1)大部分用户的两次下单行为时间间隔较短,整体分布呈长尾分布;
(2)两次购买时间间隔较长的用户可能反应了用户召回策略的作用。
select user_id,
	   purchase_date date1,
	   lead(purchase_date,1) over(partition by user_id order by purchase_date) date2,
	   datediff(lead(purchase_date) over(partition by user_id order by purchase_date),
	   			purchase_date) as jiange
from cdnow;
4、用户生命周期分析
用户生命周期是指一个用户从第一次购买产品,到最后一次购买产品之间的周期。这里可以分析一年半内的生命周期。
根据每一用户的首末次下单时间间隔,得出用户生命周期分布。
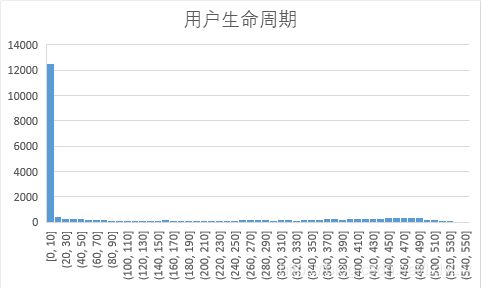
首末次下单时间间隔为0的用户(有的用户一天内下两次单,也删除掉了,这里是指购买行为仅发生了一天的用户)占据全部用户的51.1%,考虑去除这些用户继续分析。

分析用户生命周期,可知:
(1)所有用户中首末次购物时间间隔最大为544天(数据集时间跨度为545天),最小时间间隔为0天,平均时间间隔为134天;
(2)51.1%的用户首末次购物时间间隔为0天,表示首次购买后再无购买行为,直方图分布受到这些用户的影响分布较极端;
(3)排除时间间隔为0天的用户,剩余用户的生命周期分布呈现两端高中间低,两个峰值位于20天内和450至500天;可以对不同用户采取个性化的营销活动。
#基于该语句查询
select user_id,
	   min(purchase_date) '首次购买时间',
	   max(purchase_date) '末次购买时间',
	   datediff(max(purchase_date),min(purchase_date)) '购买时间间隔'
from cdnow
group by user_id
having '首次购买时间' <> '末次购买时间'
order by  '购买时间间隔' desc;
5、用户消费累计金额
借鉴零售行业的目标完成情况分析法,计算每个用户累计消费金额和用户生命周期,分析不同用户达到不同累计金额百分比的目标时的时间进度。这里目标是指每个用户的消费总金额,时间进度是已过的天数占所有天数,即用户生命周期的比例。例如,某个商店6月销售目标为1000元,到了6月13日,本月已过13天,销售了100元,时间进度为13/30=43%,目标完成率为100/1000=10%,进度滞后。
通过该分析可以发现 用户消费金额增长的情况,而比率指标的使用能更准确地反应用户行为。
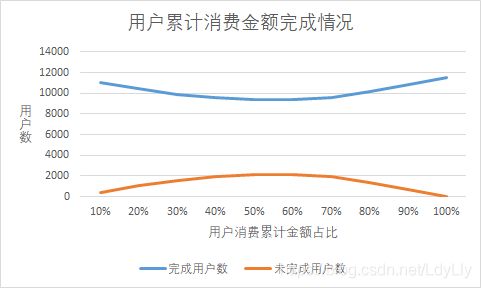
去除了只购买一次的用户,据上图表可见:
(1)完成用户数表示 目标完成率大于时间进度的用户总数,在累计消费金额占比从10%到100%的过程中,在每个比例时(纵向),完成用户数大于未完成用户数,说明大部分用户在该网站的消费是多次适量的购买,而不是在整个生命周期内先买较多后买较少;
(2)观察从10%到100%的变化(横向),完成用户数曲线在50%的总金额时达到最低点,曲线先下降后上升,说明用户购买行为在生命周期内不完全均匀,曲线先下降,表示有相当一部分用户买了之后一段时间不买了,然后又回来买,买的比之前稍微多了。这说明这部分用户不论用户生命周期长短和总消费金额大小,都是先购买一部分,体验了一段时间后来买更多。根据这样的购买行为,推测这部分用户是在逐渐构建对该网站的信任的过程。
#=1的大多是购买1次的用户,也有2次以上的,去掉只购买1次的用户
#这个运行慢,建个表,不建也行
create table jindu(
			 user_id varchar(255),first_date date, dabiao_date date,last_date date,
			 duojiu decimal(10,0),life_time decimal(10,0), jincheng decimal(10,2),
			 dabiao_amount decimal(10,2), amount decimal(10,2),ratio decimal(10,2))
select user_id,first_date,min(purchase_date) dabiao_date,last_date,
		 datediff(min(purchase_date),first_date) duojiu,
		 datediff(last_date,first_date) life_time,
		 round(datediff(min(purchase_date),first_date)/datediff(last_date,first_date),2) jincheng,
		 min(lj_amount) dabiao_amount,amount, min(round(lj_amount/amount,2)) ratio
from(
	select user_id,
	first_value(purchase_date) over(partition by user_id) first_date,purchase_date,
	last_value(purchase_date) over(partition by user_id) last_date,
	order_amount,
	sum(order_amount) over(partition by user_id order by purchase_date
			rows between unbounded preceding and current row) as lj_amount,
	sum(order_amount) over(partition by user_id order by purchase_date
			rows between unbounded preceding and unbounded following) amount
	from cdnow) a
where round(lj_amount/amount,2)>=1
	  and user_id not in (select user_id from cdnow group by user_id having count(1)=1)
group by user_id;

#分析达标情况
select count(1) from jindu where jincheng<= ratio;
select count(1) from jindu where jincheng > ratio;
用户消费价值分析
1、复购率分析
复购率 每月 有复购行为的用户数 / 该月有购买行为的用户数

由上图可知:
(1)前3个月复购率较低,根据前面分析可知,前三个月有大量用户下单一次后再无购买行为,所以复购率较低;
(2)后续15个月的复购率则稳定在20%左右。
select a.ym,count(a.user_id),b.total,count(a.user_id)/b.total as fugoulv
from (
	select user_id,date_format(purchase_date,'%Y-%m') ym,
		   count(purchase_date) goumaicishu
	from cdnow
	group by user_id,date_format(purchase_date,'%Y-%m')
	having count(purchase_date) >1
	order by user_id
	) a,
	(
	select date_format(purchase_date,'%Y-%m') ym, count(distinct user_id) total
	from cdnow group by date_format(purchase_date,'%Y-%m')) b
where a.ym=b.ym
group by a.ym
order by a.ym;
2、回购率分析
回购率 本月已购用户下月购买用户数 / 本月购买用户数
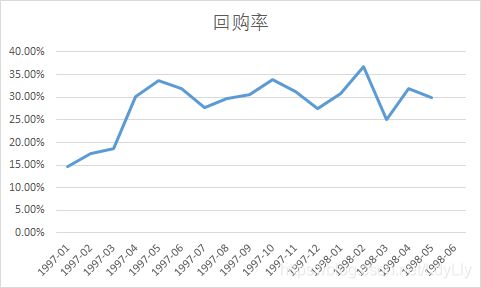
由上图可知:
(1)前3个月因为有大量新用户涌入,而这批用户只购买了一次,所以导致回购率较低;(2)回购率体现了用户在相邻两个月的购物行为的关系,在后续15个月中,前一个月购买的用户大约有30%左右会在本月购买。考虑到CD产品的消费属性和行业情况,可以进一步实现对30%回购率的合理性进行判断。
select b.ym,count(a.ym),count(b.ym),count(a.ym)/count(b.ym) as huigoulv
from
	(select distinct date_format(purchase_date,'%Y-%m-01') ym,user_id from cdnow ) b
left join
	(select distinct date_format(purchase_date,'%Y-%m-01') ym,user_id from cdnow ) a
on timestampdiff(month,b.ym,a.ym)=1 and a.user_id=b.user_id
group by b.ym
order by b.ym;
3、同期群分析
利用群组分析法,分析用户留存率。这里留存行为定义为下单行为。根据前面分析,首次下单用户集中在1997年1月至3月的3个月中,分析每个月新用户在后续月份中的留存用户数和留存率。
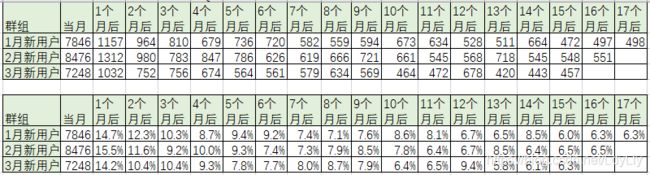
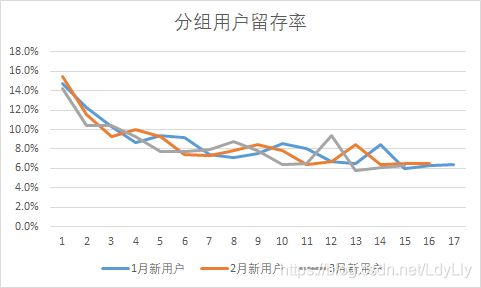
由上图表可见:
新用户1个月后仅留下15%左右,1至3月份的用户留存率随着时间逐渐降低,最后都在6.0%左右波动,推测每个月的新用户并无差异,期间采用的营销策略效果差异不大。
#3月新用户的留存,1和2月稍微改下
select a.ym,count(a.ym),count(b.ym)
from
(select distinct date_format(purchase_date,'%Y-%m-01') ym,user_id
		from cdnow
		where date_format(purchase_date,'%Y-%m')='1997-03'
		and user_id not in
			(select user_id from cdnow where date_format(purchase_date,'%Y-%m') ='1997-01')
		and user_id not in
		    (select user_id from cdnow where date_format(purchase_date,'%Y-%m') ='1997-02'))b
left join
(select distinct date_format(purchase_date,'%Y-%m-01') ym,user_id from cdnow) a
on timestampdiff(month,b.ym,a.ym)=16 and a.user_id=b.user_id
group by b.ym
order by b.ym;
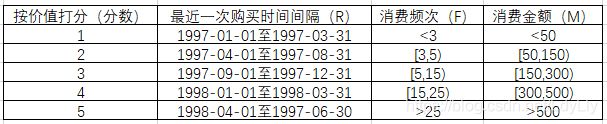
4、RFM模型用户分层
首先制定指标打分规则。
近度R,根据前面 末次下单用户月份分布 制定
频度F,根据前面消费次数的描述统计量及图形分布 制定
金额 M,根据前面消费金额的描述统计量及图形分布 制定
得到指标打分规则如下表所示:
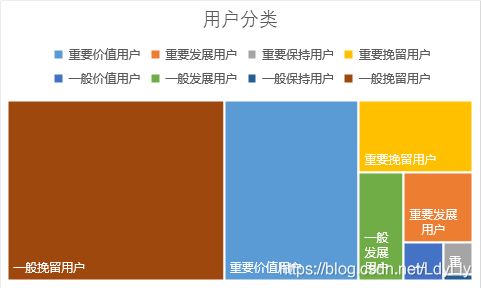
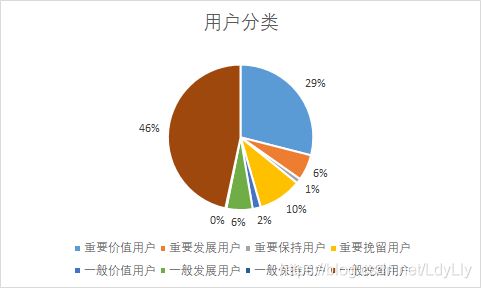
得到各个用户类型的情况如下:
select user_id,R值,F值,M值,(case when R值=1 and F值=1 and M值=1 then '重要价值用户'
				  	             when R值=1 and F值=0 and M值=1 then '重要发展用户'
								 when R值=0 and F值=1 and M值=1 then '重要保持用户'
								 when R值=0 and F值=0 and M值=1 then '重要挽留用户'
								 when R值=1 and F值=1 and M值=0 then '一般价值用户'
								 when R值=1 and F值=0 and M值=0 then '一般发展用户'
								 when R值=0 and F值=1 and M值=0 then '一般保持用户'
								 else '一般挽留用户' end) '用户分类'
from(
	select user_id,if(R_score>R_avg,1,0)as 'R值',if(F_score>F_avg,1,0)as 'F值',
	if(M_score>M_avg,1,0)as 'M值'
	from(
		select user_id,R_score,round(avg(R_score) over(order by user_id),2) R_avg,
					   F_score,round(avg(R_score) over(order by user_id),2) f_avg,
					   M_score,round(avg(R_score) over(order by user_id),2) M_avg
		from(
			select user_id,R,(case when R>=456 then 1
						           when R>=303 and R<456 then 2
								   when R>=181 and R<303 then 3
								   when R>=91 and R<181 then 4 else 5 end) R_score,
						   F, (case when F<3 then 1
						            when F>=3 and F<5 then 2
									when F>=5 and F<15 then 3
									when F>=15 and F<25 then 4 else 5 end) F_score,
						   M,(case when M<50 then 1
						           when M>=50 and M<150 then 2
								   when M>=150 and M<300 then 3
								   when M>=300 and M<500 then 4 else 5 end) M_score
			from(
					select user_id,datediff('1998-06-30',max(purchase_date)) R,
							count(*) F,sum(order_amount) M
					from cdnow
					group by user_id
					order by user_id) a) b)c)d;
结论:
1、 产品销售情况:根据用户整体的每月消费趋势来看,订单数、用户数、CD销量以及CD销售额在1997年的第一季度处于巅峰时期,对比随后15个月数据极大,可能是与网站的营销活动有关,或者是这段时间有较新颖、有吸引力的CD产品。
2、 产品价格情况:单张CD价格分布整体右偏,均价在10元到15元之间的产品最多,98.5%的产品分布在0元至40元区间内。将小于40元的CD称为低价CD,大于40元的称为高价CD。1998年3月,两种CD的销售额均有一定幅度提高,CD单价波动小,与促销活动无关,可能是有了两种类型的CD都有了新的产品,或者是采用了有效的营销策略。
3、 用户消费金额:全部用户每月用户平均消费金额和 每月用户平均消费次数趋于平稳,可以判断网站CD售卖业务稳定发展。大部分用户的消费金额、购买次数和购买量都集中在低区间,呈现长尾分布,应当继续分析产品特性和竞品信息,结合社会、科技及经济背景制定恰当的增长策略。
4、 从用户的消费周期来看:有多次消费的用户生命周期大多分布在20天内与450至500天间,应该对生命周期在20天内的用户进行用户回访,找出用户不再消费的原因,对应采取措施激活用户;在450至500天的用户,应当结合消费次数和消费金额继续分析,可以采用会员制度、用户奖励等措施引导其持续消费,使得用户更忠诚。
5、 从复购率和回购率来看:用户的复购率稳定在20%左右,回购率稳定在30%左右,需要对比行业水平和网站销售目标对复购率和回购率的高低进行判断。
6、 从同期群的留存率来看:前三个月每个月有消费的用户的次月留存大约为15%,流失85%的用户,此后留存率会逐渐下降稳定在6%左右,假设1-3月都是新用户,则应该从网页设计、CD产品、营销活动等角度优化网站的新用户体验。
7、 从用户分层来看:一般挽留用户占比46%,重要价值用户29%,根据用户分层结果,应对不同层级的用户制定不同的运营维护方案,例如唤回流失用户、维护重要价值用户的忠诚度等。