干货:用Python玩转数据可视化,炫酷图表是这样做出来的
导读:相比于科学,数据分析更像是一门艺术。创建样式优美的数据可视化是这个艺术中不可缺少的部分。然而,某些人认为优美的,也会有人觉得难以接受。和艺术类似,随着数据分析的快速演变,人们的观念和品味也一直在变化。但是总的来说没有人是绝对正确和错误的。
作为一个数据艺术家以及有经验的Python程序员,我们可以从matplotlib、Seaborn、Bokeh和ggplot这些库里面选择一些来使用。
作者:伊凡·伊德里斯(Ivan Idris)
如需转载请联系华章科技
01 图形化安斯库姆四重奏
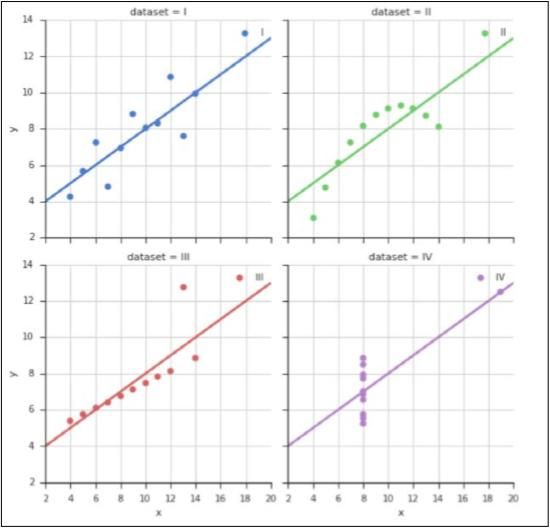
安斯库姆四重奏(Anscombe's Quartet)是一个经典案例,它可以说明为什么可视化是很重要的。四重奏包含了四组统计特性一致的数据。每个数据集有一些x值以及相对应的y值,我们将在一个IPython Notebook中列出这些指标。如果你绘制出这些数据集,你将发现这些图表截然不同。
- 操作步骤
在本节你需要执行如下操作:
(1)由如下导入开始:
import pandas as pd
import seaborn as sns
import matplotlib.pyplot as plt
import matplotlib as mpl
from dautil import report
from dautil import plotting
import numpy as np
from tabulate import tabulate
(2)定义以下函数来计算某一数据集中x和y的均值和方差、相关系数,以及斜率和每个数据集的线性拟合的截距:
def aggregate():
 df = sns.load_dataset("anscombe")
 agg = df.groupby('dataset')
 .agg([np.mean, np.var])
 .transpose()
 groups = df.groupby('dataset')
 corr = [g.corr()['x'][1] for _, g in groups]
 builder = report.DFBuilder(agg.columns)
 builder.row(corr)
 fits = [np.polyfit(g['x'], g['y'], 1) for _, g in groups]
 builder.row([f[0] for f in fits])
 builder.row([f[1] for f in fits])
 bottom = builder.build(['corr', 'slope', 'intercept'])
 return df, pd.concat((agg, bottom))
(3)下面这个函数返回一个字符串,这个字符串有一部分是Markdown,有一部分是重组的文字,有一部分是HTML,这主要是因为原生的Markdown不支持图表:
def generate(table):
 writer = report.RSTWriter()
 writer.h1('Anscombe Statistics')
 writer.add(tabulate(table, tablefmt='html', floatfmt='.3f'))
 return writer.rst
(4)绘制数据并相应地与Seaborn的lmplot()函数线性拟合:
def plot(df):
 sns.set(style="ticks")
 g = sns.lmplot(x="x", y="y", col="dataset",
 hue="dataset", data=df,
 col_wrap=2, ci=None, palette="muted", size=4,
 scatter_kws={"s": 50, "alpha": 1})
 plotting.embellish(g.fig.axes)
(5)展示一个统计数据的表格如下:
df, table = aggregate()
from IPython.display import display_markdown
display_markdown(generate(table), raw=True)
下表中显示每个数据集的几乎相同的统计数据(我修改了IPython配置文件里的 custom.css,所以下表是有颜色的):
(6)以下几行代码绘制了数据集:
%matplotlib inline
plot(df)
请参见以下截图了解最终结果:
02 选择Seaborn的调色板
Seaborn的调色板和matplotlib的颜色表类似。色彩可以帮助你发现数据中的模式,也是重要的可视化组成部分。Seaborn有很丰富的调色板,在这个示例中会将其可视化。
- 操作步骤
(1)导入部分如下:
import seaborn as sns
import matplotlib.pyplot as plt
import matplotlib as mpl
import numpy as np
from dautil import plotting
(2)使用以下函数帮助绘制调色板:
def plot_palette(ax, plotter, pal, i, label, ncol=1):
 n = len(pal)
 x = np.linspace(0.0, 1.0, n)
 y = np.arange(n) + i*n
 ax.scatter(x, y, c=x,
 cmap=mpl.colors.ListedColormap(list(pal)),
 s=200)
 plotter.plot(x,y,label=label)
 handles, labels = ax.get_legend_handles_labels()
 ax.legend(loc='best', ncol=ncol, fontsize=18)
(3)分类调色板(categorical palette)对于分类数据很有用,例如性别、血型等。以下函数可以绘制一些Seaborn的分类调色板:
def plot_categorical_palettes(ax):
 palettes = ['deep', 'muted', 'pastel', 'bright', 'dark','colorblind']
 plotter = plotting.CyclePlotter(ax)
 ax.set_title('Categorical Palettes')
 for i, p in enumerate(palettes):
 pal = sns.color_palette(p)
 plot_palette(ax, plotter, pal, i, p, 4)
(4)圆形色彩系统(circular color system)通常用HLS(色度亮度饱和度,Hue Lightness Saturation)来取代RGB(红绿蓝Red Gree Blue)颜色空间。如果你有很多分类这将会很有用。以下函数可以使用HLS系统绘制调色板。
def plot_circular_palettes(ax):
 ax.set_title('Circular Palettes')
 plotter = plotting.CyclePlotter(ax)
 pal = sns.color_palette("hls", 6)
 plot_palette(ax, plotter, pal, 0, 'hls')
 sns.hls_palette(6, l=.3, s=.8)
 plot_palette(ax, plotter, pal, 1, 'hls l=.3 s=.8')
 pal = sns.color_palette("husl", 6)
 plot_palette(ax, plotter, pal, 2, 'husl')
 sns.husl_palette(6, l=.3, s=.8)
 plot_palette(ax, plotter, pal, 3, 'husl l=.3 s=.8')
(5)Seaborn也有基于在线的ColorBrewer工具的调色板(http://colorbrewer2.org/)。用以下函数绘制出来:
def plot_brewer_palettes(ax):
 ax.set_title('Brewer Palettes')
 plotter = plotting.CyclePlotter(ax)
 pal = sns.color_palette("Paired")
 plot_palette(ax, plotter, pal, 0, 'Paired')
 pal = sns.color_palette("Set2", 6)
 plot_palette(ax, plotter, pal, 1, 'Set2')
(6)连续调色板(sequential palettes)对于数据范围很广的数据来说很有用,比如说有数量级差异的数据。用以下函数绘制出来:
def plot_sequential_palettes(ax):
 ax.set_title('Sequential Palettes')
 plotter = plotting.CyclePlotter(ax)
 pal = sns.color_palette("Blues")
 plot_palette(ax, plotter, pal, 0, 'Blues')
 pal = sns.color_palette("BuGn_r")
 plot_palette(ax, plotter, pal, 1, 'BuGn_r')
 pal = sns.color_palette("GnBu_d")
 plot_palette(ax, plotter, pal, 2, 'GnBu_d')
 pal = sns.color_palette("cubehelix", 6)
 plot_palette(ax, plotter, pal, 3, 'cubehelix')
(7)以下几行代码调用了我们之前定义的函数:
%matplotlib inline
fig, axes = plt.subplots(2, 2, figsize=(16, 12))
plot_categorical_palettes(axes[0][0])
plot_circular_palettes(axes[0][1])
plot_brewer_palettes(axes[1][0])
plot_sequential_palettes(axes[1][1])
plotting.hide_axes(axes)
plt.tight_layout()
请参见以下截图了解最终结果:
03 选择matplotlib的颜色表
matplotlib的颜色表最近受到了很多批评,因为它们可能会误导用户,但是在我看来大多数的颜色表还是不错的。默认的颜色表在matplotlib 2.0中有一些改进,可以在这里查看:
http://matplotlib.org/style_changes.html
当然,有些matplotlib的颜色表不支持一些不错的参数,比如说jet。在艺术中,就像数据分析中一样,几乎没有什么东西是绝对正确的,所以这里就交给读者去判断。
实际上,我觉得考虑如何解决印刷出版物以及各种各样的色盲问题是很重要的。在这个示例中我将用色条来可视化相对安全的颜色表。这里使用到的是matplotlib众多颜色表中的很小一部分。
- 操作步骤
(1)导入部分如下:
import matplotlib.pyplot as plt
import matplotlib as mpl
from dautil import plotting
(2)通过以下代码画出数据集:
fig, axes = plt.subplots(4, 4)
cmaps = ['autumn', 'spring', 'summer', 'winter',
 'Reds', 'Blues', 'Greens', 'Purples',
 'Oranges', 'pink', 'Greys', 'gray',
 'binary', 'bone', 'hot', 'cool']
for ax, cm in zip(axes.ravel(), cmaps):
 cmap = plt.cm.get_cmap(cm)
 cb = mpl.colorbar.ColorbarBase(ax, cmap=cmap,
 orientation='horizontal')
 cb.set_label(cm)
 ax.xaxis.set_ticklabels([])
plt.tight_layout()
plt.show()
请参见以下截图了解最终结果:
04 与IPython Notebook部件交互
简单来说,这些部件可以让你像在HTML表单里一样选择一些值,这包括滑块、下拉框、选择框等。正如你会读到的,这些部件非常方便将我们在第1章中提及的天气数据可视化。
- 操作步骤
(1)导入部分如下:
import seaborn as sns
import numpy as np
import pandas as pd
import matplotlib.pyplot as plt
from IPython.html.widgets import interact
from dautil import data
from dautil import ts
(2)加载数据同时请求内联图:
%matplotlib inline
df = data.Weather.load()
(3)定义以下函数,这个函数会显示气泡图:
def plot_data(x='TEMP', y='RAIN', z='WIND_SPEED', f='A', size=10,cmap='Blues'):
 dfx = df[x].resample(f)
 dfy = df[y].resample(f).mean()
 dfz = df[z].resample(f).mean()
 bubbles = (dfz - dfz.min())/(dfz.max() - dfz.min())
 years = dfz.index.year
 sc = plt.scatter(dfx, dfy, s= size * bubbles + 9, c = years,
 cmap=cmap, label=data.Weather.get_header(z),
 alpha=0.5)
 plt.colorbar(sc, label='Year')
 freqs = {'A': 'Annual', 'M': 'Monthly', 'D': 'Daily'}
 plt.title(freqs[f] + ' Averages')
 plt.xlabel(data.Weather.get_header(x))
 plt.ylabel(data.Weather.get_header(y))
 plt.legend(loc='best')
(4)通过以下代码调用我们刚刚定义的函数:
vars = df.columns.tolist()
freqs = ('A', 'M', 'D')
cmaps = [cmap for cmap in plt.cm.datad if not cmap.endswith("_r")]
cmaps.sort()
interact(plot_data, x=vars, y=vars, z=vars, f=freqs,size=(100,700), cmap=cmaps)
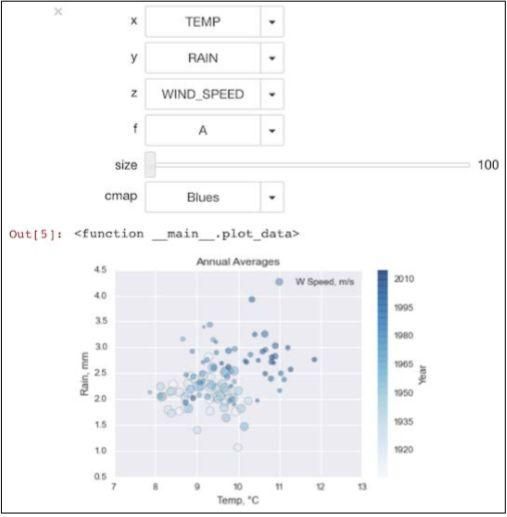
(5)本示例需要上手操作一下来理解它的工作原理,下面是一个样例气泡图:
(6)定义另一个函数(和第(2)步中的程序同名,注释掉前一个),这个函数里我们将数据按照日或月进行分组:
def plot_data(x='TEMP', y='RAIN', z='WIND_SPEED',
 groupby='ts.groupby_yday',
 size=10, cmap='Blues'):
 if groupby == 'ts.groupby_yday':
 groupby = ts.groupby_yday
 elif groupby == 'ts.groupby_month':
 groupby = ts.groupby_month
 else:
 raise AssertionError('Unknown groupby ' + groupby)
 dfx = groupby(df[x]).mean()
 dfy = groupby(df[y]).mean()
 dfz = groupby(df[z]).mean()
 bubbles = (dfz - dfz.min())/(dfz.max() - dfz.min())
 colors = dfx.index.values
 sc = plt.scatter(dfx, dfy, s= size * bubbles + 9,
 c = colors,cmap=cmap,
 label=data.Weather.get_header(z), alpha=0.5)
 plt.colorbar(sc, label='Day of Year')
 by_dict = {ts.groupby_yday: 'Day of Year', ts.groupby_month: 'Month'}
 plt.title('Grouped by ' + by_dict[groupby])
 plt.xlabel(data.Weather.get_header(x))
 plt.ylabel(data.Weather.get_header(y))
 plt.legend(loc='best')
(7)用这段代码调用上述函数:
groupbys = ('ts.groupby_yday', 'ts.groupby_month')
interact(plot_data, x=vars, y=vars, z=vars, groupby=groupbys,
size=(100,700), cmap=cmaps)
请参见以下截图了解最终结果:
我对这个图的第一印象是温度和风速似乎是正相关的。
05 查看散点图矩阵
如果你的数据集中变量不是很多,那么查看你数据所有的散点图是个不错的主意。通过调用Seaborn或者pandas的一个函数就可以做到。这些函数会展示一个矩阵的核密度估计图或对角线上的直方图。
- 操作步骤
(1)导入部分如下:
import pandas as pd
from dautil import data
from dautil import ts
import matplotlib.pyplot as plt
import seaborn as sns
import matplotlib as mpl
(2)以下几行代码加载天气数据:
df = data.Weather.load()
df = ts.groupby_yday(df).mean()
df.columns = [data.Weather.get_header(c) for c in df.columns]
(3)用Seaborn的pairplot()函数绘制图形,这个函数默认绘制对角线上的直方图:
%matplotlib inline
# Seaborn plotting, issues due to NaNs
sns.pairplot(df.fillna(0))
结果如下所示:
(4)通过pandas的scatter_matrix()函数生成一个类似的图形,并请求对角线上的核密度估计图:
sns.set({'figure.figsize': '16, 12'})
mpl.rcParams['axes.linewidth'] = 9
mpl.rcParams['lines.linewidth'] = 2
plots = pd.scatter_matrix(df, marker='o', diagonal='kde')
plt.show()
请参见以下截图了解最终结果:
06 通过mpld3使用d3.js进行可视化
d3.js是在2011年推出的一个JavaScript数据可视化库,我们可以在IPython Notebook里面使用这个库。我们将在一个普通matplotlib图上添加一个悬浮工具提示。这里我们会使用mpld3包作为使用d3.js的桥梁。这个示例不需要任何JavaScript编程。
1. 准备工作
通过以下命令安装mpld3 0.2:
$ [sudo] pip install mpld3
2. 操作步骤
(1)由导入开始,并启用mpld3:
%matplotlib inline
import matplotlib.pyplot as plt
import mpld3
mpld3.enable_notebook()
from mpld3 import plugins
import seaborn as sns
from dautil import data
from dautil import ts
(2)加载天气数据并按照下面的方法将其绘制出来:
df = data.Weather.load()
df = df[['TEMP', 'WIND_SPEED']]
df = ts.groupby_yday(df).mean()
fig, ax = plt.subplots()
ax.set_title('Averages Grouped by Day of Year')
points = ax.scatter(df['TEMP'], df['WIND_SPEED'],
 s=30, alpha=0.3)
ax.set_xlabel(data.Weather.get_header('TEMP'))
ax.set_ylabel(data.Weather.get_header('WIND_SPEED'))
labels = ["Day of year {0}".format(i) for i in range(366)]
tooltip = plugins.PointLabelTooltip(points, labels)
plugins.connect(fig, tooltip)
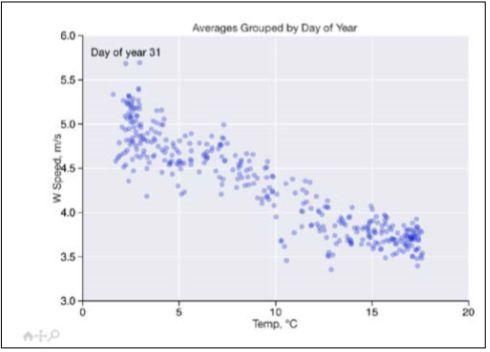
高亮显示的那一行是工具栏。在下面的截图中,我们可以看到“Day of year 31”文本来自这个工具栏:
如你所见,在这个图形的底部,还有可以平移和缩放图形的装置。
07 创建热图
热图使用一组颜色在矩阵中可视化数据。最初,热图用于表示金融资产(如股票)的价格。Bokeh是一个Python包,可以在IPython Notebook中显示热图,或者生成一个独立的HTML文件。
1. 准备工作
Anaconda自带了Bokeh 0.9.1。Bokeh的安装说明在:
http://bokeh.pydata.org/en/latest/docs/installation.html
2. 操作步骤
(1)导入部分如下:
from collections import OrderedDict
from dautil import data
from dautil import ts
from dautil import plotting
import numpy as np
import bokeh.plotting as bkh_plt
from bokeh.models import HoverTool
(2)下面的函数加载了温度数据并按照年和月进行分组:
def load():
 df = data.Weather.load()['TEMP']
 return ts.groupby_year_month(df)
(3)定义一个将数据重排成特殊的Bokeh结构的函数:
def create_source():
 colors = plotting.sample_hex_cmap()
 month = []
 year = []
 color = []
 avg = []
 for year_month, group in load():
 month.append(ts.short_month(year_month[1]))
 year.append(str(year_month[0]))
 monthly_avg = np.nanmean(group.values)
 avg.append(monthly_avg)
 color.append(colors[min(int(abs(monthly_avg)) - 2, 8)])
 source = bkh_plt.ColumnDataSource(data=dict(month=month, year=year, color=color, avg=avg))
 return year, source
(4)定义一个返回横轴标签的函数:
def all_years():
 years = set(year)
 start_year = min(years)
 end_year = max(years)
 return [str(y) for y in range(int(start_year), int(end_year),5)]
(5)定义一个绘制包含了悬浮工具栏的热图的函数:
def plot(year, source):
 fig = bkh_plt.figure(title="De Bilt, NL Temperature (1901 -2014)",
 x_range=all_years(),
 y_range=list(reversed(ts.short_months())),
 toolbar_location="left",
 tools="resize,hover,save,
 pan,box_zoom,wheel_zoom")
 fig.rect("year", "month", 1, 1, source=source,
 color="color", line_color=None)
 fig.xaxis.major_label_orientation = np.pi/3
 hover = fig.select(dict(type=HoverTool))
 hover.tooltips = OrderedDict([
 ('date', '@month @year'),
 ('avg', '@avg'),
 ])
 bkh_plt.output_notebook()
 bkh_plt.show(fig)
(6)调用上述定义的函数:
year, source = create_source()
plot(year, source)
请参见以下截图了解最终结果:
08 把箱线图、核密度图和小提琴图组合
小提琴图(Violin Plot)是一种组合盒图和核密度图或直方图的图形类型。Seaborn和matplotlib都能提供小提琴图。在这个示例中我们将使用Seaborn来绘制天气数据的Z分数(标准分数),分数的标准化并不是必需的,但是如果没有它的话小提琴图会很发散。
- 操作步骤
(1)导入部分如下:
import seaborn as sns
from dautil import data
import matplotlib.pyplot as plt
(2)加载天气数据并计算标准分数:
df = data.Weather.load()
zscores = (df - df.mean())/df.std()
(3)绘制标准分数的小提琴图:
%matplotlib inline
plt.figure()
plt.title('Weather Violin Plot')
sns.violinplot(zscores.resample('M').mean())
plt.ylabel('Z-scores')
第一个小提琴图如下所示:
(4)绘制雨天和旱天相对风速的小提琴图:
plt.figure()
plt.title('Rainy Weather vs Wind Speed')
categorical = df
categorical['RAIN'] = categorical['RAIN'] > 0
ax = sns.violinplot(x="RAIN", y="WIND_SPEED",data=categorical)
第二个小提琴图如下所示:
09 使用蜂巢图可视化网络图
蜂巢图(Hive Plot)是用于绘制网络图的可视化技术。在蜂巢图中我们将边缘绘制为曲线。我们根据属性对节点进行分组,并在径向轴上显示它们。
有些库在蜂窝图方面很专业。同时我们将使用API来划分Facebook用户的图形。
https://snap.stanford.edu/data/egonets-Facebook.html
这个数据属于斯坦福网络分析项目(Stanford Network Analysis Project,SNAP),它也提供了Python API,但是目前SNAP API还不支持Python 3。
1. 准备工作
Anaconda自带了NetworkX 1.9.1,它安装说明可见:
https://networkx.github.io/documentation/latest/install.html
同时我们还需要community包,安装地址:
https://bitbucket.org/taynaud/python-louvain
在PyPi上有一个同名的包,但是它和我们需要安装的没有任何关系。安装hiveplot包,这个包托管在:
https://github.com/ericmjl/hiveplot
$ [sudo] pip install hiveplot
本示例中使用的hiveplot版本是0.1.7.4。
2. 操作步骤
(1)导入部分如下所示:
import networkx as nx
import community
import matplotlib.pyplot as plt
from hiveplot import HivePlot
from collections import defaultdict
from dautil import plotting
from dautil import dataython
(2)载入数据,创建一个NetworkX的Graph对象:
fb_file = data.SPANFB().load()
G = nx.read_edgelist(fb_file,create_using = nx.Graph(),nodetype = int)
print(nx.info(G))
(3)分割图形对象并按照如下的方法创建一个nodes字典:
parts = community.best_partition(G)
nodes = defaultdict(list)
for n, d in parts.items():
 nodes[d].append(n)
(4)这个图形会非常大,所以我们将会创建三个边缘分组:
edges = defaultdict(list)
for u, v in nx.edges(G, nodes[0]):
 edges[0].append((u, v, 0))
for u, v in nx.edges(G, nodes[1]):
 edges[1].append((u, v, 1))
for u, v in nx.edges(G, nodes[2]):
 edges[2].append((u, v, 2))
(5)绘制这个图形大约需要6分钟:
%matplotlib inline
cmap = plotting.sample_hex_cmap(name='hot', ncolors=len(nodes.keys()))
h = HivePlot(nodes, edges, cmap, cmap)
h.draw()
plt.title('Facebook Network Hive Plot')
等待一段时间,我们可以看到如下的图形:
10 显示地图
无论是处理全球数据还是本地数据,使用地图都是一个适合的可视化方式。我们需要用坐标来将数据定位到地图上,通常我们使用的就是这个点的经度和纬度。有很多现有的文件格式可以存储地理位置数据。
在这个示例中我们将会使用到特别的shapefile格式以及更常见的制表符分隔值(Tab Separated Values,TSV)格式。shapefile格式是由Esri公司创建的,并包含了三个必需的文件,它们的扩展名分别是.shp、.shx、.dbf。
.dbf文件包含了shapefile中每一个地理位置的额外信息的数据库。我们将使用的shapefile包含了国家边界、人口以及国内生产总值(Gross Domestic Product,GDP)的数据。我们可以使用cartopy库下载shapefile。
TSV文件包含了超过4000个城市的按时间序列的人口数据,可以在这里获得:
https://nordpil.com/resources/world-database-of-large-cities/
1. 准备工作
首先我们需要从源文件安装Proj.4,或者你也可以使用二进制版本安装:
https://github.com/OSGeo/proj.4/wiki
Proj.4的安装说明在:
https://github.com/OSGeo/proj.4
然后我们可以通过pip安装cartopy,本示例中使用到的是cartopy-0.13.0。或者你也可以通过下面的指令进行安装:
$ conda install -c scitools cartopy
2. 操作步骤
(1)导入部分如下所示:
import cartopy.crs as ccrs
import matplotlib.pyplot as plt
 import cartopy.io.shapereader as shpreader
 import matplotlib as mpl
 import pandas as pd
 from dautil import options
 from dautil import data
(2)我们会使用颜色来做国家人口以及人口众多的城市的可视化。引入如下数据:
countries = shpreader.natural_earth(resolution='110m',
 category='cultural',
 name='admin_0_countries')
cities = pd.read_csv(data.Nordpil().load_urban_tsv(),sep='	', encoding='ISO-8859-1')
mill_cities = cities[cities['pop2005'] > 1000]
(3)使用以下代码画出地图,以及相应的颜色条,并将人口众多的城市标记在地图上:
%matplotlib inline
plt.figure(figsize=(16, 12))
gs = mpl.gridspec.GridSpec(2, 1,
 height_ratios=[20, 1])
ax = plt.subplot(gs[0], projection=ccrs.PlateCarree())
norm = mpl.colors.Normalize(vmin=0, vmax=2 * 10 ** 9)
cmap = plt.cm.Blues
ax.set_title('Population Estimates by Country')
for country in shpreader.Reader(countries).records():
 ax.add_geometries(country.geometry, ccrs.PlateCarree(),
 facecolor=cmap(
 norm(country.attributes['pop_est'])))
plt.plot(mill_cities['Longitude'],
 mill_cities['Latitude'], 'r.',
 label='Populous city',
 transform=ccrs.PlateCarree())
options.set_mpl_options()
plt.legend(loc='lower left')
cax = plt.subplot(gs[1])
cb = mpl.colorbar.ColorbarBase(cax,
 cmap=cmap,
 norm=norm,
 orientation='horizontal')
cb.set_label('Population Estimate')
plt.tight_layout()
11 使用类ggplot2图
ggplot2是在R语言用户群中很流行的数据可视化库。ggplot2的主要思想是在数据可视化的产出中包含多个图层。就像一个画家,我们从一个空的画布开始,紧接着一步步地添加图层。
通常我们使用rpy2来让Python接入R语言代码。然而,如果我们只是想使用ggplot2的话,用pyggplot库会显得更加方便。在这个示例中将实现三个国家的人口增长的可视化,使用的数据来自pandas上检索到的世界银行的数据。这些数据中包含各种指标和相关元数据。在这里可以下载到关于这些指标的描述:
http://api.worldbank.org/v2/en/topic/19?downloadformat=excel
我们可以认为世界银行的数据集是静态的。然而,类似的数据集经常发生变化,足以占用分析师所有的时间。更换指标的名字明显会影响代码,所以我决定通过joblib库来缓存数据。但是这个方法美中不足的是不能pickle所有的Python对象。
1. 准备工作
首先你需要有安装了ggplot2的R语言环境。如果你不是特别想使用ggplot2,或许你可以跳过这个示例。
R语言的主页是:
http://www.r-project.org/
ggplot2的文档:
http://docs.ggplot2.org/current/index.html
你可以通过pip安装pyggplot,我使用的是pyggplot-23。安装joblib,请浏览:
https://pythonhosted.org/joblib/installing.html
我的Anaconda中有joblib 0.8.4。
2. 操作步骤
(1)导入部分如下:
import pyggplot
from dautil import data
(2)通过以下代码加载数据:
dawb = data.Worldbank()
pop_grow = dawb.get_name('pop_grow')
df = dawb.download(indicator=pop_grow, start=1984, end=2014)
df = dawb.rename_columns(df, use_longnames=True)
(3)下面用我们新建的pandas对象DataFrame初始化pyggplot:
p = pyggplot.Plot(df)
(4)添加条形图:
p.add_bar('country', dawb.get_longname(pop_grow), color='year')
(5)翻转图表,使条形图指向右边并渲染
p.coord_flip()
p.render_notebook()
请参见以下截图了解最终结果:
12 使用影响图高亮数据
类似于气泡图,影响图(influence plot)会考虑到单个数据点拟合、影响和杠杆之后的残差。残差的大小绘制在垂直轴上,并且可以标识数据点是异常值。为了更好地理解影响图,可以看下面的这些方程。
根据statsmodels文档,残差按标准偏差式(2.1)进行缩放,在式(2.2)中,n是观测点的数量,p是回归量。式(2.3)我们习惯称之为帽子矩阵(hat-matrix)。帽子矩阵的对角元素给出称为杠杆(leverage)的特殊度量,杠杆作为水平轴的量,可以标识出影响图的潜在影响。
在影响图中,影响会决定绘图点的大小。影响大的点往往具有高残差和杠杆。statsmodels可以使用Cook距离(Cook's distance)(见式(2.4))或者DFFITS(见式(2.5))来衡量影响值。
- 操作步骤
(1)导入部分如下:
import matplotlib.pyplot as plt
import statsmodels.api as sm
from statsmodels.formula.api import ols
from dautil import data
(2)获取可用的国家的编码:
dawb = data.Worldbank()
countries = dawb.get_countries()[['name', 'iso2c']]
(3)从世界银行加载数据:
population = dawb.download(indicator=[dawb.get_name('pop_grow'),
 dawb.get_name('gdp_pcap'),
 dawb.get_name('primary_education')],
 country=countries['iso2c'],
 start=2014,
 end=2014)
population = dawb.rename_columns(population)
(4)定义一个普通最小二乘模型如下:
population_model = ols("pop_grow ~ gdp_pcap + primary_education",
 data=population).fit()
(5)使用Cook距离描绘这个模型的影响图:
%matplotlib inline
fig, ax = plt.subplots(figsize=(19.2, 14.4))
fig = sm.graphics.influence_plot(population_model, ax=ax, criterion="cooks")
plt.grid()
请参见以下截图了解最终结果:
关于作者:Ivan Idris,曾是Java和数据库应用开发者,后专注于Python和数据分析领域,致力于编写干净、可测试的代码。他还是《Python Machine Learning By Example》《NumPy Cookbook》等书的作者,在工程实践和书籍撰写方面都非常有经验。
本文摘编自《Python数据分析实战》,经出版方授权发布。
延伸阅读《Python数据分析实战》
推荐语:面向实际问题的Python数据分析实践指南,通过丰富的实例、大量的代码片段和图例,可以帮助你快速掌握用Python进行数据分析的各种技术。
![]()


