生信学习——基于R的可视化习题30个(附详细答案解读)
题目目录
- 一、基础绘图
-
- 1. 对RNAseq_expr的每一列绘制boxplot图
- 2. 对RNAseq_expr的每一列绘制density图
- 3. 对RNAseq_expr的每一列绘制条形图
- 4. 对RNAseq_expr的每一列取log2后重新绘制boxplot图,density图和条形图
- 5. 对Q4的3个图里面添加 trt 和 untrt 组颜色区分开来
- 6. 对RNAseq_expr的前两列画散点图并且计算线性回归方程
- 7. 对RNAseq_expr的所有列两两之间计算相关系数,并且热图可视化
- 8. 取RNAseq_expr第一行表达量绘制折线图
- 9. 取RNAseq_expr表达量最高的10个基因的行绘制多行折线图
- 10. 一行行的运行
- 二、GGPLOT绘图
-
- 1. 使用ggplot代码重写上面基础绘图的Q1-5习题
- 2. 使用ggplot代码重写上面基础绘图的Q6-9习题
- 三、生物信息学绘图
-
- 1. 一行行的运行:
- 2. 对RNAseq_expr挑选MAD值最大的100个基因的表达矩阵绘制热图
- 3. 对RNAseq_expr进行主成分分析并且绘图
- 4. 对RNAseq_expr进行差异分析并且绘制火山图
- 5. 对RNAseq_expr进行差异分析并且绘制(平均值VS变化倍数)图
写在前面——这是R语言学习的最后一个习题集,本文主要介绍如何使用R语言进行数据可视化,帮助我们直观的看清数据的含义。绘图函数千变万化,不可能把所有的函数全部记下来。要熟练使用帮助文档,不会的时候多翻翻代码,需要长时间积累才能熟练掌握R绘图。
题目原文:http://www.bio-info-trainee.com/4387.html
参考答案:https://www.jianshu.com/p/fab27c63af94
参考答案:https://www.jianshu.com/p/8fce9d2ad562
一、基础绘图
# 准备数据
rm(list = ls())
options(stringsAsFactors = F)

library(airway)
data("airway")
airway

RNAseq_expr <- assay(airway)
dim(RNAseq_expr)
colnames(RNAseq_expr)
RNAseq_expr[1:4,1:4]

RNAseq_gl <- colData(airway)[,3]
table(RNAseq_gl)
1. 对RNAseq_expr的每一列绘制boxplot图
boxplot(RNAseq_expr)
2. 对RNAseq_expr的每一列绘制density图
# 去除无用值(列之和小于等于1的数据)
e1 <- RNAseq_expr[apply(RNAseq_expr, 1, function(x) sum(x>0)>1), ]

dim(RNAseq_expr)
# [1] 64102     8
dim(e1)
# [1] 28877     8

plot(density(RNAseq_expr))
plot(density(e1))
3. 对RNAseq_expr的每一列绘制条形图
# 没经过处理的图,瞄一眼就行了,没啥意义
barplot(RNAseq_expr)
4. 对RNAseq_expr的每一列取log2后重新绘制boxplot图,density图和条形图
e2 <- log2(e1+1)

# 取log2之后的数据绘图看着舒服多了
# 针对源数据数值较大且差值也比较大时,可以考虑log一下
boxplot(e2)
plot(density(e2))
barplot(e2)
5. 对Q4的3个图里面添加 trt 和 untrt 组颜色区分开来
# 箱线图
boxplot(e2, main = 'Boxplot of RNAseq-expr',
        xlab = 'samples',ylab = 'expression',col = RNAseq_gl)

# 密度图
# 生成一个可以修改的当前图形参数列表
opar <- par(no.readonly=T)
par(mfrow = c(3,3))
for (i in c(1:8)) {

  plot(density(e2[,i]), col=as.integer(RNAseq_gl)[i], main = paste("Density", i))
}
# 将参数重置为修改之前的值
par(opar)

# 如果不小心直接修改了par(),重启RStudio即可恢复默认值

# 直方图
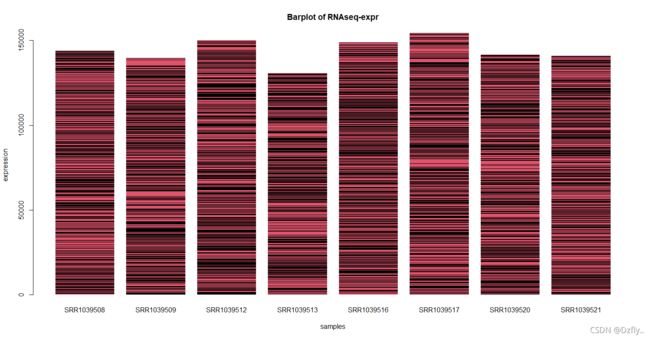
barplot(e2, main = 'Barplot of RNAseq-expr',
        xlab = 'samples',ylab = 'expression', border = NA, col = RNAseq_gl)

# 此时图非常诡异,取个小子集看看什么情况
e3 <- e2[1:10,]
barplot(e3, main = 'Barplot of RNAseq-expr',
        xlab = 'samples',ylab = 'expression', border = NA, col = RNAseq_gl)
可以看到,我们想要的结果是每列的颜色根据分组依次变换 但是,图的颜色是在每列中依次变换的
原因是barplot中,数据如果是矩阵,且beside为FALSE(默认),那么图中的每列是由这列数据逐个堆叠而成的,所以颜色也是逐个赋予的
解释有点乱,附上原文
barplot(height, …)
height: either a vector or matrix of values describing the bars which make up the plot. If height is a vector, the plot consists of a sequence of rectangular bars with heights given by the values in the vector. If height is a matrix and beside is FALSE then each bar of the plot corresponds to a column of height, with the values in the column giving the heights of stacked sub-bars making up the bar. If height is a matrix and beside is TRUE, then the values in each column are juxtaposed rather than stacked.
6. 对RNAseq_expr的前两列画散点图并且计算线性回归方程
e4 <- as.data.frame(e2)
# 'data' must be a data.frame, not a matrix or an array
fit <- lm(e4[,1] ~ e4[,2], data = e4)
fit

# Call:
# lm(formula = e4[, 1] ~ e4[, 2], data = e4)
#
# Coefficients:
# (Intercept)      e4[, 2]
#      0.2105       0.9868

# 原数据差值较大,使用log2处理后的数据
plot(RNAseq_expr[,1:2])
plot(e2[,1:2])

abline(fit, col = "red")
7. 对RNAseq_expr的所有列两两之间计算相关系数,并且热图可视化
M <- cor(e2)
pheatmap::pheatmap(M)
8. 取RNAseq_expr第一行表达量绘制折线图
plot(e2[1,], type="b", xlab = "gene", ylab="expression", col="red")

# type="b"是最常见的折线图
# type
p     只有点
l     只有线
o     实心点和线(即线覆盖在点上)
b、c  线连接点(c 时不绘制点)
s、S  阶梯线
h     直方图式的垂直线
n     不生成任何点和线(通常用来为后面的命令创建坐标轴)
9. 取RNAseq_expr表达量最高的10个基因的行绘制多行折线图
top10 <- e2[names(tail(sort(rowSums(e2)), 10)), ]
top10

# 设置横纵坐标的区间
library(reshape2)
yrange <- range(melt(top10)[,3])
yrange
# [1] 16.15977 18.97075
yrange <- c(16,19)
xrange <- c(1,8)

# 绘图
# plot()函数是在被调用时创建一幅新图
# lines()函数则是在已存在的图形上添加信息,并不能自己生成图形。
# 因此,lines()函数通常是在plot()函数生成一幅图形后再被调用。
plot(xrange, yrange, type="n", xlab = "gene", ylab="expression")
for(i in c(1:10)){

  lines(top10[i,], type="b", xlab = "gene", ylab="expression", pch = i)
}
10. 一行行的运行
https://github.com/jmzeng1314/5years/blob/master/learn-R/tasks/2-chunjuan-600.R 代码
代码很完整,流畅跑没问题。
二、GGPLOT绘图
# ggplot2中常用的几何函数
geom_bar() 条形图 color、fill、alpha
geom_boxplot() 箱线图 color、fill、alpha、notch、width
geom_density() 密度图 color、fill、alpha、linetype
geom_histogram() 直方图 color、fill、alpha、linetype、binwidth
geom_hline() 水平线 color、alpha、linetype、size
geom_jitter() 抖动点 color、size、alpha、shape
geom_line() 线图 colorvalpha、linetype、size
geom_point() 散点图 color、alpha、shape、size
geom_rug() 地毯图 color、side
geom_smooth() 拟合曲线 method、formula、color、fill、linetype、size
geom_text() 文字注解 很多,参见函数的“帮助”
geom_violin() 小提琴图 color、fill、alpha、linetype
geom_vline() 垂线 color、alpha、linetype、size


# 几何函数的常见选项
color 对点、线和填充区域的边界进行着色
fill 对填充区域着色,如条形和密度区域
alpha 颜色的透明度,从0(完全透明)到1(不透明)。
linetype 图案的线条(1=实线,2=虚线,3=点,4=点破折号,5=长破折号,6=双破折号)
size 点的尺寸和线的宽度
shape 点的形状(和pch一样,0=开放的方形,1=开放的圆形,2=开放的三角形,等等),参见图3-4
position 绘制诸如条形图和点等对象的位置。对条形图来说,"dodge"将分组条形图并排,"stacked"堆叠分组条形图,"fill"垂直地堆叠分组条形图并规范其高度相等。对于点来说,"jitter"减少点重叠
binwidth 直方图的宽度
notch 表示方块图是否应为缺口(TRUE/FALSE)
sides 地毯图的安置("b"=底部,"l"=左部,"t"=顶部,"r"=右部,"bl"=左下部,等等)
width 箱线图的宽度
1. 使用ggplot代码重写上面基础绘图的Q1-5习题
# 数据准备
rm(list = ls())
options(stringsAsFactors = F)

library(airway)
data("airway")
airway

RNAseq_expr <- assay(airway)
RNAseq_gl <- colData(airway)[,3]

e1 <- RNAseq_expr[apply(RNAseq_expr, 1, function(x) sum(x>0)>1), ]
e2 <- log2(e1+1)

# 使用ggplot绘图时,数据应该为data.frame格式
library(reshape2)
me2 <- melt(e2)
colnames(me2) <- c("gene", "sample", "expression")
tmp <- data.frame(group_list=RNAseq_gl)
rownames(tmp) <- colnames(RNAseq_expr)
tmp$sample <- rownames(tmp)
e3 <- merge(me2, tmp, by="sample")

group <- as.data.frame(colData(airway)[,c(3,5)])
group


# 第5题包含前面4题
### 5 ###
library(ggplot2)

# 箱线图
ggplot(e3, aes(sample, expression, fill = group_list)) + geom_boxplot()

# 密度图
# 根据sample进行分组
ggplot(e3, aes(expression, color = sample)) + geom_density()
# 根据trt、untrt进行分组
ggplot(e3, aes(expression, color = group_list)) + geom_density()

# 条形图
# geom_bar() uses stat_count() by default: it counts the number of cases at each x position.
# geom_col() uses stat_identity(): it leaves the data as is.
ggplot(e3, aes(sample, expression, fill = group_list)) + geom_bar(stat="identity")
2. 使用ggplot代码重写上面基础绘图的Q6-9习题
### 6 ###
ggplot(as.data.frame(e2[, 1:2]), aes(x = SRR1039508, y = SRR1039509)) + geom_point() + geom_smooth(method = "lm")


### 7 ###
# 像热图,但不完全是热图(doge)
M <- cor(e2)
meltM <- melt(M)
# If you want to draw arbitrary rectangles, use geom_tile() or geom_rect()
ggplot(meltM, aes(x = Var1, y = Var2, fill = value)) + geom_tile()


### 8 ###
# 折线图
e4 <- data.frame(expression = e2[1, ])
e4$sample <- rownames(e4)

ggplot(e4, aes(x = sample, y = expression, group = 1)) + geom_line() + geom_point()


### 9 ###
top10 <- e2[names(tail(sort(rowSums(e2)), 10)), ]
top10 <- melt(top10)
colnames(top10) <- c("gene", "sample", "expression")

ggplot(top10, aes(x = sample, y = expression, color = gene, group = gene)) + geom_line() + geom_point()
关于8、9题参数group的解释:
For line graphs, the data points must be grouped so that it knows which points to connect. In this case, it is simple – all points should be connected, so group=1. When more variables are used and multiple lines are drawn, the grouping for lines is usually done by variable.


Q10: 一行行的运行:http://biotrainee.com/jmzeng/markdown/ggplot-in-R.html 代码
三、生物信息学绘图
需要参考 https://github.com/jmzeng1314/GEO/blob/master/airway_RNAseq/DEG_rnsseq.R
1. 一行行的运行:
https://github.com/jmzeng1314/5years/blob/master/learn-R/tasks/top50ggplot.Rmd
代码除了几个数据链接失效了,其他的都很通畅。
2. 对RNAseq_expr挑选MAD值最大的100个基因的表达矩阵绘制热图
# 取mad值最大的100个基因名
top100_mad <- names(tail(sort(apply(e1, 1, mad)), 100))
# top100_mad

# 数据标准化是指:数值减去均值,再除以标准差
z_score <- t(scale(t(e2)))

# 取top100矩阵
top100 <- z_score[rownames(z_score) %in% top100_mad,]

pheatmap::pheatmap(top100)
3. 对RNAseq_expr进行主成分分析并且绘图
# PCA图应使用z-score矩阵绘制
library(ggplot2)
library(ggfortify)

dat <- z_score
df <- as.data.frame(t(dat))

# 加一列方便分组绘图
group_list <- RNAseq_gl
df$group <- group_list

autoplot(prcomp(df[,1:(ncol(df)-1)]), data = df, colour = 'group') + theme_bw()


# install.packages("FactoMineR")
# install.packages("factoextra")
library("FactoMineR")
library("factoextra")

# 重置df
df <- as.data.frame(t(dat))

# ?PCA
# graph: boolean, if TRUE a graph is displayed
dat.pca <- PCA(df, graph = FALSE)

# ?fviz_pca_ind
fviz_pca_ind(dat.pca, geom.ind = "point", col.ind = group_list, addEllipses = TRUE,
             legend.title = "Groups")
4. 对RNAseq_expr进行差异分析并且绘制火山图
# 差异分析
# BiocManager::install("DESeq2")
suppressMessages(library(DESeq2))

colData <- data.frame(row.names = colnames(RNAseq_expr), group_list = group_list)

# ?DESeqDataSetFromMatrix()
# Rows of colData correspond to columns of countData
dds <- DESeqDataSetFromMatrix(countData = RNAseq_expr, colData = colData, design = ~ group_list)

# ?DESeq
dds <- DESeq(dds)
res <- results(dds, contrast=c("group_list","trt","untrt"))
resOrdered <- res[order(res$padj),]
head(resOrdered)

# output #
log2 fold change (MLE): group_list trt vs untrt
Wald test p-value: group_list trt vs untrt
DataFrame with 6 rows and 6 columns
                 baseMean log2FoldChange     lfcSE      stat       pvalue         padj
                <numeric>      <numeric> <numeric> <numeric>    <numeric>    <numeric>
ENSG00000152583   997.440        4.60253 0.2117708   21.7335 9.89036e-105 1.83911e-100
ENSG00000148175 11193.719        1.45147 0.0848249   17.1113  1.22198e-65  1.13614e-61
ENSG00000179094   776.597        3.18386 0.2015154   15.7996  3.13247e-56  1.94161e-52
ENSG00000134686  2737.982        1.38714 0.0915842   15.1461  8.04404e-52  3.73947e-48
ENSG00000125148  3656.253        2.20344 0.1474087   14.9478  1.60924e-50  5.98476e-47
ENSG00000120129  3409.029        2.94898 0.2016136   14.6269  1.89198e-48  5.86358e-45


# 绘制火山图
DEG <- as.data.frame(resOrdered)
nrDEG <- na.omit(DEG)
DEseq_DEG <- nrDEG
nrDEG <- DEseq_DEG[,c(2,6)]
colnames(nrDEG) <- c('log2FoldChange','pvalue')


logFC_cutoff <- with(nrDEG,mean(abs(log2FoldChange)) + 2*sd(abs( log2FoldChange)))

# &依次比较两个向量中的对应元素,而&&只比较两个向量的首个元素
nrDEG$change <-  as.factor(ifelse(nrDEG$pvalue < 0.05 & abs(nrDEG$log2FoldChange) > logFC_cutoff, ifelse(nrDEG$log2FoldChange > logFC_cutoff ,'UP','DOWN'),'NOT'))

this_title <- paste0('Cutoff for logFC is ',round(logFC_cutoff,3),
                    '\nThe number of up gene is ',nrow(nrDEG[nrDEG$change =='UP',]) ,
                    '\nThe number of down gene is ',nrow(nrDEG[nrDEG$change =='DOWN',]))

volcano <- ggplot(data=nrDEG, aes(x=log2FoldChange, y=-log10(pvalue), color=change)) +
  geom_point(alpha=0.4, size=1.75) + xlab("log2 fold change") + ylab("-log10 p-value") +
  ggtitle(this_title) + theme(plot.title = element_text(size=15,hjust = 0.5)) +
  scale_colour_manual(values = c('blue','black','red'))

volcano
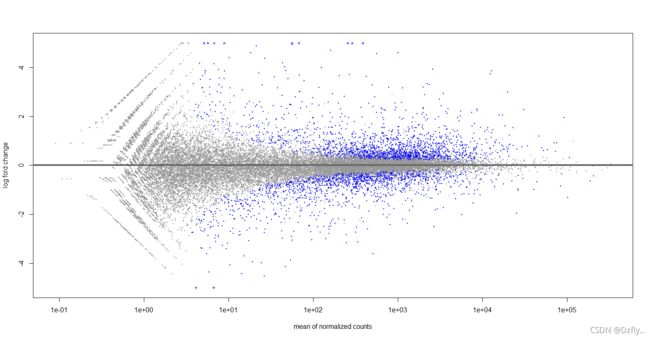
5. 对RNAseq_expr进行差异分析并且绘制(平均值VS变化倍数)图
plotMA(res,ylim=c(-5,5))

# 报错了
# 'coef' should specify same coefficient as in results 'res'
resLFC <- lfcShrink(dds,coef = 2,res=res)

plotMA(resLFC, ylim=c(-5,5))
对这部分的知识还不理解,建议去看参考答案的解析。
- 绘制其中一个差异基因在两个分组的表达量boxplot并且添加统计学显著性指标
- 通过org.Hs.eg.db包拿到RNAseq_expr所有基因的染色体信息,绘制染色体的基因数量条形图
- 在上面染色体的基因数量条形图并列叠加差异基因数量条形图
- 在oncolnc网页工具拿到GUL5基因在BRCA数据集的表达量及病人生存资料自行本地绘制生存分析图
- 在xena网页工具拿到GUL5基因在BRCA数据集的表达量及病人的PAM50分类并且绘制分类的boxplot


