R可视化21|30个基础统计图绘制原理+使用场景+code
介绍30个基础统计图绘制原理+使用场景+code
1-22图基于R语言graphics包
1、直方图(Histogram)
2、箱线图(Box Plot 或 Box-and-Whisker Plot)
3、条形图(Bar plot)
4、散点图(scatter plot)
5、关联图(Cohen-Friendly Association Plot)
6、条件密度图(Conditional Density Plot)
7、等高图(Contour Plot)和等高线(Contour Line)
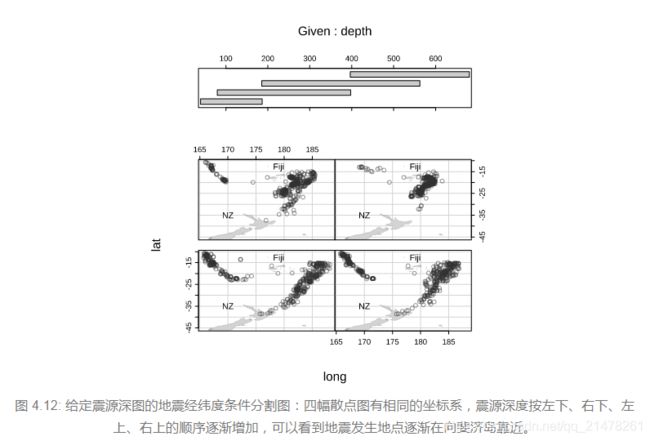
8、条件分割图(Conditioning Plot)
9、一元函数曲线图
10、点图 (Cleveland)
11、颜色等高图/层次图(Level Plot)
12、颜色图(Color Image)
13、 矩阵图、矩阵点、矩阵线
14、马赛克图(Mosaic Plots)
15、棘状图(Spine Plot/Spinogram)
16、散点图矩阵(Scatterplot Matrices)
17、三维透视图(Perspective Plot)
18、坐标轴须图(Rug)
19、平滑散点图
20、向日葵散点图(Sunflower Scatter Plot)
21、符号图(symbol plot)
22、饼图(pie)
23-30图基于一些扩展包
23、热图(heatmap)
24、交互效应图(interaction plot)
25、QQ图(Quantile-Quantile Plots)
26、生存函数图(survival plot)
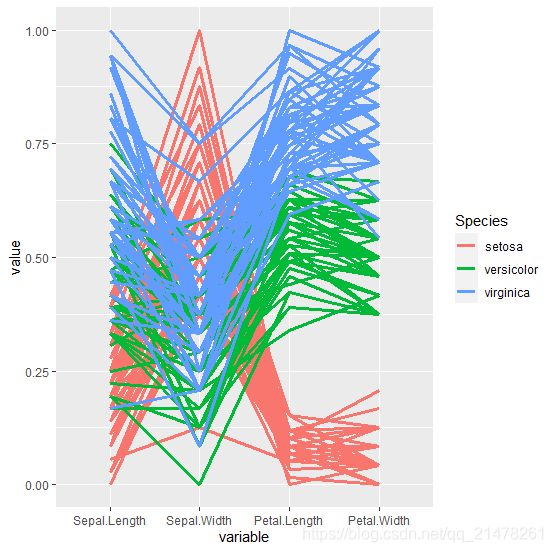
27、分类与回归树图(Classification and Regression Tree)
28、小提琴图(Violin Plot)
29、脸谱图(face)
30、平行坐标图
1、直方图(Histogram)
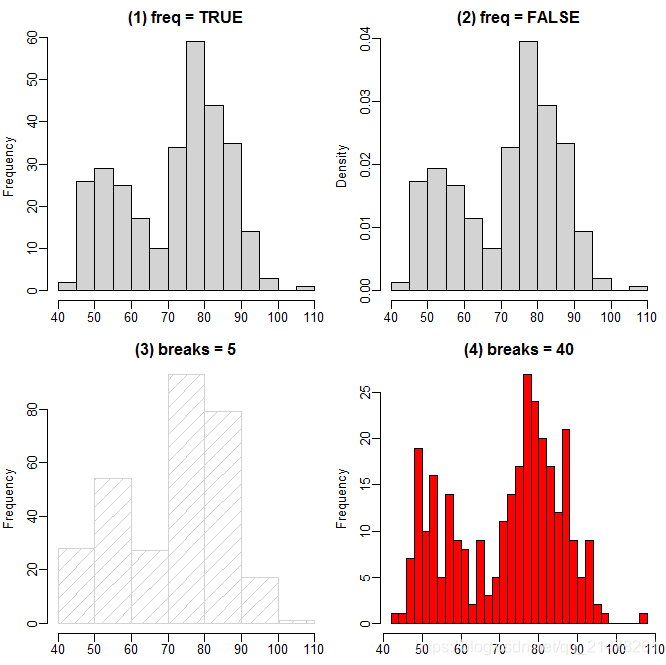
展示连续数据的分布,本质上是对密度函数的一种估计。
R 中提供了 hist() 函数。
用法如下,深究请随意。
> library(formatR)
> usage(hist.default)
## Default S3 method:
hist(x, breaks = "Sturges", #breaks 决定了柱子的个数
freq = NULL, probability = !freq,
    include.lowest = TRUE, right = TRUE, density = NULL, angle = 45,
    col = "lightgray", border = NULL, main = paste("Histogram of", xname),
    xlim = range(breaks), ylim = NULL, xlab = xname, ylab, axes = TRUE,
    plot = TRUE, labels = FALSE, nclass = NULL, warn.unused = TRUE, ...)
eg,
par(mfrow = c(2, 2), mar = c(2, 3, 2, .5), mgp = c(2, .5, 0))
data(geyser, package = "MASS")
hist(geyser$waiting, main = "(1) freq = TRUE", xlab = "waiting")
hist(geyser$waiting, freq = FALSE, xlab = "waiting", main = "(2) freq = FALSE")
hist(geyser$waiting, breaks = 5, density = 10, xlab = "waiting", main = "(3) breaks = 5")
hist(geyser$waiting, breaks = 40, col = "red", xlab = "waiting", main = "(4) breaks = 40")
2、箱线图(Box Plot 或 Box-and-Whisker Plot)
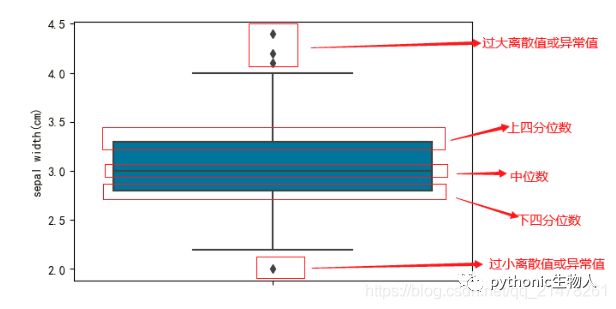
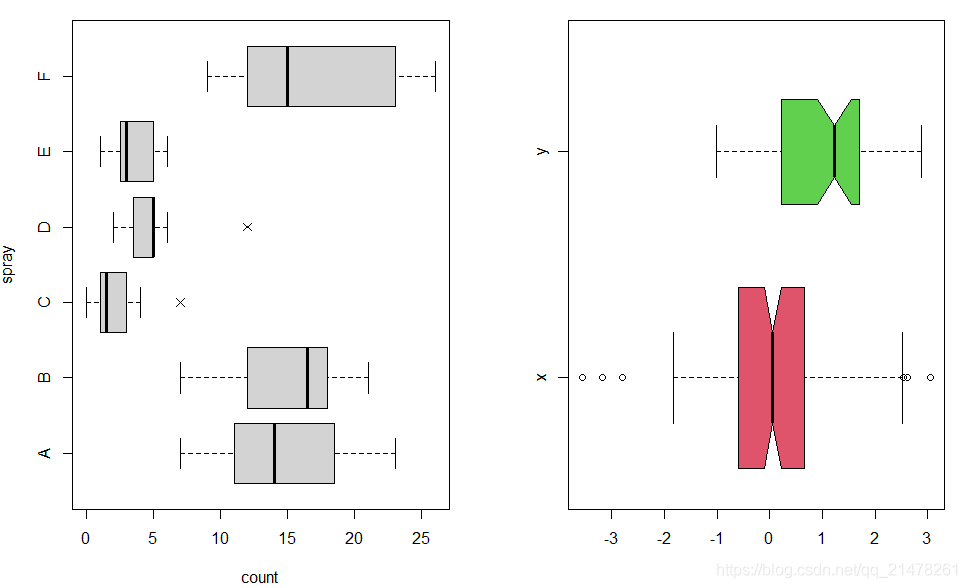
从四分位数的角度出发描述数据的分布,它通过最大值(Q4)、上四分位数(Q3)、中位数(Q2)、下四分位数(Q1)和最小值(Q0)五处位置来获取一维数据的分布概况。通过每一段数据占据的长度,我们可以大致推断出数据的集中或离散趋势(长度越短,说明数据在该区间上越密集,反之则稀疏)。
Python版参考:Python可视化17seborn-箱图boxplot
R 中相应的函数为 boxplot()函数,用法如下。
> usage(boxplot.default)
## Default S3 method:
boxplot(x, ..., range = 1.5, width = NULL, varwidth = FALSE, notch = FALSE,
    outline = TRUE, names, plot = TRUE, border = par("fg"),
    col = "lightgray", log = "",
    pars = list(boxwex = 0.8, staplewex = 0.5, outwex = 0.5), ann = !add,
    horizontal = FALSE, add = FALSE, at = NULL)
简单例子
par(mfrow = c(1, 2))
boxplot(count ~ spray, data = InsectSprays,
        col = "lightgray", horizontal = TRUE, pch = 4)

x <- rnorm(150)
y <- rnorm(50, 0.8)
boxplot(list(x, y),
  names = c("x", "y"), horizontal = TRUE,
  col = 2:3, notch = TRUE, varwidth = TRUE
)
3、条形图(Bar plot)
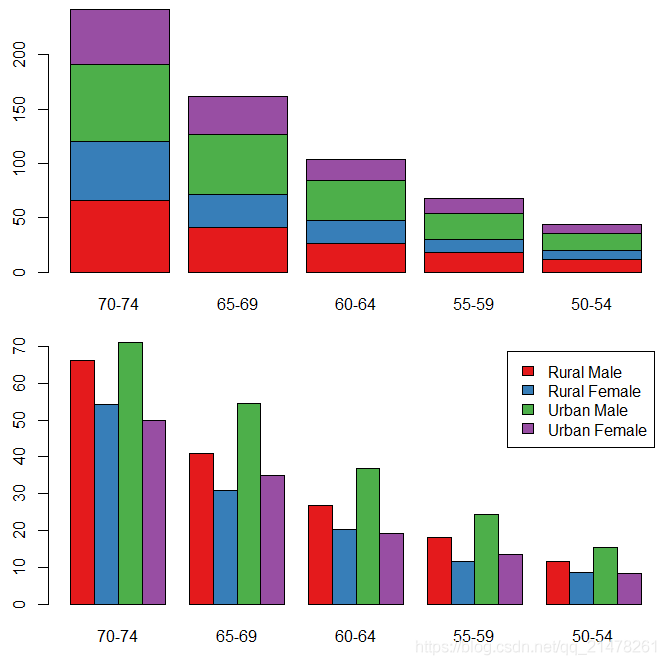
以矩形条的长度展示原始数值,对数据没有任何概括或推断。
R 中使用 barplot()函数,用法如下:
> usage(barplot.default)
## Default S3 method:
barplot(height, width = 1, space = NULL, names.arg = NULL,
    legend.text = NULL, beside = FALSE, horiz = FALSE, density = NULL,
    angle = 45, col = NULL, border = par("fg"), main = NULL, sub = NULL,
    xlab = NULL, ylab = NULL, xlim = NULL, ylim = NULL, xpd = TRUE, log = "",
    axes = TRUE, axisnames = TRUE, cex.axis = par("cex.axis"),
    cex.names = par("cex.axis"), inside = TRUE, plot = TRUE, axis.lty = 0,
    offset = 0, add = FALSE, ann = !add && par("ann"), args.legend = NULL,
    ...)
eg,
library(RColorBrewer) # 用分类调色板
par(mfrow = c(2, 1), mar = c(3, 2.5, 0.5, 0.1))
death <- t(VADeaths)[, 5:1]
barplot(death, col = brewer.pal(4, "Set1"))
barplot(death,
  col = brewer.pal(4, "Set1"), beside = TRUE,
  legend.text = TRUE
)
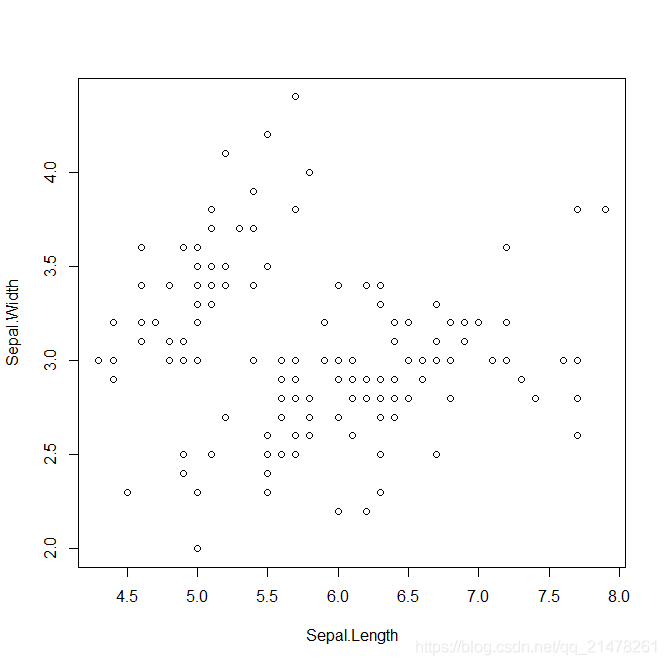
4、散点图(scatter plot)
展示两个变量之间的关系,这种关系可能是线性或非线性的。图中每一个点的横纵坐标都分别对应两个变量各自的观测值,因此散点所反映出来的趋势也就是两个变量之间的关系。
R 中使用 plot.default()函数,用法如下。
> usage(plot.default)
## Default S3 method:
plot(x, y = NULL, type = "p", xlim = NULL, ylim = NULL, log = "",
    main = NULL, sub = NULL, xlab = NULL, ylab = NULL, ann = par("ann"),
    axes = TRUE, frame.plot = axes, panel.first = NULL, panel.last = NULL,
    asp = NA, xgap.axis = NA, ygap.axis = NA, ...)
eg,
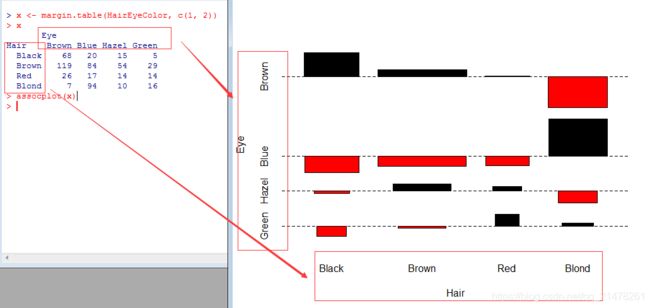
plot(iris$Sepal.Length,iris$Sepal.Width,xlab = 'Sepal.Length', ylab = 'Sepal.Width')5、关联图(Cohen-Friendly Association Plot)
展示二维列联表数据的一种工具,它主要是基于列联表的独立性检验理论(Pearson χ2χ2 检验)生成的图形。
R 中使用assocplot() 函数,用法如下。
> library(formatR)
> usage(assocplot)
assocplot(x, col = c("black", "red"), space = 0.3, main = NULL, xlab = NULL,
    ylab = NULL)
eg,
x <- margin.table(HairEyeColor, c(1, 2))
assocplot(x)
6、条件密度图(Conditional Density Plot)
展示的是一个变量的条件密度,即一个分类变量 YY 相对一个连续变量 XX 的条件密度 P(Y|X)P(Y|X) 。
R 中使用cdplot()函数,基于密度函数 density() 完成条件密度的计算 (Hofmann and Theus 2005),其用法如下。
> usage(graphics:::cdplot.default)
## Default S3 method:
cdplot(x, y, plot = TRUE, tol.ylab = 0.05, ylevels = NULL, bw = "nrd0",
    n = 512, from = NULL, to = NULL, col = NULL, border = 1, main = "",
    xlab = NULL, ylab = NULL, yaxlabels = NULL, xlim = NULL, ylim = c(0, 1),
    ...)
eg,
demo("cdplotDemo", package = "MSG")

fail <-  factor(
  c(2, 2, 2, 2, 1, 1, 1, 1, 1, 1, 2, 1,
    2, 1, 1, 1, 1, 2, 1, 1, 1, 1, 1),
  levels = 2:1,
  labels = c("yes", "no")
)
temperature = c(53, 57, 58, 63, 66, 67, 67, 67, 68, 69, 70,
  70, 70, 70, 72, 73, 75, 75, 76, 76, 78, 79, 81
)
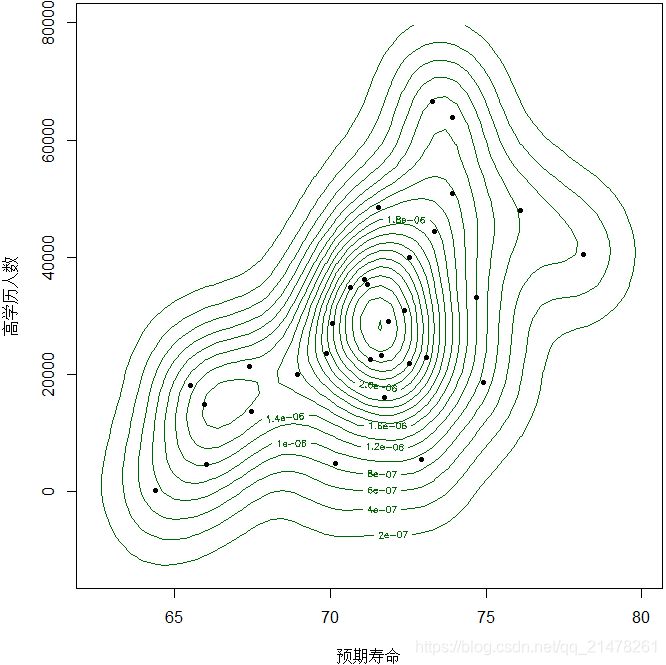
7、等高图(Contour Plot)和等高线(Contour Line)
一种以二维形式展示三维数据的工具。
R 中使用contour()函数,同时 grDevices 包中也提供了contourLines()函数,用法分别如下:
函数使用方法查询类似前文,不再赘述。
eg,
par(mar = c(4, 4, 0.2, 0.2))
library(MSG)
data(ChinaLifeEdu)
x <- ChinaLifeEdu
library(KernSmooth)
est <- bkde2D(x, apply(x, 2, dpik))
contour(est$x1, est$x2, est$fhat,
  nlevels = 15, col = "darkgreen",
  vfont = c("sans serif", "plain"),
  xlab = "预期寿命",
  ylab = "高学历人数"
)
points(x, pch = 20)


est_tidy <- data.frame(
  life = rep(est$x1, length(est$x2)),
  edu = rep(est$x2, each = length(est$x1)),
  z = as.vector(est$fhat)
)
揭示的现象是:中国 31 省市自治区在人口预期寿命和高学历人口数量上呈现出聚类的特征,图中密度值大的区域主要有中部、右上和左下三个,东中西格局比较明显,即:东部地区分布在图中右上角,中部省市分布在图中中部,西部地区集中在图中的左下角。
8、条件分割图(Conditioning Plot)
给定某一个(或几个)变量之后看我们所关心的变量的分布情况。在条件分割图中,这种“分布”主要指的是两个变量之间的关系,通常以散点图表示。
eg,
par(mar = rep(0, 4), mgp = c(2, .5, 0))
library(maps)
coplot(lat ~ long | depth,
  data = quakes, number = 4,
  ylim = c(-45, -10.72), panel = function(x, y, ...) {
    map("world2",
      regions = c("New Zealand", "Fiji"),
      add = TRUE, lwd = 0.1, fill = TRUE, col = "lightgray"
    )
    text(180, -13, "Fiji", adj = 1)
    text(170, -35, "NZ")
    points(x, y, col = rgb(0.2, 0.2, 0.2, .5))
  }
)
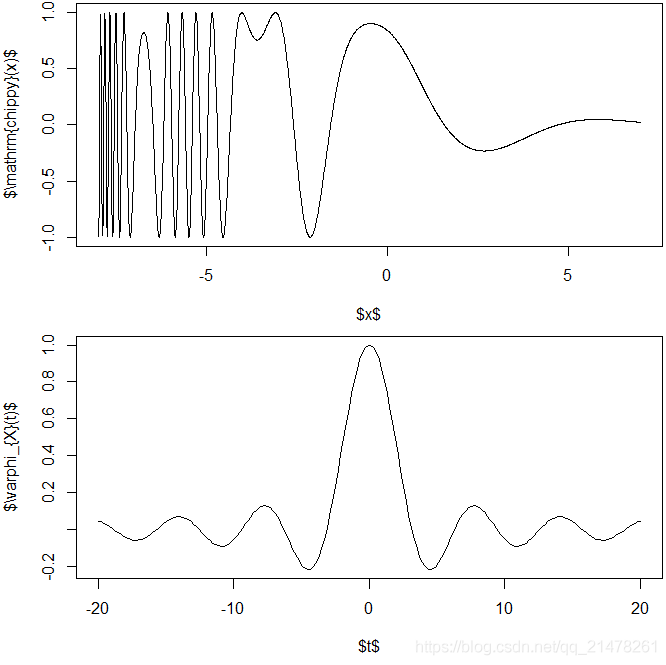
9、一元函数曲线图
par(par(mar = c(4.5, 4, 0.2, 0.2)), mfrow = c(2, 1))
chippy <- function(x) sin(cos(x) * exp(-x / 2))
curve(chippy, -8, 7, n = 2008, xlab = "$x$", ylab = "$\\mathrm{chippy}(x)$")
curve(sin(x) / x, from = -20, to = 20, n = 200,
      xlab = "$t$", ylab = "$\\varphi_{X}(t)$")
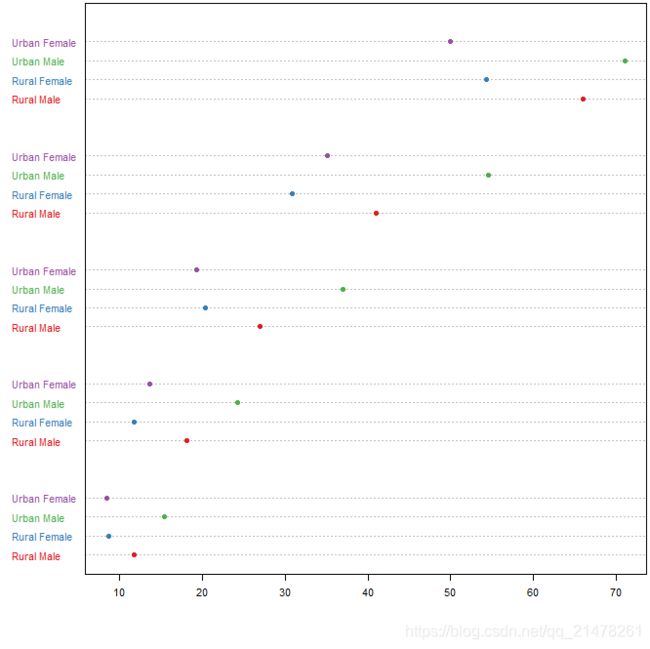
10、点图 (Cleveland)
点图和条形图的功能非常类似:条形图通过条的长度表示数值大小,点图通过点的位置表示数值大小,二者几乎可以在任何情况下互换。
R中使用dotchart()函数。
eg,
library(RColorBrewer)
par(mar = c(4, 4, 0.2, 0.2))
dotchart(t(VADeaths)[, 5:1], col = brewer.pal(4, "Set1"), pch = 19, cex = .65)
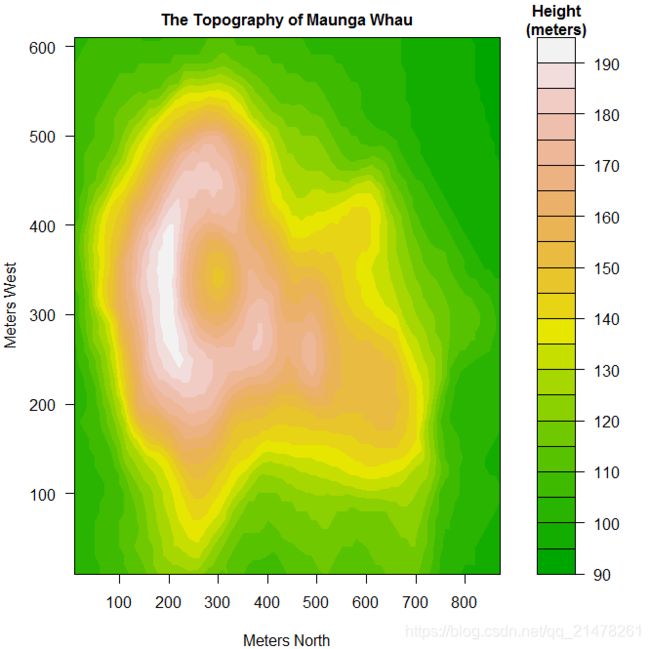
11、颜色等高图/层次图(Level Plot)
用不同颜色表示不同高度,并配有颜色图例,用以说明图中的颜色与高度值的对应关系。
R中使用filled.contour()函数。
eg,
par(mar = c(4, 4, 2, 2), cex.main = 1)
x = 10 * 1:nrow(volcano)
y = 10 * 1:ncol(volcano)
filled.contour(x, y, volcano,
   color = terrain.colors,
   plot.title = title(
     main = "The Topography of Maunga Whau",
     xlab = "Meters North", ylab = "Meters West"
   ),
   plot.axes = {
     axis(1, seq(100, 800, by = 100))
     axis(2, seq(100, 600, by = 100))
   },
   key.title = title(main = "Height\n(meters)"),
   key.axes = axis(4, seq(90, 190, by = 10))
 )
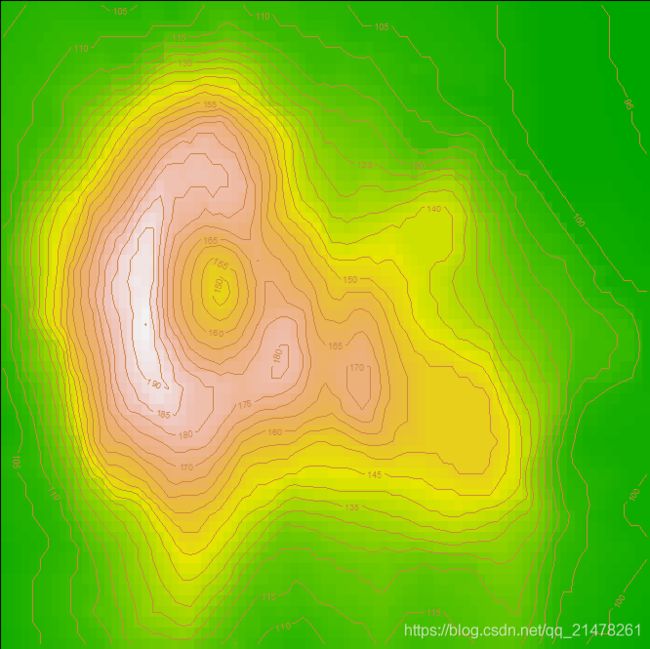
12、颜色图(Color Image)
与颜色等高图看起来非常类似,但是等高图需要从网格矩阵中计算等高的数据点,有时还需要一些平滑处理,而颜色图并不涉及任何背后的计算,只是简单将一个网格矩阵映射到指定的颜色序列上、以颜色方块表示数据的大小。
R 中使用image()函数.
eg,
par(mar = rep(0, 4), ann = FALSE)
x <- 10 * (1:nrow(volcano))
y <- 10 * (1:ncol(volcano))
image(x, y, volcano, col = terrain.colors(100), axes = FALSE)
contour(x, y, volcano,
  levels = seq(90, 200, by = 5),
  add = TRUE, col = "peru"
)
box()
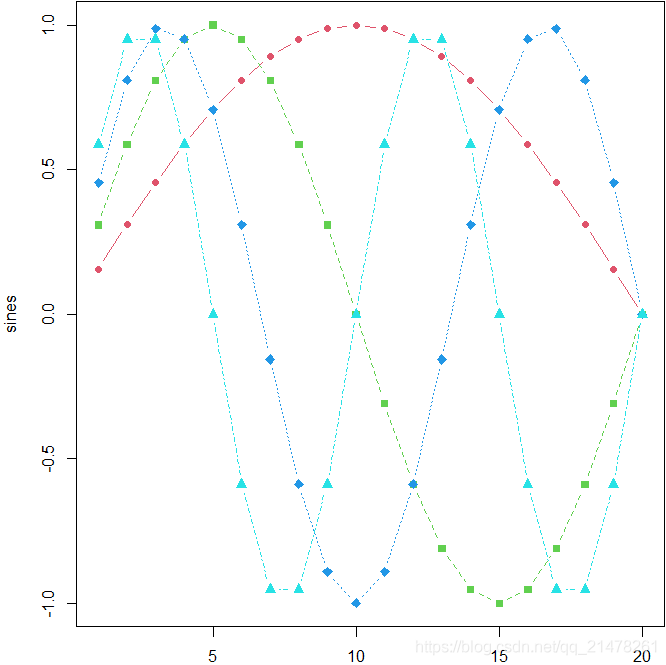
13、 矩阵图、矩阵点、矩阵线
R 中矩阵图的函数为 matplot(),矩阵点的函数为 matpoints(),矩阵线的函数为 matlines()。
eg,
sines <- outer(1:20, 1:4, function(x, y) sin(x / 20 * pi * y))
par(mar = c(2, 4, .1, .1))
matplot(sines, type = "b", pch = 21:24, col = 2:5, bg = 2:5)
14、马赛克图(Mosaic Plots)
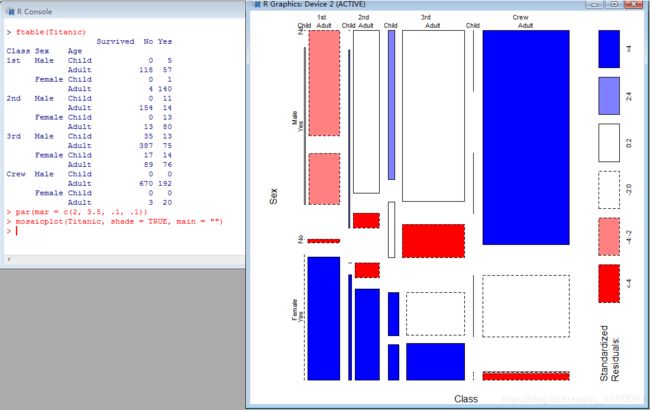
展示多维列联表数据的工具,R使用mosaicplot()函数。
eg,
par(mar = c(2, 3.5, .1, .1))
mosaicplot(Titanic, shade = TRUE, main = "")
使用右图展示左边4×2×2×24×2×2×2 的列联表数据。
通过矩形块(马赛克)的大小,我们可以清楚看出各舱位、不同性别、年龄的人群的生还状况。例如,对头等舱来说,无论是大人小孩或男女,下方的矩形都比上方的矩形要高(尤其是女性和小孩),这说明头等舱的生还率相对来说都比较高,很可能当时的救援是偏向头等舱的;从年龄来说,头等舱和二等舱中小孩的生存率要远高于大人,但三等舱中小孩的生存率和大人相比差异并不是太显著;但从性别角度来看,各舱位基本上还是将生存机会优先让给女性了,男性的生还率在各舱位来说都相对较低。类似地,我们还可以从图中挖掘出更多的现象,这里不再深入。另外,图中用不同颜色表示出了个单元格的残差大小,其中虚线框表示残差为负数,我们可以清楚看出哪些单元格的拟合欠佳。
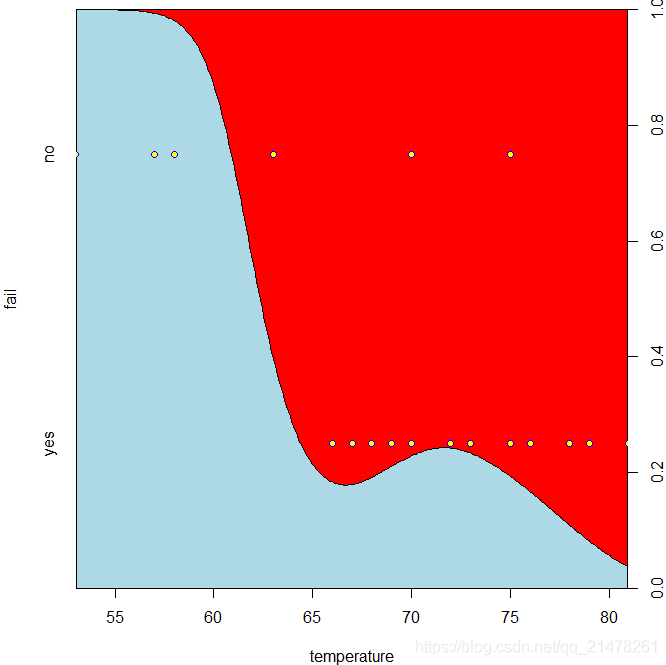
15、棘状图(Spine Plot/Spinogram)
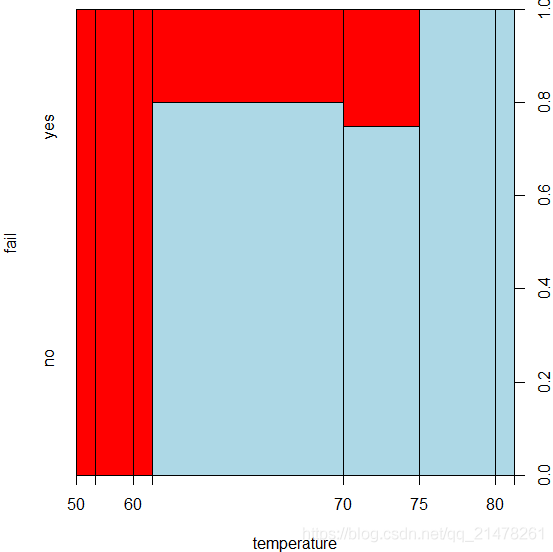
可以看作是马赛克图(前14图)的特例,也可以看作是堆砌条形图(前3图)的推广,展示了在给定某个自变量的情况下因变量的概率分布,但是棘状图首先对连续型的自变量进行了离散化处理,然后在离散的区间内计算因变量的条件分布
R中使用spineplot()函数。
eg,
fail <-  factor(
  c(2, 2, 2, 2, 1, 1, 1, 1, 1, 1, 2, 1,
    2, 1, 1, 1, 1, 2, 1, 1, 1, 1, 1),
  levels = 2:1,
  labels = c("yes", "no")
)
temperature = c(53, 57, 58, 63, 66, 67, 67, 67, 68, 69, 70,
  70, 70, 70, 72, 73, 75, 75, 76, 76, 78, 79, 81
)
fail_temperature <- data.frame(fail = fail, temperature = temperature)
par(mar = c(4, 4, .5, 2))
t(x <- spineplot(fail ~ temperature, col = c("lightblue", "red")))
16、散点图矩阵(Scatterplot Matrices)
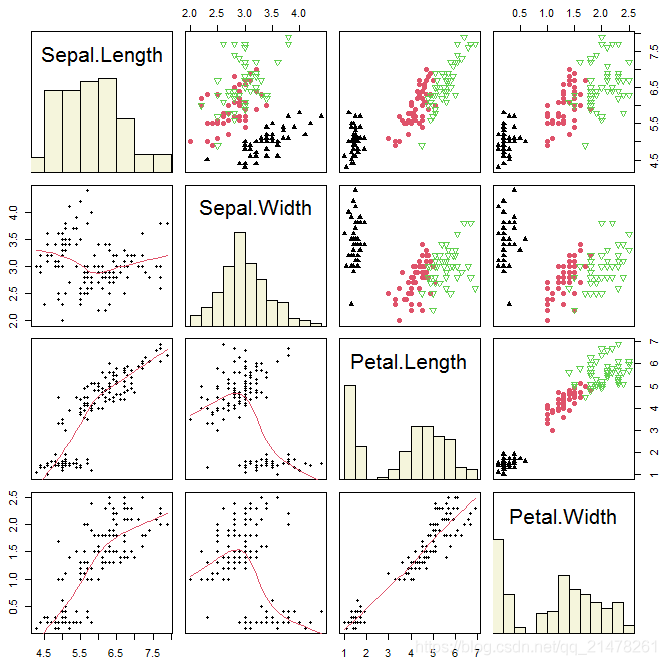
将多个变量的两两散点图以矩阵的形式排列起来, 查看变量之间的两两关系非常有用。
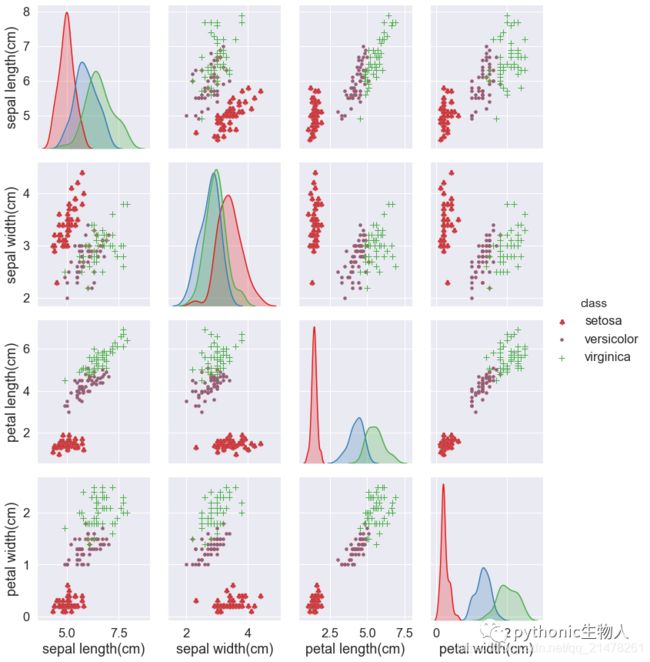
Python的Seaborn非常容易绘制矩阵散点图:Python可视化25|seaborn绘制矩阵图
R中使用pairs() 函数。
eg,
# 观察如何使用 hist() 做计算并用 rect() 画图
panel.hist <- function(x, ...) {
  usr <- par("usr")
  on.exit(par(usr))
  par(usr = c(usr[1:2], 0, 1.5))
  h <- hist(x, plot = FALSE)
  nB <- length(breaks <- h$breaks)
  y <- h$counts / max(h$counts)
  rect(breaks[-nB], 0, breaks[-1], y, col = "beige")
}

idx <- as.integer(iris[["Species"]])
pairs(iris[1:4],
      upper.panel = function(x, y, ...)
        points(x, y, pch = c(17, 16, 6)[idx], col = idx),
      pch = 20, oma = c(2, 2, 2, 2),
      lower.panel = panel.smooth, diag.panel = panel.hist
)
说实话,效果还不错,不过Python seaborn会更惊艳。
17、三维透视图(Perspective Plot)
R中使用persp()函数。更好的选择scatterplot3d 。
eg,
library(scatterplot3d)
data(trees)
s3d <- scatterplot3d(trees, type = "h", color = "blue",
angle = 55, scale.y = 0.7, pch = 16, main = "Adding elements")
my.lm <- lm(trees$Volume ~ trees$Girth + trees$Height)
s3d$plane3d(my.lm)
s3d$points3d(seq(10, 20, 2), seq(85, 60, -5), seq(60, 10, -10),
col = "red", type = "h", pch = 8)
其他例子如,
18、坐标轴须图(Rug)
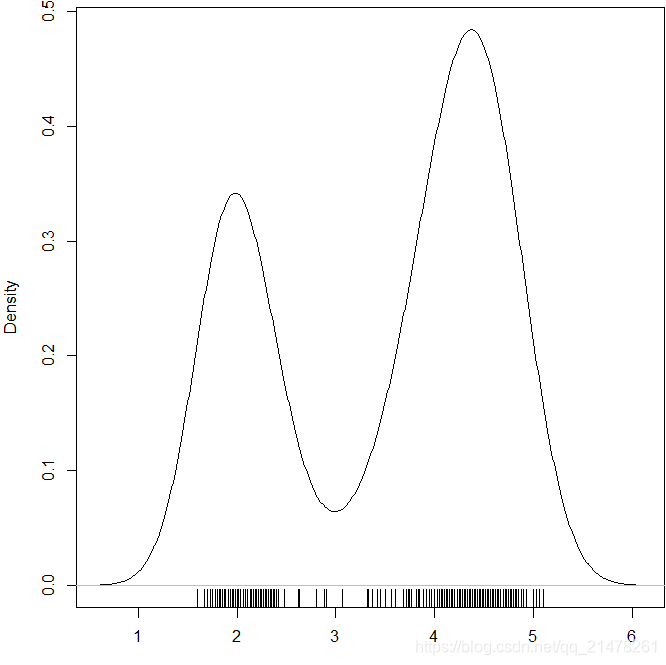
该图往坐标轴上添加短须,短须的作用是标示出相应坐标轴上的变量数值的具体位置,每一根短须都对应着一个数据。这样做的好处在于,我们可以从坐标轴须的分布了解到该变量的分布,尤其是当我们使用那些带有汇总性质的图形(如箱线图)时,我们会失去原始数据的位置,得到的只是一幅展示综合统计量的图形。坐标轴须与一些统计图形的结合会让图形表达的信息更丰富,图形的使用者也可以自由选择看图的侧重点。
R中使用rug()函数。
eg,
par(mar = c(3, 4, 0.4, 0.1))
plot(density(faithful$eruptions), main = "")
rug(faithful$eruptions)
19、平滑散点图
用特定颜色深浅表示某个位置的密度值大小,默认颜色越深说明二维密度值越大,即该处数据点越密集。
R自带smoothScatter函数,不过太丑了,推荐ggpointdensity。
library(ggplot2)
library(ggpointdensity)
ggplot(data = BinormCircle, aes(x = V1, y = V2)) +
+   geom_pointdensity(adjust = 0.1)
20、向日葵散点图(Sunflower Scatter Plot)
克服散点图中数据点重叠问题,在有重叠的地方用一朵“向日葵花”的花瓣数目来表示重叠数据的个数,在数据特别密集或者数据类型为分类数据时很有用。
R中使用sunflowerplot()函数。
eg,注意两图比较。
par(mfrow = c(2, 1), mar = c(3, 2.5, 0.5, 0.1))
sunflowerplot(iris[, 3:4], col = "green", seg.col = "red")
plot(iris$Petal.Length,iris$Petal.Width,xlab='Petal.Length',ylab='Petal.Width')
21、符号图(symbol plot)
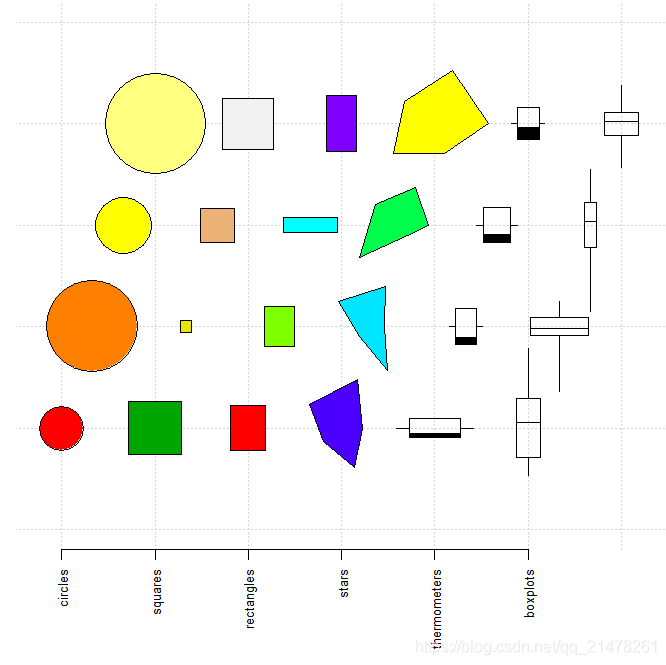
为散点图的扩张,将高于二维的数据“寄托”在符号的各种特征上,如:以矩形为散点图的基本符号,那么我们可以用其长宽分别代表两个变量,这样一幅图形中至少可以放置四个变量。
R中使用symbols()函数,它提供了六种基本符号:圆、正方形、长方形、星形、温度计和箱线图。
demo("symbols_all", echo = FALSE, package = "MSG")eg,
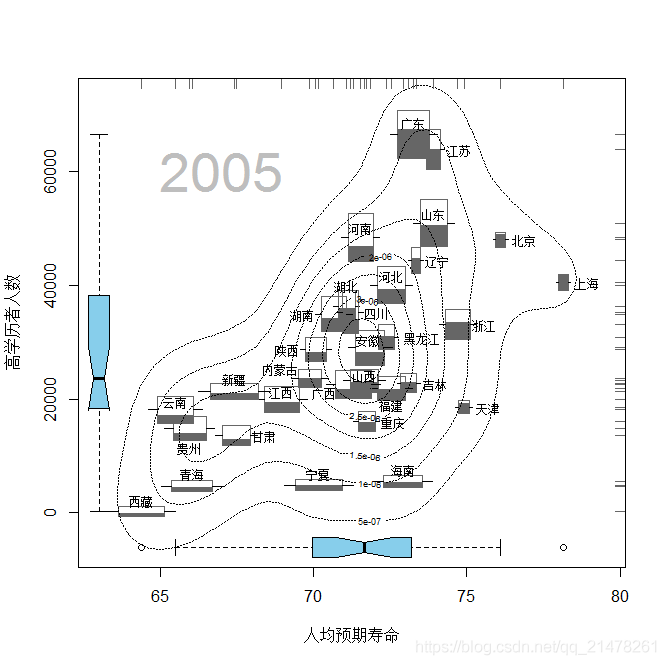
demo("ChinaPop", package = "MSG")(谢益辉 2008a) 绘制了一个描绘五维变量(增长率、总人口、城镇人口比重、预期寿命、高学历人数)的demo。经过这些图形元素的表达,全国 31 省市自治区的五项人口特征便一目了然,
例如通过温度计的高度可以观察出三个人口大省广东、山东、河南(相应的人口总量小的地区如西藏、青海、宁夏等也容易看出),由宽度可以看出西藏、青海、宁夏、新疆等省市自治区的人口自然增长率非常高(而北京、上海、天津等直辖市的增长率则很低),从温度指示的情况来看,北京、上海和天津三大直辖市的城镇人口比例要远高于其它地区;
箱线图和坐标轴须分别刻画了人口平均预期寿命与高学历者人数各自的分布特征。
22、饼图(pie)
饼图并无散点图和条形图直观,一般不建议使用。
eg,
layout(matrix(c(1, 2, 1, 3), 2)) # 拆分作图区域
par(mar = c(4, 4, 0.2, 0.2))
pie.sales <- c(0.12, 0.3, 0.26, 0.16, 0.04, 0.12)
names(pie.sales) <- c("Blueberry", "Cherry", "Apple",
                      "Boston Cream", "Other", "Vanilla Cream")
pie.col <- c("purple", "violetred1", "green3", "cornflowerblue", "cyan", "white")
pie.sales <- sort(pie.sales, decreasing = TRUE) # 排序有助于可读性
pie(pie.sales, col = pie.col)
dotchart(pie.sales, xlim = c(0, 0.3))
barplot(pie.sales, col = pie.col, horiz = TRUE, names.arg = "", space = 0.5)
23、热图(heatmap)
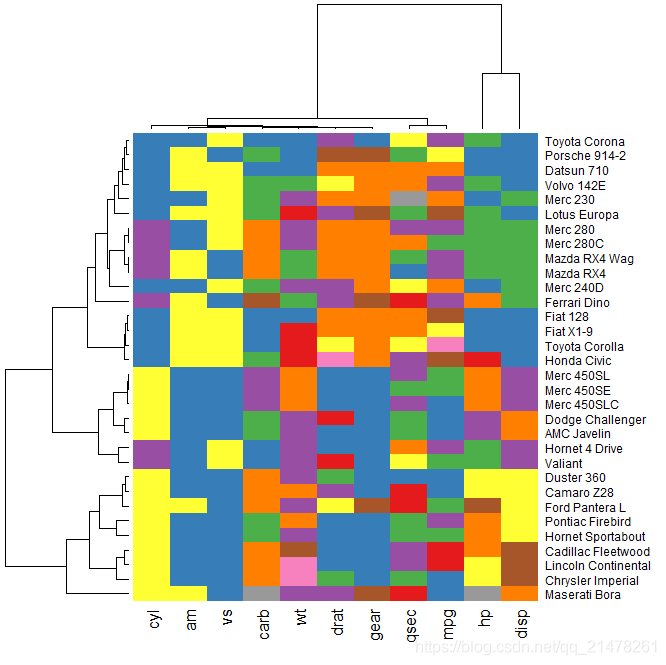
- 上文介绍的颜色图经过聚类而得。
- 将一个矩阵中单元格数值用颜色表达,颜色深浅表达数值大小;
- 对矩阵的行或列进行层次聚类,将行或列以聚类的顺序排列,并在颜色图的边界区域加上聚类的谱系图,不仅可以直接观察矩阵中的数值分布状况,也可以立即知道聚类的结果。
R 中热图函数为 stats 包中的 heatmap()函数。
eg,
library(RColorBrewer)
heatmap(as.matrix(mtcars), col = brewer.pal(9, "Set1"),
        scale = "column", margins = c(4, 8))
24、交互效应图(interaction plot)
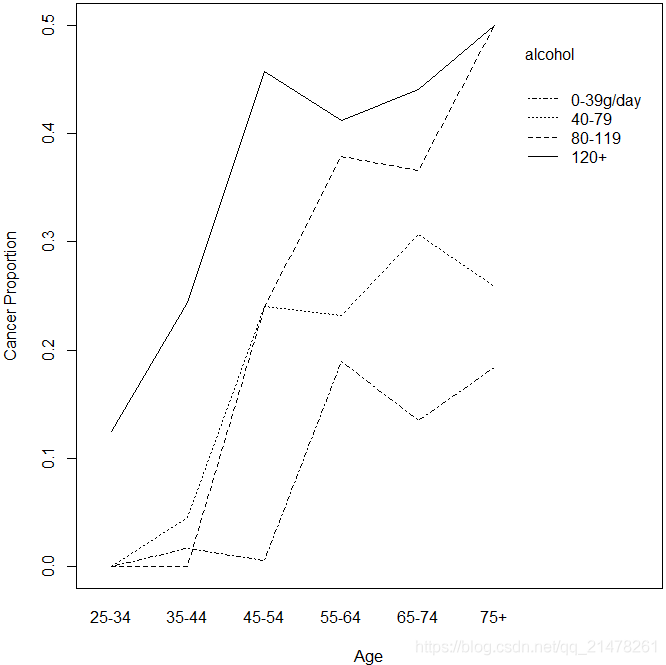
在回归模型或方差分析中常用,就是一个自变量对因变量的影响大小受另一个变量取值水平的影响。
par(mar = c(4, 4, 0.2, 0.2))
with(esoph, {
  interaction.plot(agegp, alcgp, ncases / (ncases + ncontrols), trace.label = "alcohol",
                   fixed = TRUE, xlab = "Age", ylab = "Cancer Proportion")
  # 方差分析,交互项系数不显著
  summary(aov(ncases / (ncases + ncontrols) ~ agegp * alcgp))
})
交互项的 P 值大于 0.05, 说明交互项基本上可以忽略。
25、QQ图(Quantile-Quantile Plots)
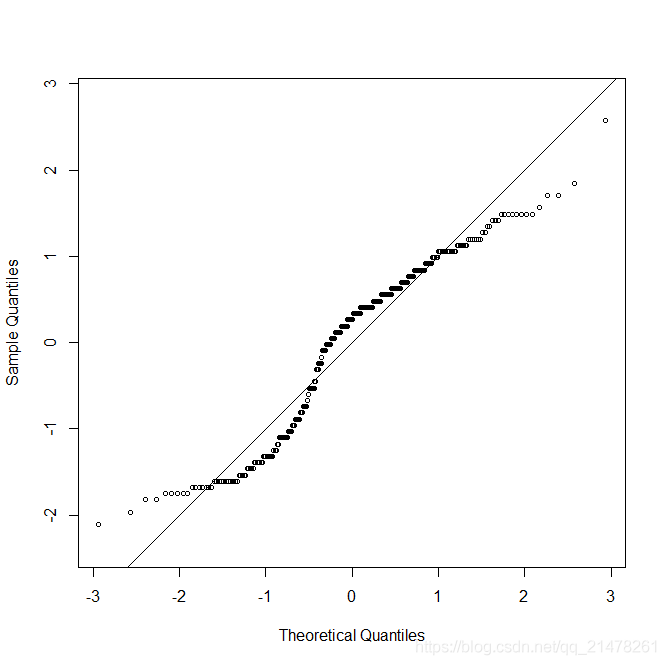
检查数据是否服从某种分布。 n个散点绘制的散点图如果大致排列在对角线上,则服从某种分布。
R中QQ图为 qqplot()函数 ,正态分布 QQ 图为qqnorm()函数 。
eg,
data(geyser, package = "MASS")
x <- scale(geyser$waiting)
qqnorm(x, cex = 0.7, asp = 1, main = "")
abline(0, 1)
26、生存函数图(survival plot)
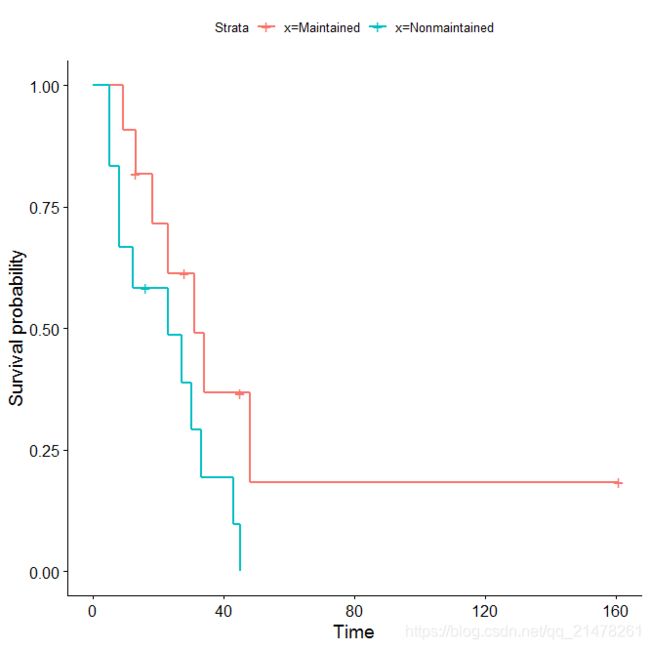
研究某种事件发生的时间,医学和金融研究中常使用。被研究的数据一般统称为生存数据(survival data),而生存数据通常有一个特征就是删失,即观测对象因为某种原因退出了我们的观察。
eg,
library(survival)
leukemia.surv <- survfit(Surv(time, status) ~ x, data = aml)
plot(leukemia.surv, lty = 1:2, xlab = "time")
legend("topright", c("Maintenance", "No Maintenance"), lty = 1:2, bty = "n")
survminer::ggsurvplot(leukemia.surv, data = aml)
展示了急性髓细胞白血病(Acute Myelogenous Leukemia)数据
aml的生存函数图,从图中可以看出,接受化疗的病人生存函数的下降速度比没接受化疗的病人要慢,表明化疗还是有一定作用的。
27、分类与回归树图(Classification and Regression Tree)
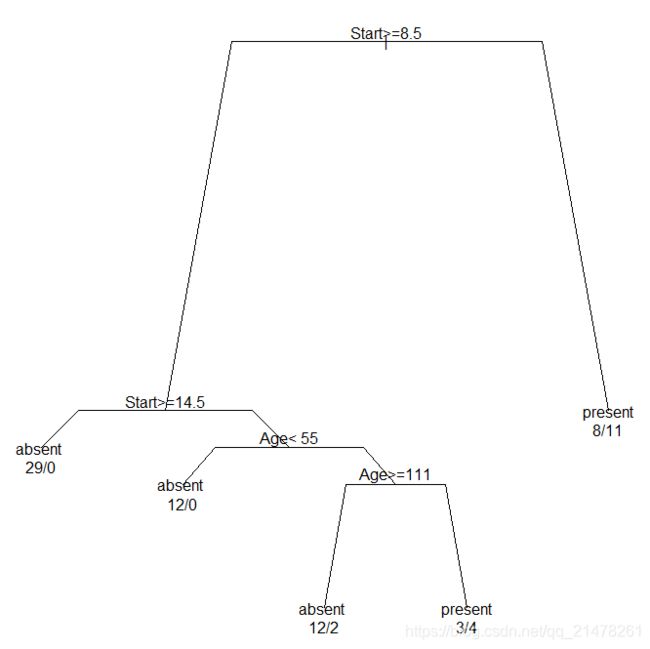
是一种递归分割(Recursive Partition)技术,目的是寻找自变量的某种分割,使得样本分割之后因变量各组之间的差异最大,这种分割会一直递归进行下去,直到满足停止条件。
eg,
library(rpart)
fit <- rpart(Kyphosis ~ Age + Number + Start, data = kyphosis)
par(mar = rep(1, 4), xpd = TRUE)
plot(fit, branch = 0.7)
text(fit, use.n = TRUE, digits = 7)#每个分支添加文本
28、小提琴图(Violin Plot)
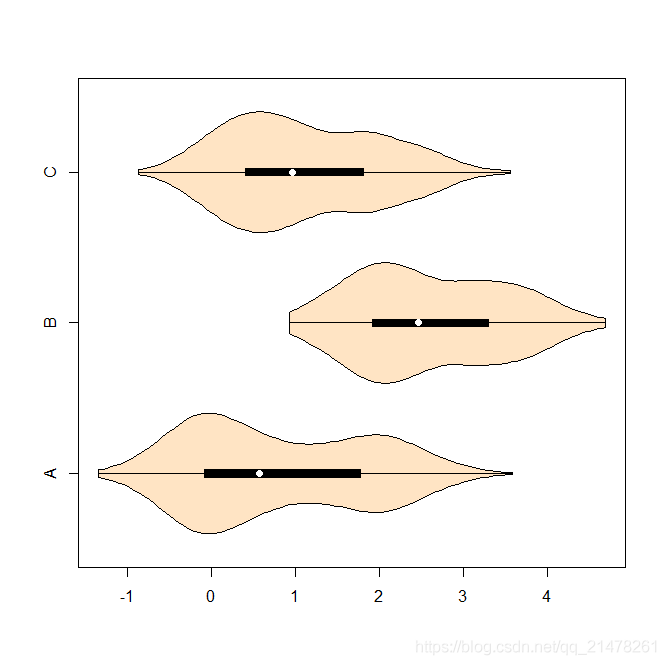
密度曲线图与箱线图的结合,本质是利用密度值生成的多边形,但该多边形同时还沿着一条直线作了另一半对称的“镜像”,这样两个左右或上下对称的多边形拼起来就形成了小提琴图的主体部分,最后一个箱线图也会被添加在小提琴的中轴线上。
library(sm)
library(vioplot)

f <- function(mu1, mu2)
  c(rnorm(300, mu1, 0.5), rnorm(200, mu2, 0.5))
x1 <- f(0, 2)
x2 <- f(2, 3.5)
x3 <- f(0.5, 2)
vioplot(x1, x2, x3,
  horizontal = TRUE, col = "bisque",
  names = c("A", "B", "C")
)
29、脸谱图(face)
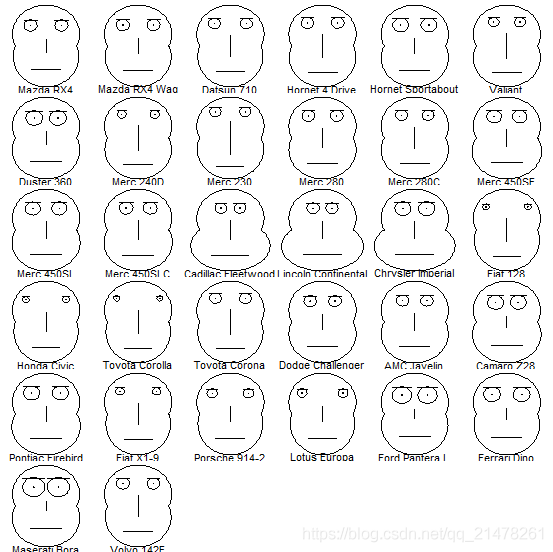
使用脸谱的具体特征(眼睛大小、鼻高等)反映数据的数值大小。
eg,
library(TeachingDemos)
faces2(mtcars[, c("hp", "disp", "mpg", "qsec", "wt")], #汽车数据 mtcars 5个变量:马力 hp、气缸排量 disp、每加仑行驶英里数 mpg、行驶 1/4 英里时间 qsec 和车重 wt
which = c(14, 9, 11, 6, 5)#用眼睛大小、嘴宽、眼距、鼻长和下半脸宽来表示5个变量大小
)
30、平行坐标图
坐标系下直接画出多个变量 。
平行坐标系的基本做法是将相互垂直的坐标轴改成平行的坐标轴,由于平面上可以容纳很多平行线,所以平行坐标系中可以放置多个变量。在每根坐标轴上,根据变量数值大小描点,如数值越大则点的位置越高,而对于一行观测数据,由于它有多列,每一列都相应对应着一根平行线上的点,最终我们把这些点用折线连起来,也就形成了构成平行坐标图的基本元素。类似地,多行数据就能描绘出多条折线,平行坐标图就是由这些折线加上相应的平行坐标轴构成的。
eg,
library(GGally)
ggparcoord(iris, columns = 1:4, groupColumn = 5, scale = "uniminmax") +
  geom_line(size = 1.2)
