机器学习sklearn(8)支持向量机svm——线性
支持向量机(Support Vector Machine, SVM)是一类按监督学习(supervised learning)方式对数据进行二元分类(binary classification)的广义线性分类器(generalized linear classifier),其决策边界是对学习样本求解的最大边距超平面(maximum-margin hyperplane)
优点:
- 解决高维特征的分类问题和回归问题很有效,在特征维度大于样本数时依然有很好的效果
- 仅仅使用一部分支持向量来做超平面的决策,无需依赖全部数据
- 有大量的核函数可以使用,从而可以很灵活的来解决各种非线性的分类回归问题
- 样本量不是海量数据的时候,分类准确率高,泛华能力强
缺点:
- 如果特征维度远远大于样本数,则SVM表现一般
- SVM在样本量非常大,核函数映射维度非常高时,计算量过大,不太适合使用
- 非线性问题的核函数的选择没有通用标准,难以选择一个合适的核函数
- SVM对缺失数据敏感
import pandas as pd
import numpy as np
from sklearn import svm
import matplotlib.pyplot as plt
%matplotlib inline
读取数据
path = r"C:\Users\Machine Learning\svm_testset.txt"
data_svm = pd.read_csv(path, header=None, sep='\t', encoding='ANSI')
print(data_svm.head())
          0         1  2
0  3.542485  1.977398 -1
1  3.018896  2.556416 -1
2  7.551510 -1.580030  1
3  2.114999 -0.004466 -1
4  8.127113  1.274372  1
分出特征向量和标签
data_svm = np.array(data_svm)
svm_data = data_svm[:,:-1]
svm_label = data_svm[:,-1]
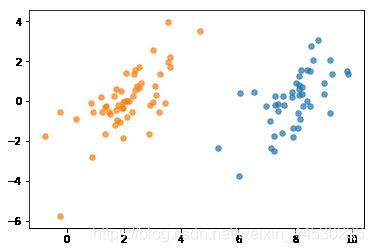
数据集可视化
plt.scatter(svm_data[svm_label==1,0], svm_data[svm_label==1,1], s=30, alpha=.7)
plt.scatter(svm_data[svm_label==-1,0], svm_data[svm_label==-1,1], s=30, alpha=.7)
plt.show()
训练模型
clf = svm.SVC(kernel='linear', gamma='scale')
clf.fit(svm_data, svm_label)
SVC(C=1.0, cache_size=200, class_weight=None, coef0=0.0,
  decision_function_shape='ovr', degree=3, gamma='scale', kernel='linear',
  max_iter=-1, probability=False, random_state=None, shrinking=True,
  tol=0.001, verbose=False)
clf.support_vectors_ #支持向量
array([[ 4.658191,  3.507396],
       [ 3.457096, -0.082216],
       [ 6.080573,  0.418886]])
clf.support_ #支持向量索引
array([17, 29, 55])clf.n_support_ #下方、上方支持向量个数
array([2, 1])clf.coef_ #系数
array([[ 0.81444269, -0.27274371]])clf.intercept_ #截距
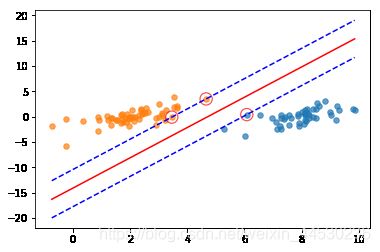
array([-3.83775658])#模型训练后得到的划分直线:clf.coef_[0,0]*x1 + clf.coef_[0,1]*x2 + clf.intercept_ = 0
a = -clf.coef_[0,0]/clf.coef_[0,1] #直线方程系数
b = -clf.intercept_/clf.coef_[0,1] #直线方程截距
#根据刚才所得到的支持向量来分别求得上下方直线截距
#三条直线平行,可得y_down=a*x+b_down, y_up= a*x+b_up,然后将这两条直线上的支持向量点带入方程即可求得b_down和b_up
X_down = clf.support_vectors_[0] #直线y_down上的支持向量
x_down = X_down[0]
y_down = X_down[1]
b_down = y_down - a*x_down #直线y_down截距
X_up = clf.support_vectors_[-1] #直线y_up上的支持向量
x_up = X_up[0]
y_up = X_up[1]
b_up = y_up - a*x_up #直线y_up截距
x_max = max(svm_data[:,0])
x_min = min(svm_data[:,0])
X = [x_min,x_max]
X = np.array(X)
X
array([-0.743036, 9.854303])Y = a*X + b
Y_up = a*X + b_up
Y_down = a*X + b_down
plt.scatter(svm_data[svm_label==1,0], svm_data[svm_label==1,1], s=30, alpha=.7)
plt.scatter(svm_data[svm_label==-1,0], svm_data[svm_label==-1,1], s=30, alpha=.7)
plt.scatter(clf.support_vectors_[:,0], clf.support_vectors_[:,1], s=150, c='none', alpha=0.7, linewidth=1.2, edgecolor='red')
plt.plot(X,Y,c='red')
plt.plot(X,Y_down,c='blue',linestyle='--')
plt.plot(X,Y_up,c='blue',linestyle='--')
plt.show()

