5.机器学习-pandas进阶
pandas画图
# dataFrame画图 plot
"""
kind:
line    折线图 默认
bar     柱状图
barh    横着的柱状图
[barh更多](https://pandas.pydata.org/pandas-docs/stable/reference/api/pandas.DataFrame.plot.barh.html)

hist    直方图
pie     饼图
scatter  散点图
"""

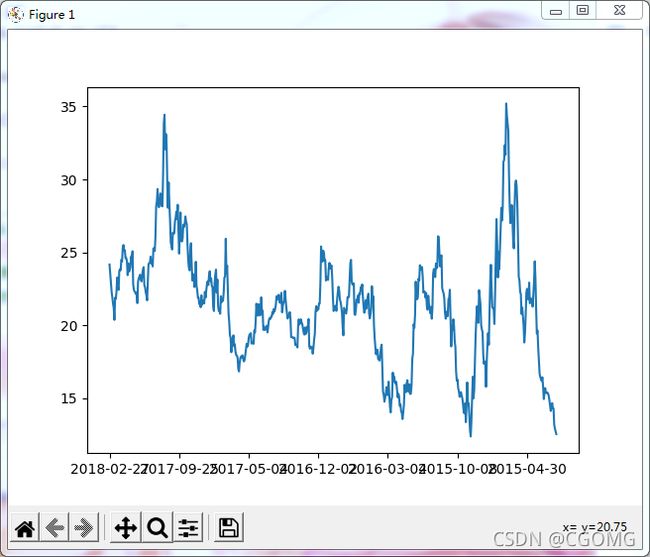
data.plot(kind="line")
plt.show()


# series 画图
data["close"].plot()
plt.show()
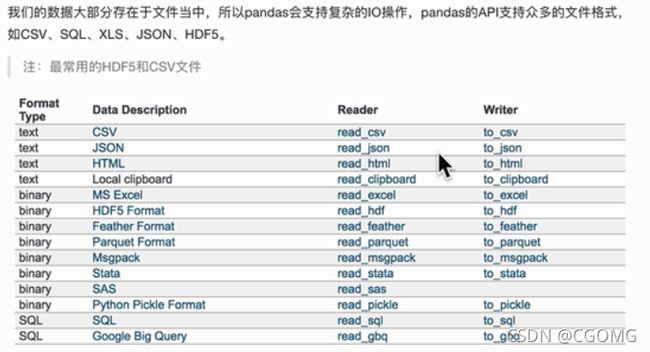
文件读取与存储
csv
"""
read_csv
filepath_or_buffer:文件路径
usecols:指定读取的列名,列表形式
"""

data = pd.read_csv(filepath_or_buffer="stock_day.csv", usecols=["close", "open"])
"""
to_csv
path_or_buf:    文件路径
sep:            分隔符,默认用“,”隔开
columns:        选择需要的列索引
header:         是否写进列索引值
index:          是否写进行索引
mode:           ‘w’重写 ‘a’追加
index:          是否保存索引
"""
data.to_csv("csvTest.csv",columns=["open","close"],index=True)
HDF5
# HDF5文件的读取和存储需要指定一个键,值为要存储的DataFrame
"""
注意:优先使用HDF5文件存储
HDF5在存储的时候支持压缩,使用的方式是blosc,这是是速度最快,也是pandas默认支持
使用压缩可以提高磁盘利用率,节省空间
HDF5是跨平台的,可以轻松迁移到Hadoop
"""
"""
read_hdf
path_or_buf:    文件路径
key:            读取的键
"""
day_eps = pd.read_hdf("day_close.h5")
print(day_eps)

"""
to_hdf
path_or_buf:    文件路径
key:            保存的键
"""
day_eps.to_hdf("hdfh5.h5",key="day_close")
json
"""
read_json
path_or_buf:    文件路径
lines:          是否按照每行读取json对象                默认false
typ:            指定转换成的对象类型series或者dataframe 默认 frame
orient          数据输出格式
    split   将索引总结到索引,列名到列名,数据到数据,三部分分开
    records 以columns:values的形式输出
    index   以index:{columns:values}的形式输出
    columns 以cloumns:{index:values}的形式输出
    values  直接输出值
"""
json_data = pd.read_json('Sarcasm_Headlines_Dataset.json', orient="records", lines=True)
print(json_data.head())

"""
to_json
path_or_buf:    文件路径
lines:          是否按照每行存储json对象                默认false
orient          数据存储格式
    split   将索引总结到索引,列名到列名,数据到数据,三部分分开
    records 以columns:values的形式存储
    index   以index:{columns:values}的形式存储
    columns 以cloumns:{index:values}的形式存储
    values  直接输出值
json_data.to_json("jsonTest.json", lines=True, orient="records")
"""
缺失值处理
move_data = pd.read_csv('IMDB-Movie-Data.csv')


# 判断缺失值NaN   isnul   notnull
# 存在缺失值,返回false
print(np.all(pd.notnull(move_data)))
# 存在缺失值,返回true
print(np.any(pd.isnull(move_data)))


# 缺失值填充      fillna  inplace 是否直接修改原数据
# 按列搜索是否存在缺失值,有则用该列平均值替代
for i in move_data.columns:
     if np.any(pd.isnull(move_data[i])):
         move_data[i].fillna(move_data[i].mean(), inplace=True)


# 缺失值删除      dropna
dropna_data = move_data.dropna()


# 数据替换       replace
wis = pd.read_csv(
    "https://archive.ics.uci.edu/ml/machine-learning-databases/breast-cancer-wisconsin/breast-cancer-wisconsin.data")
"""
注意:读取网络数据可能包证书问题
import ssl
ssl._create_default_https_context =  ssl._create_unverified_context
"""
wis = wis.replace(to_replace="?",value=np.nan)
数据离散化
why
连续属性离散化的目的是为了简化数据结构,数据离散化技术可以用来减少给定连续属性值的个数,离散化方法经常作为数据挖掘的工具
what
连续数量的离散化就是在连续属性的值域上,将值域划分为若干个离散的区间,最后用不同的符号或整数值代表落在每个子区间中的属性值
按给定分组次数自动分组
pd.qcut(data,q)
对数据进行分组将数据分组,一般会与value_counts搭配使用,统计每组的个数
series.value_counts() 统计分组次数
data = pd.read_csv("stock_day.csv")
p_change = data["p_change"]
qcut = pd.qcut(p_change, 10)
print(qcut)
print(qcut.value_counts())
自定义区间分组
**pd.cut(data,bins)**
bins = [-100, -7, -5, -3, 0, 3, 5, 7, 100]
p_count = pd.cut(p_change, bins)
print(p_count.value_counts())
one-hot编码
what
把每个类别生成一个布尔列,这些列中只有一列可以为这个样本取值为1,又称为热编码

pd.get_dummies(data,porefix=None)
data:array-like,series,DataFrame
prefix:分组名字
data = pd.read_csv("stock_day.csv")
p_change = data["p_change"]
bins = [-100, -7, -5, -3, 0, 3, 5, 7, 100]
p_count = pd.cut(p_change, bins)

print(pd.get_dummies(p_count, prefix="rise").head())
合并
pd.concat([data1,data2],axis=1)
axis    安装行或列进行合并,0 列合并(默认),1 行合并
concat_one = pd.concat([data, dummies], axis=1)
print(concat_one)
- left: DataFrame
- right: 另一个DataFrame
- on: 指定的共同键
- how: 按照什么方式连接
how     			SQL 					Join Name
left    			LEFT OUT JOIN      		左外连接
right   			RIGHT OUTER JOIN  		右外连接
outer  				FULL OUTER JOIN    		外连接
inner  				INNER JOIN         		内连接      默认
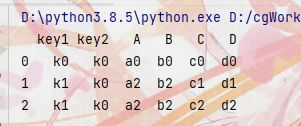
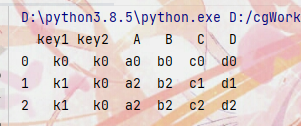
left = pd.DataFrame({
    'key1': ['k0', 'k0', 'k1', 'k2'],
    'key2': ['k0', 'k1', 'k0', 'k1'],
    'A': ['a0', 'a1', 'a2', 'a3'],
    'B': ['b0', 'b1', 'b2', 'b3']
})

right = pd.DataFrame({
    'key1': ['k0', 'k1', 'k1', 'k2'],
    'key2': ['k0', 'k0', 'k0', 'k0'],
    'C': ['c0', 'c1', 'c2', 'c3'],
    'D': ['d0', 'd1', 'd2', 'd3']
})

result = pd.merge(left, right, on=['key1', 'key2'], how='inner')
print(result)
交叉表
用于计算机一列数据对于另外一列数据的分组个数(用于统计分组频率的特色透视表)
# 索引日期转换
time = pd.to_datetime(data.index)
data['week'] = time.weekday
data["p_n"] = np.where(data['p_change'] > 0, 1, 0)
count = pd.crosstab(data['week'], data['p_n'])
print(count)
"""
p_n    0   1
week
0     63  62
1     55  76
2     61  71
3     63  65
4     59  68
"""
#按行求总值
sum = count.sum(axis=1).astype(np.float32)
print(sum)
"""
week
0    125.0
1    131.0
2    132.0
3    128.0
4    127.0
dtype: float32
"""
#求百分占比
ret = count.div(sum, axis=0)
print(ret)
"""
p_n          0         1
week
0     0.504000  0.496000
1     0.419847  0.580153
2     0.462121  0.537879
3     0.492188  0.507812
4     0.464567  0.535433
"""
#画图
ret.plot(kind='bar',stacked=True)
plt.show()
透视表
将原有的DataFrame的列分别作为行索引和列索引,然后对指定的列应用聚集函数
time = pd.to_datetime(data.index)
data['week'] = time.weekday
data["p_n"] = np.where(data['p_change'] > 0, 1, 0)
#省去中间求百分占比
result = data.pivot_table(["p_n"], index="week")
print(result)
"""
           p_n
week
0     0.496000
1     0.580153
2     0.537879
3     0.507812
4     0.535433
"""
案例:星巴克零售店铺数据
starbucks = pd.read_csv('directory.csv')
country_count = starbucks.groupby(["Country"]).count()
print(country_count)
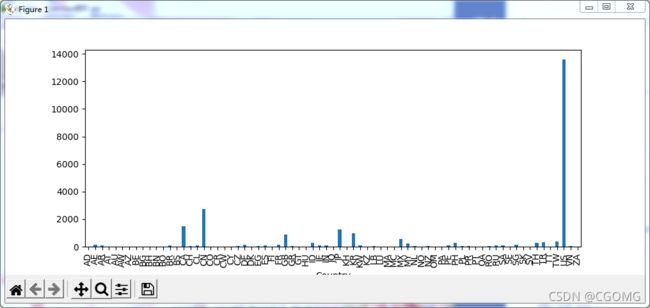
country_count['Brand'].plot(kind="bar", figsize=(10, 4))
plt.show()
c_s_count = starbucks.groupby(["Country", "State/Province"]).count()
print(c_s_count)
案例:分析电影
# 06-16 1000部电影
# url = "https://www.kaggle.com/damianpanek/sunday-eda/data"
movie = pd.read_csv("IMDB-Movie-Data.csv")
# print(movie.head())
"""
   Rank                    Title  ... Revenue (Millions) Metascore
0     1  Guardians of the Galaxy  ...             333.13      76.0
1     2               Prometheus  ...             126.46      65.0
2     3                    Split  ...             138.12      62.0
3     4                     Sing  ...             270.32      59.0
4     5            Suicide Squad  ...             325.02      40.0
"""
# 评分的平均分    6.723199999999999
print(movie['Rating'].mean())
# 导演的人数     644
print(np.unique(movie['Director']).size)
# 获取Rating的分布情况
movie['Rating'].plot(kind="hist")
plt.show()
不准确
# 创建画布
plt.figure(figsize=(16, 4), dpi=100)
# 绘制图形
plt.hist(movie["Rating"].values, bins=20)
# 添加刻度
max_ = movie["Rating"].max()
min_ = movie["Rating"].min()
t1 = np.linspace(min_, max_, num=21)
plt.xticks(t1)
# 添加网格
plt.grid()
# 生成图形
plt.show()
统计电影分类情况-genre
temp_list = [i.split(",") for i in movie['Genre']]
"""
[
    ['Action', 'Adventure', 'Sci-Fi'],
    ['Adventure', 'Mystery', 'Sci-Fi'],
    ['Horror', 'Thriller']
    .....
]
"""

genre_list = np.unique([i for j in temp_list for i in j])
"""
    ['Action', 'Adventure', 'Sci-Fi', 'Adventure', 'Mystery',...]
"""
# 生成全为0的DataFrame
zeros = np.zeros([movie.shape[0], genre_list.shape[0]])
temp_movie = pd.DataFrame(zeros, columns=genre_list)
"""
     Action  Adventure  Animation  Biography  ...  Sport  Thriller  War  Western
0       0.0        0.0        0.0        0.0  ...    0.0       0.0  0.0      0.0
1       0.0        0.0        0.0        0.0  ...    0.0       0.0  0.0      0.0
2       0.0        0.0        0.0        0.0  ...    0.0       0.0  0.0      0.0
"""
# 遍历电影,修改分类列为1
for i in range(1000):
    # temp_movie.ix[i, temp_list[i]] = 1
    temp_movie.loc[i, temp_list[i]] = 1
"""
   Action  Adventure  Animation  Biography  ...  Sport  Thriller  War  Western
0     1.0        1.0        0.0        0.0  ...    0.0       0.0  0.0      0.0
1     0.0        1.0        0.0        0.0  ...    0.0       0.0  0.0      0.0
"""
sum = temp_movie.sum()
"""
Action       303.0
Adventure    259.0
Animation     49.0
Biography     81.0
"""
genre = temp_movie.sum().sort_values(ascending=False)
"""
Drama        513.0
Action       303.0
Comedy       279.0
Adventure    259.0
"""
genre.plot(kind="bar", colormap="cool", figsize=(10, 8), fontsize=10)
plt.show()
