统计图表这么多?这个可视化工具太赞了~~
最近一直在整理统计图表的绘制方法,发现Python中除了经典Seaborn库外,还有一些优秀的可交互的第三方库也能实现一些常见的统计图表绘制,而且其还拥有Matplotlib、Seaborn等库所不具备的交互效果。
当然,同时也能绘制出版级别的图表要求,此外,一些在使用Matplotlib需自定义函数才能绘制的图表在一些第三方库中都集成了,这也大大缩短了绘图时间。
今天我就详细介绍一个优秀的第三方库-HoloViews,内容主要如下:
-
Python-HoloViews库介绍
-
Python-HoloViews库样例介绍
【注】文末提供技术交流群
Python-HoloViews库介绍
Python-HoloViews库作为一个开源的可视化库,其目的是使数据分析结果和可视化完美衔接,其默认的绘图主题和配色以及较少的绘图代码量,可以使你专注于数据分析本身,同时其统计绘图功能也非常优秀。更多关于HoloViews库的介绍,可参考:Python-HoloViews库官网[1]
Python-HoloViews库样例介绍
这一部分小编重点放在一些统计图表上,其绘制结果不仅可以在网页上交互,同时其默认的绘图结果也完全满足出版界别的要求,主要内容如下(以下图表都是可交互的):
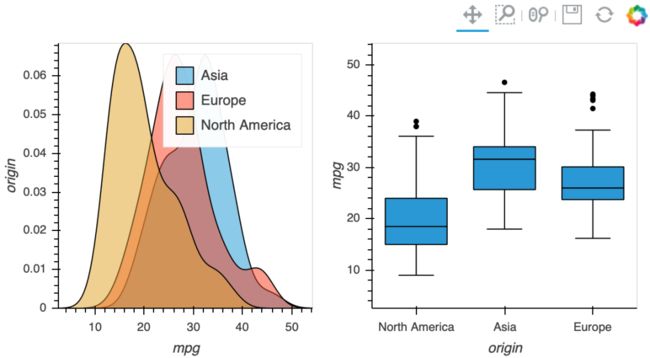
- 「密度图+箱线图」
import pandas as pd
import holoviews as hv
from bokeh.sampledata import autompg

hv.extension('bokeh')
df = autompg.autompg_clean
bw = hv.BoxWhisker(df, kdims=["origin"], vdims=["mpg"])
dist = hv.NdOverlay(
    {origin: hv.Distribution(group, kdims=["mpg"])
         for origin, group in df.groupby("origin")}
)

bw + dist
密度图+箱线图
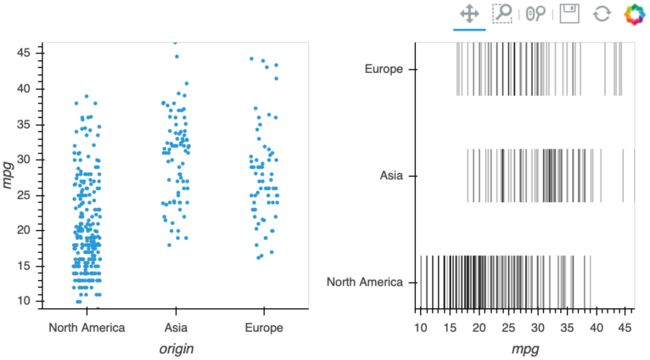
- 「散点图+横线图」
scatter = hv.Scatter(df, kdims=["origin"], vdims=["mpg"]).opts(jitter=0.3)

yticks = [(i + 0.25, origin) for i, origin in enumerate(df["origin"].unique())]
spikes = hv.NdOverlay(
    {
        origin: hv.Spikes(group["mpg"]).opts(position=i)
            for i, (origin, group) in enumerate(df.groupby("origin", sort=False))
    }
).opts(hv.opts.Spikes(spike_length=0.5, yticks=yticks, show_legend=False, alpha=0.3))

scatter + spikes
散点图+横线图
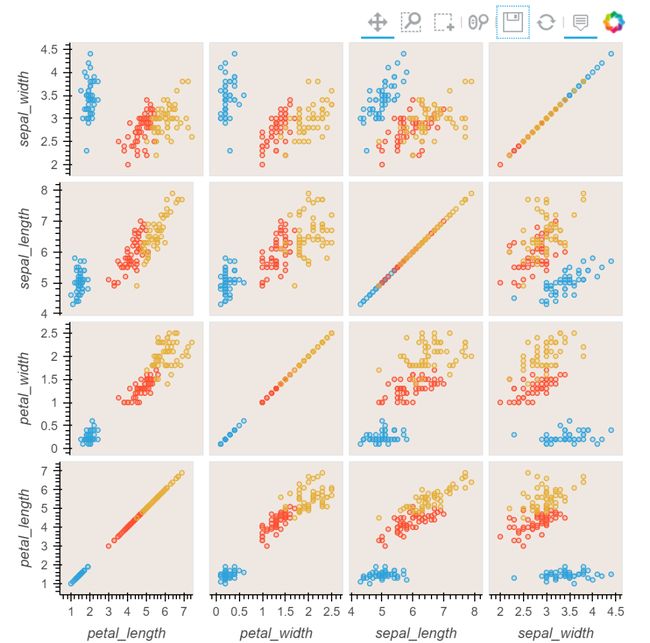
- 「Iris Splom」
from bokeh.sampledata.iris import flowers
from holoviews.operation import gridmatrix

ds = hv.Dataset(flowers)

grouped_by_species = ds.groupby('species', container_type=hv.NdOverlay)
grid = gridmatrix(grouped_by_species, diagonal_type=hv.Scatter)
grid.opts(opts.Scatter(tools=['hover', 'box_select'], bgcolor='#efe8e2', fill_alpha=0.2, size=4))
Iris Splom
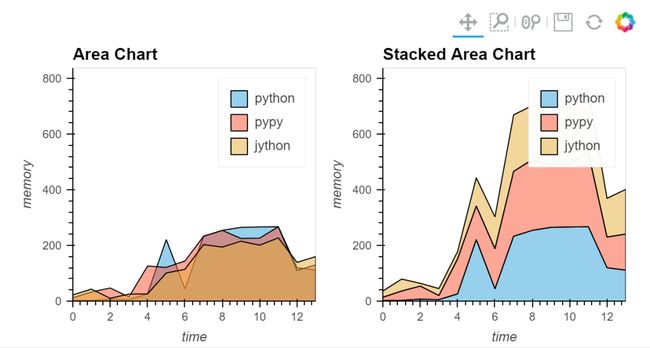
- 「面积图」
# create some example data
python=np.array([2, 3, 7, 5, 26, 221, 44, 233, 254, 265, 266, 267, 120, 111])
pypy=np.array([12, 33, 47, 15, 126, 121, 144, 233, 254, 225, 226, 267, 110, 130])
jython=np.array([22, 43, 10, 25, 26, 101, 114, 203, 194, 215, 201, 227, 139, 160])

dims = dict(kdims='time', vdims='memory')
python = hv.Area(python, label='python', **dims)
pypy   = hv.Area(pypy,   label='pypy',   **dims)
jython = hv.Area(jython, label='jython', **dims)

opts.defaults(opts.Area(fill_alpha=0.5))
overlay = (python * pypy * jython)
overlay.relabel("Area Chart") + hv.Area.stack(overlay).relabel("Stacked Area Chart")
面积图
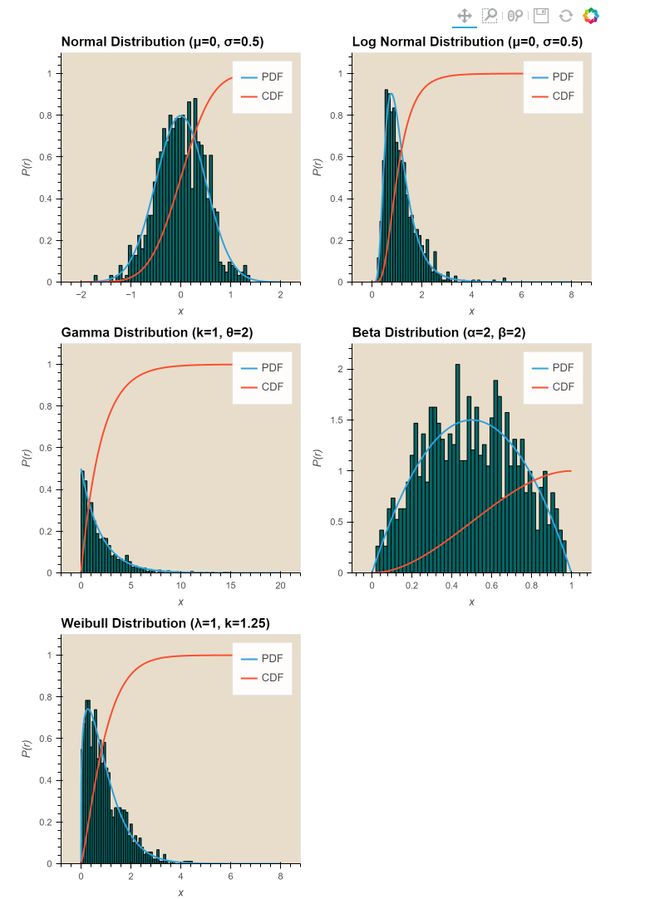
- 「直方图系列」
def get_overlay(hist, x, pdf, cdf, label):
    pdf = hv.Curve((x, pdf), label='PDF')
    cdf = hv.Curve((x, cdf), label='CDF')
    return (hv.Histogram(hist, vdims='P(r)') * pdf * cdf).relabel(label)

np.seterr(divide='ignore', invalid='ignore')

label = "Normal Distribution (μ=0, σ=0.5)"
mu, sigma = 0, 0.5

measured = np.random.normal(mu, sigma, 1000)
hist = np.histogram(measured, density=True, bins=50)

x = np.linspace(-2, 2, 1000)
pdf = 1/(sigma * np.sqrt(2*np.pi)) * np.exp(-(x-mu)**2 / (2*sigma**2))
cdf = (1+scipy.special.erf((x-mu)/np.sqrt(2*sigma**2)))/2
norm = get_overlay(hist, x, pdf, cdf, label)


label = "Log Normal Distribution (μ=0, σ=0.5)"
mu, sigma = 0, 0.5

measured = np.random.lognormal(mu, sigma, 1000)
hist = np.histogram(measured, density=True, bins=50)

x = np.linspace(0, 8.0, 1000)
pdf = 1/(x* sigma * np.sqrt(2*np.pi)) * np.exp(-(np.log(x)-mu)**2 / (2*sigma**2))
cdf = (1+scipy.special.erf((np.log(x)-mu)/(np.sqrt(2)*sigma)))/2
lognorm = get_overlay(hist, x, pdf, cdf, label)


label = "Gamma Distribution (k=1, θ=2)"
k, theta = 1.0, 2.0

measured = np.random.gamma(k, theta, 1000)
hist = np.histogram(measured, density=True, bins=50)

x = np.linspace(0, 20.0, 1000)
pdf = x**(k-1) * np.exp(-x/theta) / (theta**k * scipy.special.gamma(k))
cdf = scipy.special.gammainc(k, x/theta) / scipy.special.gamma(k)
gamma = get_overlay(hist, x, pdf, cdf, label)


label = "Beta Distribution (α=2, β=2)"
alpha, beta = 2.0, 2.0

measured = np.random.beta(alpha, beta, 1000)
hist = np.histogram(measured, density=True, bins=50)

x = np.linspace(0, 1, 1000)
pdf = x**(alpha-1) * (1-x)**(beta-1) / scipy.special.beta(alpha, beta)
cdf = scipy.special.btdtr(alpha, beta, x)
beta = get_overlay(hist, x, pdf, cdf, label)


label = "Weibull Distribution (λ=1, k=1.25)"
lam, k = 1, 1.25

measured = lam*(-np.log(np.random.uniform(0, 1, 1000)))**(1/k)
hist = np.histogram(measured, density=True, bins=50)

x = np.linspace(0, 8, 1000)
pdf = (k/lam)*(x/lam)**(k-1) * np.exp(-(x/lam)**k)
cdf = 1 - np.exp(-(x/lam)**k)
weibull = get_overlay(hist, x, pdf, cdf, label)
直方图系列
- 「Route Chord」
import holoviews as hv
from holoviews import opts, dim
from bokeh.sampledata.airport_routes import routes, airports

hv.extension('bokeh')

# Count the routes between Airports
route_counts = routes.groupby(['SourceID', 'DestinationID']).Stops.count().reset_index()
nodes = hv.Dataset(airports, 'AirportID', 'City')
chord = hv.Chord((route_counts, nodes), ['SourceID', 'DestinationID'], ['Stops'])

# Select the 20 busiest airports
busiest = list(routes.groupby('SourceID').count().sort_values('Stops').iloc[-20:].index.values)
busiest_airports = chord.select(AirportID=busiest, selection_mode='nodes')
busiest_airports.opts(
    opts.Chord(cmap='Category20', edge_color=dim('SourceID').str(),
               height=800, labels='City', node_color=dim('AirportID').str(), width=800))
Route Chord
- 「小提琴图」
import holoviews as hv
from holoviews import dim

from  bokeh.sampledata.autompg import autompg
hv.extension('bokeh')

violin = hv.Violin(autompg, ('yr', 'Year'), ('mpg', 'Miles per Gallon')).redim.range(mpg=(8, 45))
violin.opts(height=500, width=900, violin_fill_color=dim('Year').str(), cmap='Set1')
小提琴图
更多样例可查看:Python-HoloViews样例[2]
总结
今天的推文,小编主要介绍了Python可视化库HoloViews,着重介绍了其中统计图表部分,这个库也会在小编整理的资料中出现,对于一些常见且使用Matplotlib较难绘制的图表较为友好,感兴趣的小伙伴可以学习下哦~~
参考资料
[1]Python-HoloViews库官网: https://holoviews.org/。
[2]Python-HoloViews
样例: https://holoviews.org/gallery/index.html。
推荐文章
- 上瘾了,最近又给公司撸了一个可视化大屏(附源码)
- 如此优雅,4款 Python 自动数据分析神器真香啊
- 梳理半月有余,精心准备了17张知识思维导图,这次要讲清统计学
- 年终汇总:20份可视化大屏模板,直接套用真香(文末附源码)
技术交流
欢迎转载、收藏、有所收获点赞支持一下!
![]()
目前开通了技术交流群,群友已超过2000人,添加时最好的备注方式为:来源+兴趣方向,方便找到志同道合的朋友
- 方式①、发送如下图片至微信,长按识别,后台回复:加群;
- 方式②、添加微信号:dkl88191,备注:来自CSDN
- 方式③、微信搜索公众号:Python学习与数据挖掘,后台回复:加群
![]()
