python常用图形绘图(matplotlib,pyecharts)
python常用图形的绘图
- matlabplot图的基本构成
- matlabplot显示中文问题
-
- 散点图
- 绘制函数
- 条形图
- 水平条形图
- 堆积条形图
- 分组条形图
- 饼状图
- 基本饼状图
- 嵌套饼状图
- 极坐标图
- 极轴条形图
- 箱型图
- 直方图
- 更新直方图颜色
- 二维直方图
- 带散点图的直方图
- 画子图(一张画板画多张图)
- 相邻的子图
- 一些子图的调整
- matlabplot图的细节补充
- pyecharts绘图
-
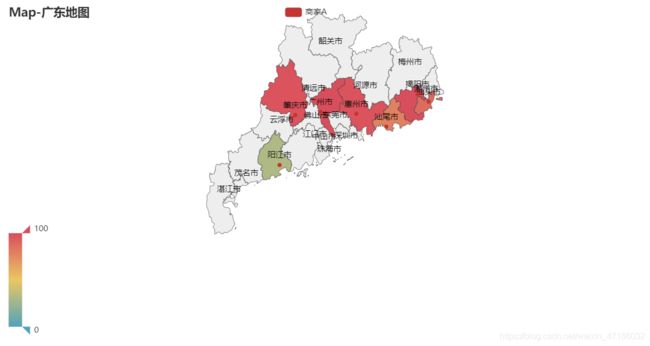
- pyecharts绘商家A在广东分布地图
- 绘制三维世界地图
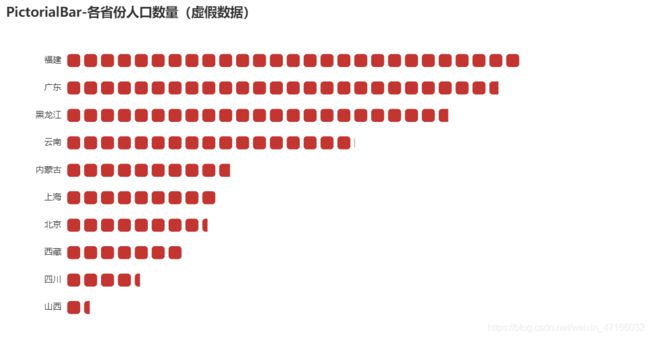
- 象形柱图
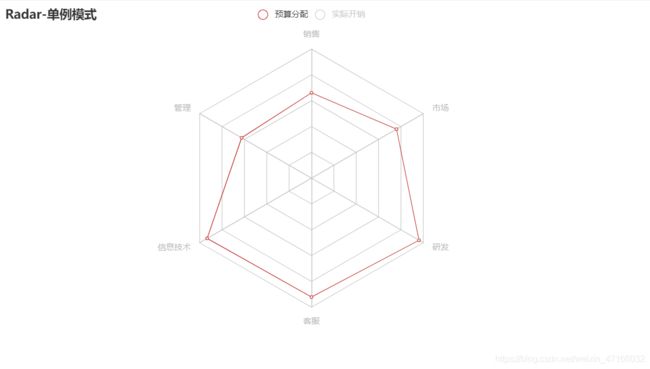
- 雷达图
绘图库导入
import matplotlib.pyplot as plt
import numpy as np
import random
matlabplot图的基本构成
| 属性 | 属性解释 |
|---|---|
| Axes | 坐标系,是所有Matplot图的基本元素 |
| Grid | 坐标系上的网格背景 |
| Title | 标题,每个坐标系都可以有一个title,默认放置在坐标系顶端 |
| Legend | 图例 |
| Axis | 坐标轴 |
| Tick | 坐标轴上的刻度,matlabplot提供了大小两种的刻度,major tick和minor tick。刻度上的文字被称为tick label |
| Spine | 边框,默认在坐标系四周都显示边框 |
| Scatter,Line | 点线数据是图的内容所在,他们对数组(ndarray)数据的直接绘制 |
matlabplot显示中文问题
方法一:
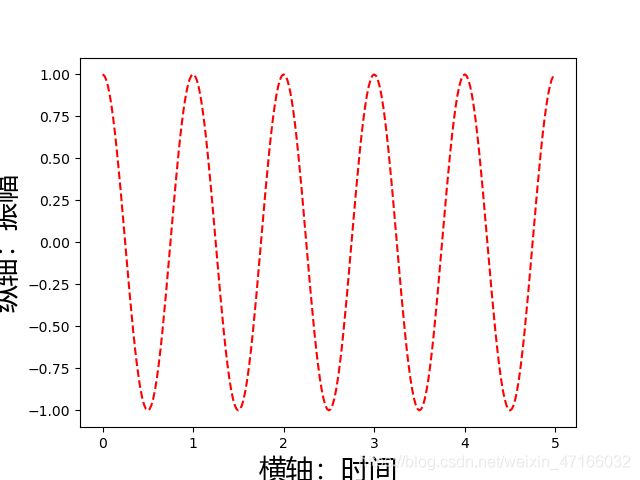
matlabplot默认是不显示中文的,如果我们要在绘图中显示中文,是要设置的,其中family用于显示字体的名称,代码里用的是微软雅黑,还有其他属性,比如字体大小(size),字体风格(style)等,如有需要可以去官方文档查询。注:这种方法只适用windows和Linux系统,如果要在其他系统显示中文可是使用方法二
plt.rc("font", family='MicroSoft YaHei', weight="bold")
方法二:
在每个需要中文输出的地方,增加一个属性:fontproperties
a = np.arange(0.0, 5.0, 0.02)
plt.xlabel('横轴:时间', fontproperties='MicroSoft YaHei', fontsize=20)
plt.ylabel('纵轴:振幅', fontproperties='MicroSoft YaHei', fontsize=20)
plt.plot(a, np.cos(2*np.pi*a), 'r--')
plt.show()
散点图
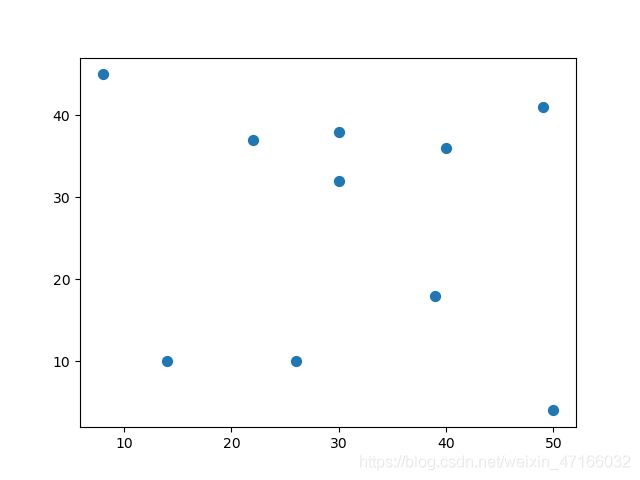
其实画散点图原理非常简单,就是给出一个横坐标的列表X,再给出一个对应的纵坐标列表Y,然后使用 scatter 函数,就可以将散点画在图中,如果使用 plot 函数,则会将散点连线。当然也可以设置点大小、点外框大小、线大小、点颜色、线颜色、点形状、线形状、标题、标签等等。设置部分的内容有很多,但其实也可以不用设置,不设置就代表使用默认的大小、形状以及颜色等等。
# 散点图
X = [random.randint(0, 50) for _ in range(10)]  # 随机生成10个50以内的点的横坐标
Y = [random.randint(0, 50) for _ in range(10)]  # 随机生成10个50以内的点的纵坐标
plt.scatter(X, Y, s=50)  # 绘图,s为点的大小
plt.show()
# 散点图
X = [random.randint(0, 50) for _ in range(10)]  # 随机生成10个50以内的点的横坐标
Y = [random.randint(0, 50) for _ in range(10)]  # 随机生成10个50以内的点的纵坐标
X.sort()  # 对列表进行排序
Y.sort()
plt.plot(X, Y)  # 绘图
plt.show()
绘制函数
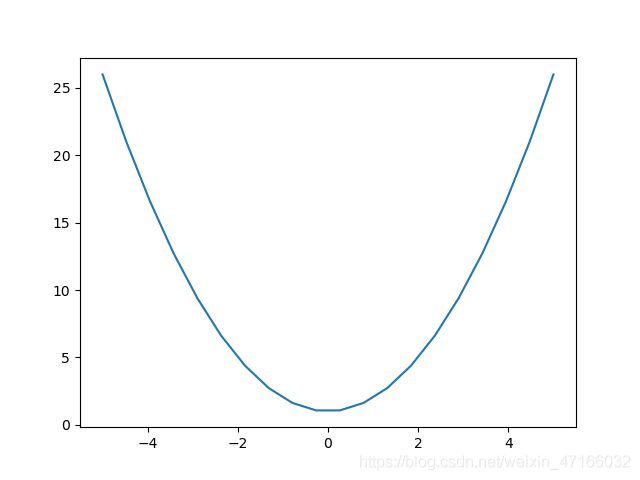
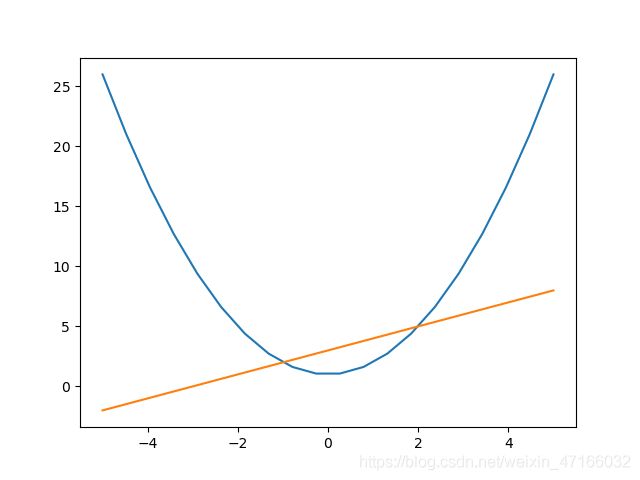
绘制函数其实也很简单,首先给出一个X的取值范围list,然后给出函数,就可以画出来了。下面画一个取值范围在[-5,5] (取20个点),y = X^2 + 1 的函数。
x = np.linspace(-5, 5, 20)  # X轴的20个坐标
y = x**2 + 1
plt.plot(x, y)
plt.show()
x = np.linspace(-5, 5, 20)  # X轴的20个坐标
y = x**2 + 1
y1 = x + 3
plt.plot(x, y)
plt.plot(x, y1)
plt.show()
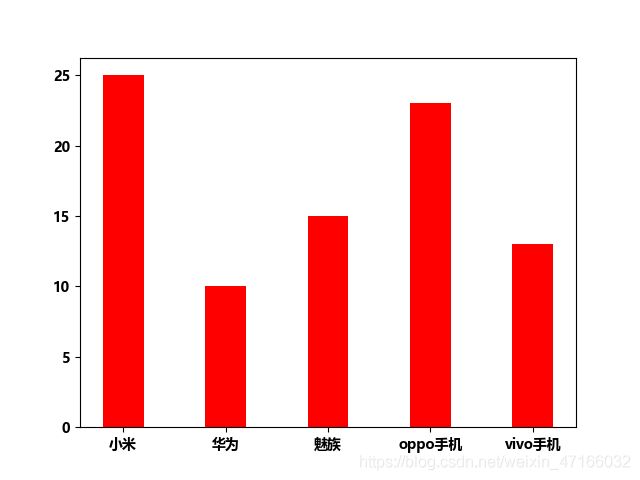
条形图
plt.rc("font", family='MicroSoft YaHei', weight="bold")
x = ['小米', '华为', '魅族', 'oppo手机', 'vivo手机']
y = [25, 10, 15, 23, 13]
plt.bar(x, height=y, color='red', width=0.4)
plt.show()
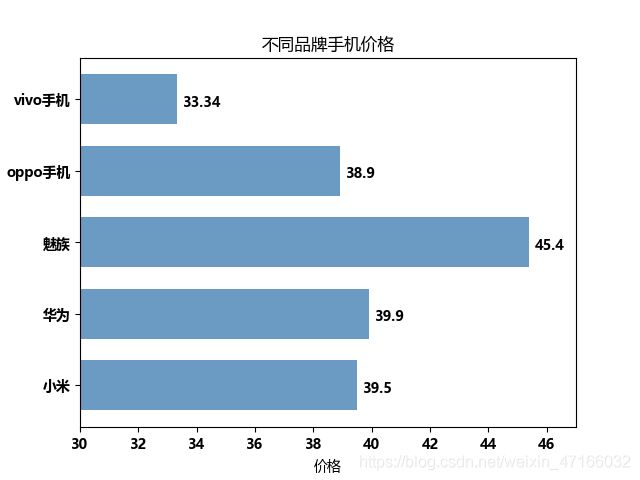
水平条形图
price = [39.5, 39.9, 45.4, 38.9, 33.34]
plt.barh(range(5), price, height=0.7, color='steelblue', alpha=0.8)      # 从下往上画
plt.yticks(range(5), ['小米', '华为', '魅族', 'oppo手机', 'vivo手机'])
plt.xlim(30, 47)
plt.xlabel("价格")
plt.title("不同品牌手机价格")
for x, y in enumerate(price):
    plt.text(y + 0.2, x - 0.1, '%s' % y)   # 显示直方图数值
plt.show()
堆积条形图
labels = ['G1', 'G2', 'G3', 'G4']
sales_BJ = [32, 30, 23, 13]
sales_SH = [44, 26, 35, 21]
bar_width = 0.3
plt.bar(labels, sales_BJ, bar_width, color='b', label="华为")
plt.bar(labels, sales_SH, bar_width, color='r', bottom=sales_BJ, label='小米')
plt.title("各站点的手机销售指标")
plt.legend()   # 显示图标
plt.show()
分组条形图
labels = ['G1', 'G2', 'G3', 'G4', 'G5']
xm = [20, 34, 30, 35, 27]
hw = [25, 32, 34, 20, 25]
x = np.arange(len(labels))  # 标签位置
width = 0.35  # 每个长条的宽度
plt.bar(x - width/2, xm, width, label='小米')
plt.bar(x + width/2, hw, width, label='华为')
plt.title("各站点的手机销售量")
plt.xticks(ticks=x, labels=labels)
plt.legend()
plt.show()
饼状图
基本饼状图
labels = '小米', '华为', '魅族', 'oppo手机'
fracs = [15, 30, 45, 10]
explode = [0, 0.06, 0.08, 0]  # 饼状图中每部分离圆心的距离
plt.axes(aspect=1)
plt.pie(x=fracs, labels=labels, autopct='%.0f%%', explode=explode, shadow=True)
plt.show()
嵌套饼状图
size = 0.3
vals = np.array([[60., 32.], [37., 40.], [29., 10.]])
cmap = plt.get_cmap("tab20c")
outer_colors = cmap(np.arange(3)*4)
inner_colors = cmap([1, 2, 5, 6, 9, 10])
plt.pie(vals.sum(axis=1), radius=1, colors=outer_colors, autopct='%.0f%%',  wedgeprops=dict(width=size, edgecolor='w'))
plt.pie(vals.flatten(), radius=1-size, colors=inner_colors, autopct='%.0f%%', wedgeprops=dict(width=size, edgecolor='w'))
plt.show()
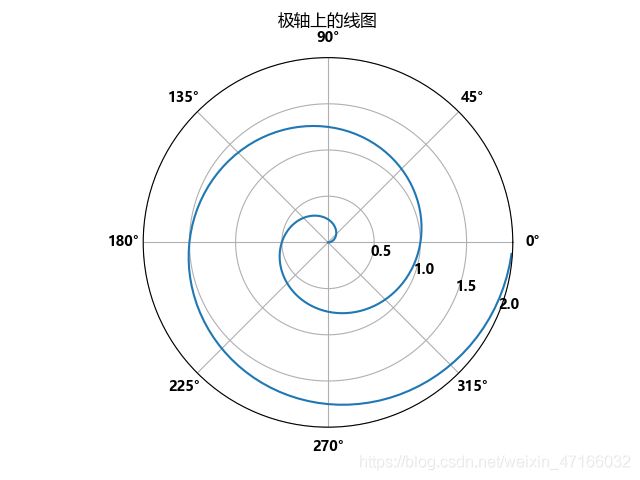
极坐标图
r = np.arange(0, 2, 0.01)
theta = 2 * np.pi * r
fig, ax = plt.subplots(subplot_kw={'projection': 'polar'})
ax.plot(theta, r)
ax.set_rmax(2)
ax.set_rticks([0.5, 1, 1.5, 2])  # 较少的径向刻度
ax.set_rlabel_position(-22.5)  # 将径向标签从绘制的线移开
ax.grid(True)
ax.set_title("极轴上的线图", va='bottom')
plt.show()
极轴条形图
# 计算饼图
N = 20
theta = np.linspace(0.0, 2 * np.pi, N, endpoint=False)
radii = 10 * np.random.rand(N)
width = np.pi / 4 * np.random.rand(N)
colors = plt.cm.viridis(radii / 10.)
plt.subplot(projection='polar')
plt.bar(theta, radii, width=width, bottom=0.0, color=colors, alpha=0.5)
plt.show()
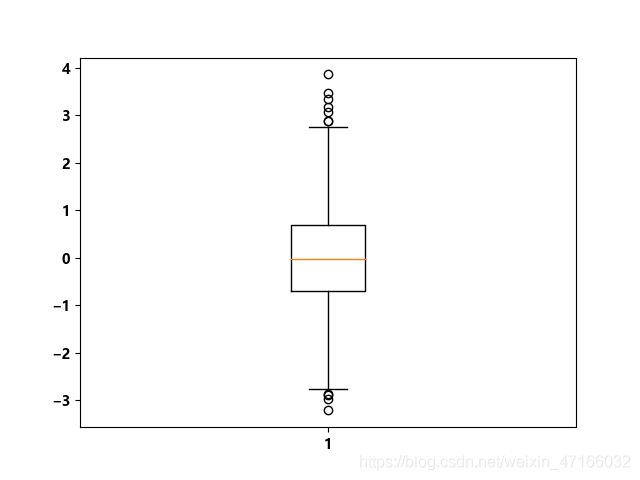
箱型图
np.random.seed(100)
data = np.random.normal(size=1000, loc=0, scale=1)
plt.boxplot(data, sym='o', whis=1.5)
plt.show()
直方图
N_points = 100000
n_bins = 20
# 生成正态分布,以x=0和y=5为中心
x = np.random.randn(N_points)
plt.subplots(1,  sharey=True, tight_layout=True)
plt.hist(x, bins=n_bins)
plt.show()
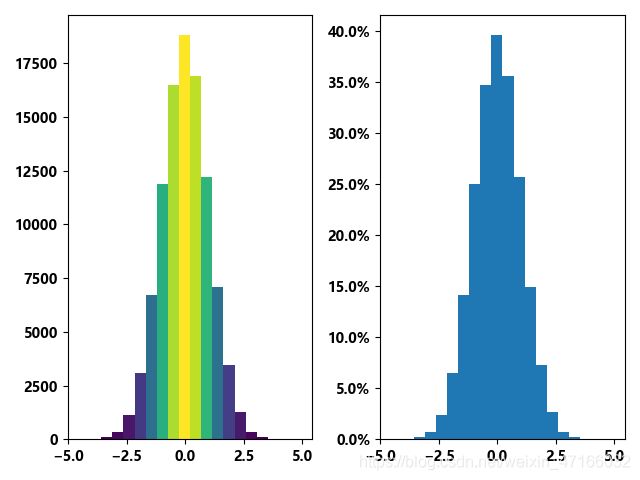
更新直方图颜色
import numpy as np
import matplotlib.pyplot as plt
from matplotlib import colors
from matplotlib.ticker import PercentFormatter

N_points = 100000
n_bins = 20
# 生成正态分布,以 x=0 和 y=5 为中心
x = np.random.randn(N_points)
y = .4 * x + np.random.randn(100000) + 5
fig, axs = plt.subplots(1, 2, tight_layout=True)
N, bins, patches = axs[0].hist(x, bins=n_bins)  # N是每个bin的计数,bins是bin的下限
fracs = N / N.max()  # 按高度对代码进行着色,可以使用任何标量
norm = colors.Normalize(fracs.min(), fracs.max())  # 将颜色图的整个范围的数据归一化为 0..1
# 遍历我们的对象并相应地设置每个对象的颜色
for thisfrac, thispatch in zip(fracs, patches):
    color = plt.cm.viridis(norm(thisfrac))
    thispatch.set_facecolor(color)
axs[1].hist(x, bins=n_bins, density=True)  # 通过计数的总数来标准化我们的输入
axs[1].yaxis.set_major_formatter(PercentFormatter(xmax=1))  # 格式化 y 轴以显示百分比
plt.show()
二维直方图
N_points = 100000
n_bins = 20
# 生成正态分布,以 x=0 和 y=5 为中心
x = np.random.randn(N_points)
y = .4 * x + np.random.randn(100000) + 5
plt.subplots(tight_layout=True)
plt.hist2d(x, y)
plt.show()
带散点图的直方图
import numpy as np
import matplotlib.pyplot as plt
from mpl_toolkits.axes_grid1 import make_axes_locatable

# 生成随机数据
x = np.random.randn(1000)
y = np.random.randn(1000)
fig, ax = plt.subplots(figsize=(5.5, 5.5))
ax.scatter(x, y)
ax.set_aspect(1.)  # 设置主轴的纵横比
divider = make_axes_locatable(ax)  # 在当前轴的右侧和顶部创建新轴
ax_histx = divider.append_axes("top", 1.2, pad=0.1, sharex=ax)
ax_histy = divider.append_axes("right", 1.2, pad=0.1, sharey=ax)
# 使一些标签不可见
ax_histx.xaxis.set_tick_params(labelbottom=False)
ax_histy.yaxis.set_tick_params(labelleft=False)
# 确定好一些限制
binwidth = 0.25
xymax = max(np.max(np.abs(x)), np.max(np.abs(y)))
lim = (int(xymax/binwidth) + 1)*binwidth
bins = np.arange(-lim, lim + binwidth, binwidth)
ax_histx.hist(x, bins=bins)
ax_histy.hist(y, bins=bins, orientation='horizontal')
ax_histx.set_yticks([0, 50, 100])
ax_histy.set_xticks([0, 50, 100])
plt.show()
画子图(一张画板画多张图)
x = np.arange(1, 50)
fig = plt.figure()
ax1 = fig.add_subplot(221)
ax1.plot(x, x)
ax2 = fig.add_subplot(222)
ax2.plot(x, np.sin(x))
ax3 = fig.add_subplot(223)
ax3.plot(x, x**2)
ax4 = fig.add_subplot(224)
ax4.plot(x, np.cos(x))
plt.show()
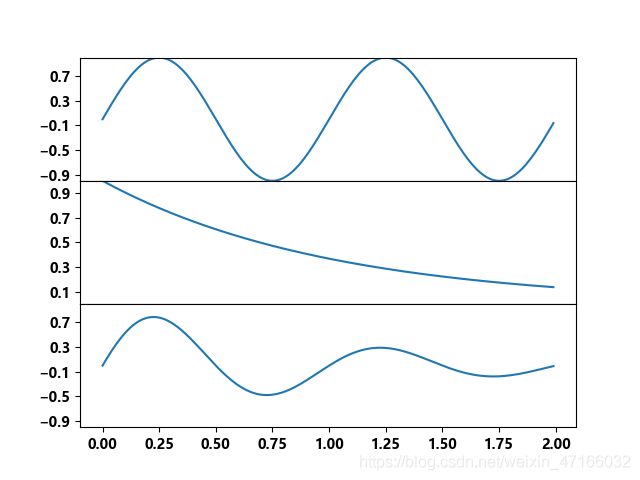
相邻的子图
t = np.arange(0.0, 2.0, 0.01)
s1 = np.sin(2 * np.pi * t)
s2 = np.exp(-t)
s3 = s1 * s2
fig, axs = plt.subplots(3, 1, sharex=True)
# 删除轴之间的水平空间
fig.subplots_adjust(hspace=0)
# 绘制每个图形,并设置y刻度值
axs[0].plot(t, s1)
axs[0].set_yticks(np.arange(-0.9, 1.0, 0.4))
axs[0].set_ylim(-1, 1)
axs[1].plot(t, s2)
axs[1].set_yticks(np.arange(0.1, 1.0, 0.2))
axs[1].set_ylim(0, 1)
axs[2].plot(t, s3)
axs[2].set_yticks(np.arange(-0.9, 1.0, 0.4))
axs[2].set_ylim(-1, 1)
plt.show()
一些子图的调整
1.自动调整子图间距,在显示绘图(plt.show())前加如下代码
plt.tight_layout()
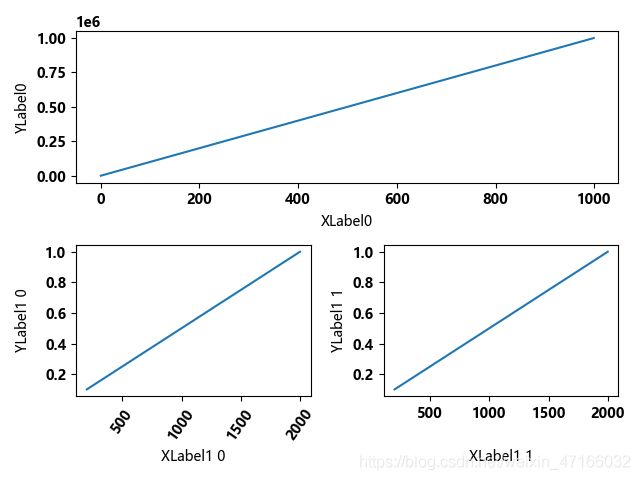
2.对齐标签
import numpy as np
import matplotlib.pyplot as plt
import matplotlib.gridspec as gridspec

fig = plt.figure(tight_layout=True)
gs = gridspec.GridSpec(2, 2)
ax = fig.add_subplot(gs[0, :])
ax.plot(np.arange(0, 1e6, 1000))
ax.set_ylabel('YLabel0')
ax.set_xlabel('XLabel0')
for i in range(2):
    ax = fig.add_subplot(gs[1, i])
    ax.plot(np.arange(1., 0., -0.1) * 2000., np.arange(1., 0., -0.1))
    ax.set_ylabel('YLabel1 %d' % i)
    ax.set_xlabel('XLabel1 %d' % i)
    if i == 0:
        for tick in ax.get_xticklabels():
            tick.set_rotation(55)
fig.align_labels()  # 与fig.align_xlabels(); fig.align_ylabels()相同
plt.show()
plt.subplot(211)
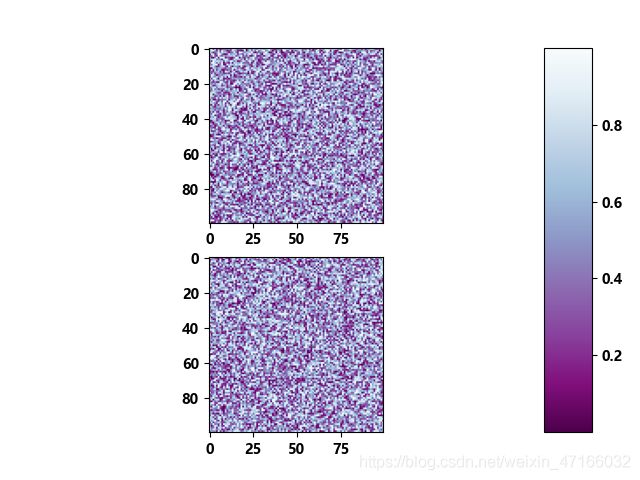
plt.imshow(np.random.random((100, 100)), cmap=plt.cm.BuPu_r)
plt.subplot(212)
plt.imshow(np.random.random((100, 100)), cmap=plt.cm.BuPu_r)
plt.subplots_adjust(bottom=0.1, right=0.8, top=0.9)
cax = plt.axes([0.85, 0.1, 0.075, 0.8])
plt.colorbar(cax=cax)
plt.show()
matlabplot图的细节补充
想要绘制更多的图形可以去matlabplot官网
1.设置标题
plt.title("标题")
2.设置x或y轴坐标刻度
plt.xticks()
plt.yticks()  # 括号内填入刻度
3.设置x或y轴坐标名称
plt.xlabel("标签内容")
plt.ylabel("标签内容")
4.添加图例
plt.plot(x, y, label="图例内容")  # 在绘图函数添加一个属性label
plt.legend(loc=1)   #添加图例,loc为图例位置,1为右上角,2为左上角,3为左下角,4为右下角
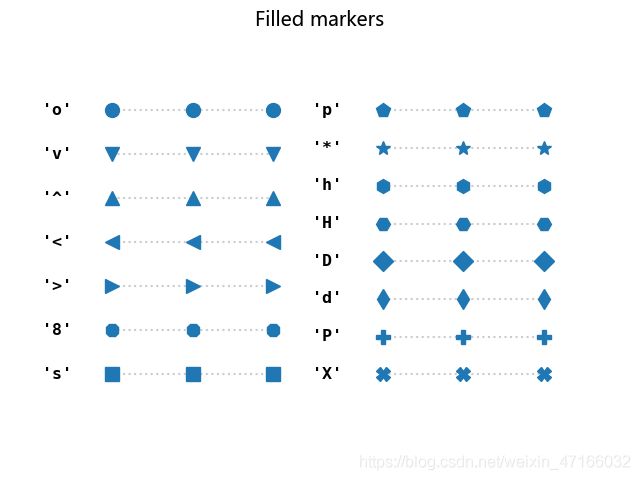
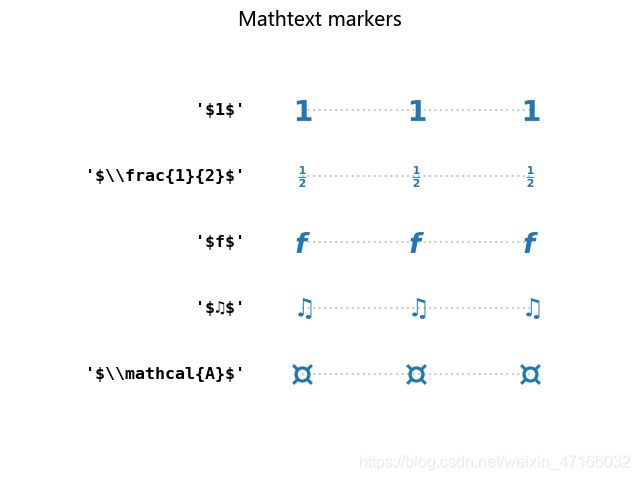
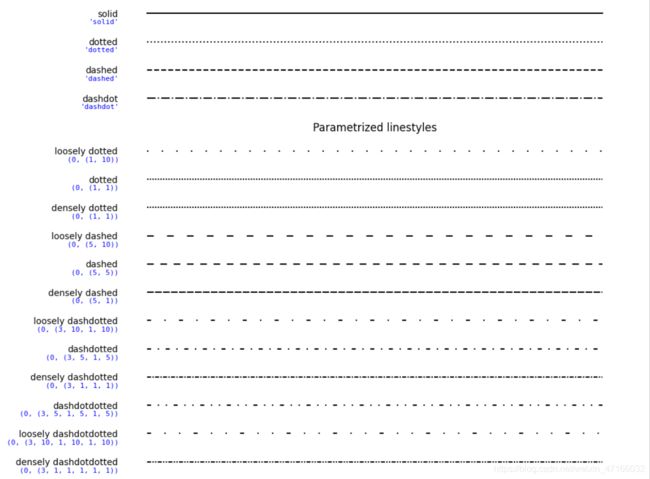
5.设置颜色(color),标记(marker), 线条风格(linestyle)
plt.plot(x, y, color="r", marker='.', linestyle='--', label="y=x**2+1")
设置网格
plt.grid()
列子
x = np.linspace(-5, 5, 20)  # X轴的20个坐标
y = x**2 + 1
plt.plot(x, y, color="r", marker='.', linestyle='--', label="y=x**2+1")
xticks = range(-10, 10)
plt.xticks(xticks)
plt.yticks(xticks)
plt.xlabel("a")
plt.legend(loc=1)
plt.show()
pyecharts绘图
pyecharts是一个基于百度开发的echarts的一个第三方库,它的绘图功能十分强大。交互性比较强,个人觉得是交互性最强的一个第三方绘图库,在用作展示等方面是一个值得使用的第三方库。特别是绘制地理数据可视化上,它有超过400多个地图文件以及原生的百度地图。想要学习更多pyecharts绘图可以去 pyecharts官网学习pyecharts官网,也可以阅读下这篇博文pyecharts的绘图原理详解
下面例子多为绘制地理数据可视图
pyecharts绘商家A在广东分布地图
from pyecharts import options as opts
from pyecharts.charts import Map
from pyecharts.faker import Faker

c = (
    Map()
    .add("商家A", [list(z) for z in zip(Faker.guangdong_city, Faker.values())], "广东")
    .set_global_opts(
        title_opts=opts.TitleOpts(title="Map-广东地图"), visualmap_opts=opts.VisualMapOpts()
    )
    .render(r"C:\map_guangdong.html")  # 生成map_guangdong。html网页链接,存放在C盘
)
绘制三维世界地图
import pyecharts.options as opts
from pyecharts.charts import MapGlobe
from pyecharts.faker import POPULATION

data = [x for _, x in POPULATION[1:]]
low, high = min(data), max(data)

c = (
    MapGlobe()
    .add_schema()
    .add(
        maptype="world",
        series_name="World Population",
        data_pair=POPULATION[1:],
        is_map_symbol_show=False,
        label_opts=opts.LabelOpts(is_show=False),
    )
    .set_global_opts(
        visualmap_opts=opts.VisualMapOpts(
            min_=low,
            max_=high,
            range_text=["max", "min"],
            is_calculable=True,
            range_color=["lightskyblue", "yellow", "orangered"],
        )
    )
    .render(r"C:\map_globe_base.html")
)
象形柱图
from pyecharts import options as opts
from pyecharts.charts import PictorialBar
from pyecharts.globals import SymbolType

location = ["山西", "四川", "西藏", "北京", "上海", "内蒙古", "云南", "黑龙江", "广东", "福建"]
values = [13, 42, 67, 81, 86, 94, 166, 220, 249, 262]

c = (
    PictorialBar()
    .add_xaxis(location)
    .add_yaxis(
        "",
        values,
        label_opts=opts.LabelOpts(is_show=False),
        symbol_size=18,
        symbol_repeat="fixed",
        symbol_offset=[0, 0],
        is_symbol_clip=True,
        symbol=SymbolType.ROUND_RECT,
    )
    .reversal_axis()
    .set_global_opts(
        title_opts=opts.TitleOpts(title="PictorialBar-各省份人口数量(虚假数据)"),
        xaxis_opts=opts.AxisOpts(is_show=False),
        yaxis_opts=opts.AxisOpts(
            axistick_opts=opts.AxisTickOpts(is_show=False),
            axisline_opts=opts.AxisLineOpts(
                linestyle_opts=opts.LineStyleOpts(opacity=0)
            ),
        ),
    )
    .render("pictorialbar_base.html")
)
雷达图
from pyecharts import options as opts
from pyecharts.charts import Radar

v1 = [[4300, 10000, 28000, 35000, 50000, 19000]]
v2 = [[5000, 14000, 28000, 31000, 42000, 21000]]
c = (
    Radar()
    .add_schema(
        schema=[
            opts.RadarIndicatorItem(name="销售", max_=6500),
            opts.RadarIndicatorItem(name="管理", max_=16000),
            opts.RadarIndicatorItem(name="信息技术", max_=30000),
            opts.RadarIndicatorItem(name="客服", max_=38000),
            opts.RadarIndicatorItem(name="研发", max_=52000),
            opts.RadarIndicatorItem(name="市场", max_=25000),
        ]
    )
    .add("预算分配", v1)
    .add("实际开销", v2)
    .set_series_opts(label_opts=opts.LabelOpts(is_show=False))
    .set_global_opts(
        legend_opts=opts.LegendOpts(selected_mode="single"),
        title_opts=opts.TitleOpts(title="Radar-单例模式"),
    )
    .render("radar_selected_mode.html")
)

