第12章 pandas高级应用
12.1 分类数据
有一些数据会包含重复的不同值的小集合的情况。可以用unique和value_counts进行分类提取。
import numpy as np
import pandas as pd
values = pd.Series(['apple', 'orange', 'apple','apple'] * 2)
pd.unique(values)#可以统计不同值
pd.value_counts(values)#可以统计不同值的频次
apple     6
orange    2
dtype: int64
values = pd.Series([0, 1, 0, 0] * 2)
dim = pd.Series(['apple', 'orange'])
print(dim.take(values))
0     apple
1    orange
0     apple
0     apple
0     apple
1    orange
0     apple
0     apple
dtype: object
pandas的分类类型
fruits = ['apple', 'orange', 'apple', 'apple'] * 2
N = len(fruits)
df = pd.DataFrame({'fruit': fruits,
                   'basket_id': np.arange(N),
                   'count': np.random.randint(3, 15, size=N),
                   'weight': np.random.uniform(0, 4, size=N)},
                  columns=['basket_id', 'fruit', 'count', 'weight'])
print(df)
   basket_id   fruit  count    weight
0          0   apple      8  3.781360
1          1  orange     14  2.288399
2          2   apple      7  3.645629
3          3   apple      6  3.695826
4          4   apple      3  0.346048
5          5  orange      4  0.061197
6          6   apple      6  1.797600
7          7   apple      4  3.433174
fruit_cat = df['fruit'].astype('category')
print(fruit_cat)
0     apple
1    orange
2     apple
3     apple
4     apple
5    orange
6     apple
7     apple
Name: fruit, dtype: category
Categories (2, object): [apple, orange]
c = fruit_cat.values
type(c)
pandas.core.arrays.categorical.Categorical
c.categories#返回出唯一值
Index(['apple', 'orange'], dtype='object')
c.codes#返回出索引
array([0, 1, 0, 0, 0, 1, 0, 0], dtype=int8)
#直接创建pandas分类类型的数据
my_categories = pd.Categorical(['foo', 'bar', 'baz', 'foo', 'bar'])
my_categories
[foo, bar, baz, foo, bar]
Categories (3, object): [bar, baz, foo]
#如果已经有了分类的编码,可以通过from_code导入或者添加编码类型
categories = ['foo', 'bar', 'baz']
codes = [0, 1, 2, 0, 0, 1]
my_cats_2 = pd.Categorical.from_codes(codes, categories)
my_cats_2
[foo, bar, baz, foo, foo, bar]
Categories (3, object): [foo, bar, baz]
#可以指定一个顺序
ordered_cat = pd.Categorical.from_codes(codes, categories,
                                        ordered=True)
ordered_cat
#输出[foo < bar < baz]指明‘foo’位于‘bar’的前面
[foo, bar, baz, foo, foo, bar]
Categories (3, object): [foo < bar < baz]
#无序的分类实例可以通过as_ordered排序:
my_cats_2.as_ordered()
[foo, bar, baz, foo, foo, bar]
Categories (3, object): [foo < bar < baz]
用分类进行计算
np.random.seed(12345)
draws = np.random.randn(1000)
draws[:5]
array([-0.20470766, 0.47894334, -0.51943872, -0.5557303 , 1.96578057])
bins = pd.qcut(draws, 4)
bins
[(-0.684, -0.0101], (-0.0101, 0.63], (-0.684, -0.0101], (-0.684, -0.0101], (0.63, 3.928], ..., (-0.0101, 0.63], (-0.684, -0.0101], (-2.9499999999999997, -0.684], (-0.0101, 0.63], (0.63, 3.928]]
Length: 1000
Categories (4, interval[float64]): [(-2.9499999999999997, -0.684] < (-0.684, -0.0101] < (-0.0101, 0.63] < (0.63, 3.928]]
bins = pd.qcut(draws, 4, labels=['Q1', 'Q2', 'Q3', 'Q4'])
print(bins)
bins.codes[:10]
[Q2, Q3, Q2, Q2, Q4, ..., Q3, Q2, Q1, Q3, Q4]
Length: 1000
Categories (4, object): [Q1 < Q2 < Q3 < Q4]


array([1, 2, 1, 1, 3, 3, 2, 2, 3, 3], dtype=int8)
bins = pd.Series(bins, name='quartile')
results = (pd.Series(draws)
           .groupby(bins)
           .agg(['count', 'min', 'max'])
           .reset_index())
print( results)
  quartile  count       min       max
0       Q1    250 -2.949343 -0.685484
1       Q2    250 -0.683066 -0.010115
2       Q3    250 -0.010032  0.628894
3       Q4    250  0.634238  3.927528
用分类提高性能
N = 10000000
draws = pd.Series(np.random.randn(N))
labels = pd.Series(['foo', 'bar', 'baz', 'qux'] * (N // 4))
categories = labels.astype('category')
labels.memory_usage()
print( categories.memory_usage())
10000178
%time _ = labels.astype('category')
Wall time: 856 ms
分类方法
s = pd.Series(['a', 'b', 'c', 'd'] * 2)
cat_s = s.astype('category')
print(cat_s.cat.codes)
print('\n')
print( cat_s.cat.categories)
0    0
1    1
2    2
3    3
4    0
5    1
6    2
7    3
dtype: int8


Index(['a', 'b', 'c', 'd'], dtype='object')
#set_categories方法可以改变数据集中的分类类型
actual_categories = ['a', 'b', 'c', 'd', 'e']
cat_s2 = cat_s.cat.set_categories(actual_categories)
print(cat_s2)
0    a
1    b
2    c
3    d
4    a
5    b
6    c
7    d
dtype: category
Categories (5, object): [a, b, c, d, e]
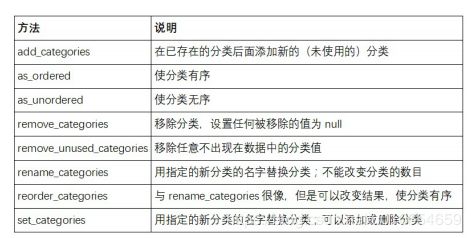
可用的分类方法
为建模创建虚拟变量
pandas.get_dummies函数可以转换这个分类数据为包含虚拟变量的DataFrame
cat_s = pd.Series(['a', 'b', 'c', 'd'] * 2, dtype='category')
print(pd.get_dummies(cat_s))
   a  b  c  d
0  1  0  0  0
1  0  1  0  0
2  0  0  1  0
3  0  0  0  1
4  1  0  0  0
5  0  1  0  0
6  0  0  1  0
7  0  0  0  1
12.2 GroupBy高级应用
分组转换和“解封”GroupBy
df = pd.DataFrame({'key': ['a', 'b', 'c'] * 4,
                   'value': np.arange(12.)})
print(df)
   key  value
0    a    0.0
1    b    1.0
2    c    2.0
3    a    3.0
4    b    4.0
5    c    5.0
6    a    6.0
7    b    7.0
8    c    8.0
9    a    9.0
10   b   10.0
11   c   11.0
g = df.groupby('key').value
print(g.mean())
key
a    4.5
b    5.5
c    6.5
Name: value, dtype: float64
函数lambda x: x.mean()可以用平均值转换数据.
print(g.transform(lambda x: x.mean()))
0     4.5
1     5.5
2     6.5
3     4.5
4     5.5
5     6.5
6     4.5
7     5.5
8     6.5
9     4.5
10    5.5
11    6.5
Name: value, dtype: float64
# 每个分组的降序排名
print(g.transform(lambda x: x.rank(ascending=False)))
0     4.0
1     4.0
2     4.0
3     3.0
4     3.0
5     3.0
6     2.0
7     2.0
8     2.0
9     1.0
10    1.0
11    1.0
Name: value, dtype: float64
def normalize(x):
    return (x - x.mean()) / x.std()
g.transform(normalize)
0    -1.161895
1    -1.161895
2    -1.161895
3    -0.387298
4    -0.387298
5    -0.387298
6     0.387298
7     0.387298
8     0.387298
9     1.161895
10    1.161895
11    1.161895
Name: value, dtype: float64
分组的时间重采样
N = 15
times = pd.date_range('2017-05-20 00:00', freq='1min', periods=N)
df = pd.DataFrame({'time': times,
                   'value': np.arange(N)})
print(df)
                  time  value
0  2017-05-20 00:00:00      0
1  2017-05-20 00:01:00      1
2  2017-05-20 00:02:00      2
3  2017-05-20 00:03:00      3
4  2017-05-20 00:04:00      4
5  2017-05-20 00:05:00      5
6  2017-05-20 00:06:00      6
7  2017-05-20 00:07:00      7
8  2017-05-20 00:08:00      8
9  2017-05-20 00:09:00      9
10 2017-05-20 00:10:00     10
11 2017-05-20 00:11:00     11
12 2017-05-20 00:12:00     12
13 2017-05-20 00:13:00     13
14 2017-05-20 00:14:00     14
print(df.set_index('time').resample('5min').count())
                     value
time
2017-05-20 00:00:00      5
2017-05-20 00:05:00      5
2017-05-20 00:10:00      5
12.3 链式编程技术
管道方法
避免中间变量用不了。
'''
df = load_data()
df2 = df[df['col2'] < 0]
df2['col1_demeaned'] = df2['col1'] - df2['col1'].mean()
result = df2.groupby('key').col1_demeaned.std()
'''
'''
#下面的两段代码是等价的
# Usual non-functional way
df2 = df.copy()
df2['k'] = v
# Functional assign way
df2 = df.assign(k=v)
'''
"\n#下面的两段代码是等价的\n# Usual non-functional way\ndf2 = df.copy()\ndf2['k'] = v\n# Functional assign way\ndf2 = df.assign(k=v)\n"
说明:
放上参考链接,复现的这个链接中的内容。
放上原链接: https://www.jianshu.com/p/04d180d90a3f
作者在链接中放上了书籍,以及相关资源。因为平时杂七杂八的也学了一些,所以这次可能是对书中的部分内容的复现。也可能有我自己想到的内容,内容暂时都还不定。在此感谢原作者SeanCheney的分享
