#使用MPAndroidChart实现水平柱状图(圆角)
## 在使用MPAndroidChart组件前,我们必须阅读官方API,看官方给出的Simple使用实例。如果你想实现的图表与官方给出的实例有出入需要修改Chart设定,那需要仔细阅读使用教程。由于图表的构成是多模块的,每个模块涉及属性较多,建议花点时间阅读教程。
## 在我项目中运用MPAndroidChart的地方比较多,大多数官方使用实例是可以满足使用要求的,那在本篇文章里我只对实现水平柱状图作介绍,其他的不作概述。
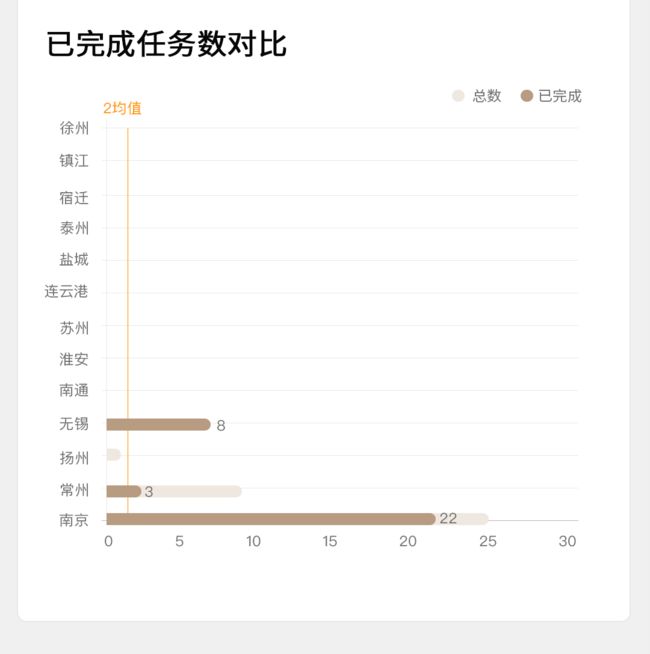
##### 首先了解一下需求,如下图所示需要实现圆角柱状图。
##### 根据官方提供的HorizontalBarChart实现效果如下:
##### 这里我简单贴一下Activity中实现代码:
```
import android.app.Activity;
import android.graphics.RectF;
import android.os.Bundle;
import android.util.Log;
import android.view.View;
import androidx.annotation.Nullable;
import com.github.mikephil.charting.charts.HorizontalBarChart;
import com.github.mikephil.charting.components.AxisBase;
import com.github.mikephil.charting.components.Legend;
import com.github.mikephil.charting.components.LimitLine;
import com.github.mikephil.charting.components.XAxis;
import com.github.mikephil.charting.components.YAxis;
import com.github.mikephil.charting.data.BarData;
import com.github.mikephil.charting.data.BarDataSet;
import com.github.mikephil.charting.data.BarEntry;
import com.github.mikephil.charting.data.Entry;
import com.github.mikephil.charting.formatter.IAxisValueFormatter;
import com.github.mikephil.charting.highlight.Highlight;
import com.github.mikephil.charting.interfaces.datasets.IBarDataSet;
import com.github.mikephil.charting.listener.OnChartValueSelectedListener;
import com.github.mikephil.charting.utils.MPPointF;
import java.util.ArrayList;
import java.util.Random;
public class OrderCountActivity extends Activity implements OnChartValueSelectedListener {
// 自定义Chatrt图标
private HorizontalBarChart chart;
// 测试数据
private String labelName[] = {"","南京", "常州", "扬州", "无锡", "南通", "淮安", "苏州", "连云港", "盐城", "泰州", "宿迁", "镇江", "徐州"};
@Override
protected void onCreate(@Nullable Bundle savedInstanceState) {
super.onCreate(savedInstanceState);
setContentView(R.layout.activity_order_count);
initViews();
}
public void initViews() {
chart = findViewById(R.id.custom_chart);
chart.setOnChartValueSelectedListener(this);
chart.setDrawBarShadow(true);
chart.setDrawValueAboveBar(true);
chart.setExtraOffsets(0, 10, 0, 10); // 设置饼图的偏移量,类似于内边距 ,设置视图窗口大小
chart.setDoubleTapToZoomEnabled(false); // 双击不可放大
chart.getDescription().setEnabled(false); // 不显示描述
chart.setMaxVisibleValueCount(60); // 最大值
chart.setPinchZoom(false); // x,y轴方向缩放
chart.setDrawGridBackground(false); //网格背景
chart.animateY(2500); // Y轴 初始化时动画效果
// 设置x轴
final XAxis xl = chart.getXAxis();
xl.setPosition(XAxis.XAxisPosition.BOTTOM); // 设置x轴显示在下方,默认在上方
xl.setDrawAxisLine(true); //设置为true,则绘制该行旁边的轴线(axis-line)
xl.setDrawGridLines(true);// 将此设置为true,绘制该轴的网格线
xl.setAxisMinimum(0.0f); // 设置最小值 不要随便改
xl.setLabelCount(labelName.length);
xl.setTextSize(14.0f); // 设置文字大小
// 设置x轴显示的值的格式
xl.setValueFormatter(new IAxisValueFormatter() {
@Override
public String getFormattedValue(float value, AxisBase axis) {
if (value - xl.getAxisMinimum()< labelName.length) {
return labelName[(int) (value - xl.getAxisMinimum())];
} else {
return "";
}
}
});
xl.setXOffset(0.0f); // 设置标签对x轴的偏移量,垂直方向
// 设置y轴,y轴有两条,分别为左和右
YAxis yr = chart.getAxisRight();
chart.getAxisLeft().setEnabled(false); // 隐藏右边 的坐标轴
yr.setDrawAxisLine(false);
yr.setDrawGridLines(false);
yr.setTextSize(14.0f);
// y轴添加限制线
LimitLine limitLine = new LimitLine(2.0f, "平均值:2.0");
limitLine.setLabelPosition(LimitLine.LimitLabelPosition.RIGHT_TOP);
limitLine.setTextSize(12f);
limitLine.setLineColor(getResources().getColor(R.color.colo_FFA224)); // 线的颜色
limitLine.setTextColor(getResources().getColor(R.color.colo_FFA224)); // 文字的颜色
yr.addLimitLine(limitLine);
yr.setDrawZeroLine(true);
yr.setYOffset(0.0f);
Legend legend = chart.getLegend();
legend.setEnabled(false);// 隐藏图例
setData(); // 填充数据
}
private void setData() {
float barWidth = 0.5f;
ArrayList
ArrayList
Random random = new Random();
for (int i = 0; i < labelName.length; i++) {
if(i==0){
values_zs.add(new BarEntry(-1 , 0 ));
values_ywc.add(new BarEntry(-1, 0));
continue;
}
int val = random.nextInt(20);
float val2 = (float) Math.random()*10;
values_zs.add(new BarEntry(i , 2*val2));
values_ywc.add(new BarEntry(i, val2));
}
if (chart.getData() != null &&
chart.getData().getDataSetCount() > 0) {
BarDataSet dataSetZs = (BarDataSet) chart.getData().getDataSetByIndex(0); // 总数
BarDataSet dataSetYwc = (BarDataSet) chart.getData().getDataSetByIndex(1); // 已完成数
dataSetZs.setValues(values_zs);
dataSetYwc.setValues(values_ywc);
chart.getData().notifyDataChanged();
chart.notifyDataSetChanged();
} else {
ArrayList
BarDataSet dataSetZs = new BarDataSet(values_zs, "总数");
dataSetZs.setDrawIcons(false);
dataSetZs.setDrawValues(false); // 不显示值
dataSetZs.setColor(getResources().getColor(R.color.colo_EFE8E1)); // 浅灰色
dataSets.add(dataSetZs);
BarDataSet dataSetYwc = new BarDataSet(values_ywc, "已完成");
dataSetYwc.setDrawIcons(false);
dataSetYwc.setColor(getResources().getColor(R.color.colo_B79C81)); // 浅褐色
dataSets.add(dataSetYwc);
BarData data = new BarData(dataSets);
data.setValueTextSize(10f);
data.setBarWidth(barWidth);
chart.setData(data);
}
findViewById(R.id.tv_ywcs).setVisibility(View.VISIBLE);
findViewById(R.id.tv_zs).setVisibility(View.VISIBLE);
}
private final RectF mOnValueSelectedRectF = new RectF();
@Override
public void onValueSelected(Entry e, Highlight h) {
if (e == null)
return;
RectF bounds = mOnValueSelectedRectF;
chart.getBarBounds((BarEntry) e, bounds);
MPPointF position = chart.getPosition(e, chart.getData().getDataSetByIndex(h.getDataSetIndex())
.getAxisDependency());
Log.i("bounds", bounds.toString());
Log.i("position", position.toString());
MPPointF.recycleInstance(position);
}
@Override
public void onNothingSelected() {
}
}
```
#####布局文件 activity_order_count.xml:
```
xmlns:tools="http://schemas.android.com/tools" android:layout_width="match_parent" android:layout_height="match_parent" android:background="@color/colo_F0F0F0" android:orientation="vertical"> android:id="@+id/title_bottom" android:layout_width="wrap_content" android:layout_height="wrap_content" android:layout_below="@+id/ll_middle" android:layout_margin="15dp" android:layout_weight="1" android:text="已完成任务数对比" android:textColor="@color/black" android:textSize="16sp" android:textStyle="bold" /> android:layout_width="match_parent" android:layout_height="match_parent" android:layout_below="@+id/title_bottom"> android:id="@+id/tv_ywcs" android:layout_width="wrap_content" android:layout_height="wrap_content" android:gravity="center_vertical" android:layout_alignParentTop="true" android:layout_alignParentRight="true" android:text="已完成" android:drawableLeft="@drawable/ic_brown_point"/> android:id="@+id/tv_zs" android:layout_width="wrap_content" android:layout_height="wrap_content" android:gravity="center_vertical" android:layout_alignParentTop="true" android:layout_toLeftOf="@+id/tv_ywcs" android:text="总数" android:layout_marginRight="10dp" android:drawableLeft="@drawable/ic_brown_low_point"/> android:id="@+id/custom_chart" android:layout_width="match_parent" android:layout_height="match_parent" android:background="@android:color/white" android:layout_below="@+id/tv_ywcs"/>
```
#####距离实现圆角柱状图只差一步,自定义水平圆角柱状图,下面直接给出代码吧
```
/**
* 重写HorizontalBarChart,更改其柱状图样式
*/
public class CustomHorizontalBarChart extends HorizontalBarChart {
public CustomHorizontalBarChart(Context context) {
super(context);
}
public CustomHorizontalBarChart(Context context, AttributeSet attrs) {
super(context, attrs);
}
public CustomHorizontalBarChart(Context context, AttributeSet attrs, int defStyle) {
super(context, attrs, defStyle);
}
@Override
protected void init() {
super.init();
this.mRenderer =new CustomHorizontalBarChartRenderer(this, this.mAnimator, this.mViewPortHandler);
}
}
```
######最重要的步骤来了,重写器渲染器,覆盖HorizontalBarChartRenderer.java中绘制柱状图的方法。其中drawDataSet是绘制柱状图的方法,drawHighlighted是绘制点击过后高亮柱状图。
```
import com.github.mikephil.charting.highlight.Highlight;
import com.github.mikephil.charting.highlight.Range;
import com.github.mikephil.charting.renderer.HorizontalBarChartRenderer;
import android.graphics.Canvas;
import android.graphics.Path;
import android.graphics.RectF;
import android.util.Log;
import com.github.mikephil.charting.animation.ChartAnimator;
import com.github.mikephil.charting.buffer.BarBuffer;
import com.github.mikephil.charting.data.BarData;
import com.github.mikephil.charting.data.BarEntry;
import com.github.mikephil.charting.interfaces.dataprovider.BarDataProvider;
import com.github.mikephil.charting.interfaces.datasets.IBarDataSet;
import com.github.mikephil.charting.utils.Transformer;
import com.github.mikephil.charting.utils.Utils;
import com.github.mikephil.charting.utils.ViewPortHandler;
/**
* 继承HorizontalBarChartRenderer写一个新的渲染器,调整为水平颜色
*/
public class CustomHorizontalBarChartRenderer extends HorizontalBarChartRenderer {
public CustomHorizontalBarChartRenderer(BarDataProvider chart, ChartAnimator animator, ViewPortHandler viewPortHandler) {
super(chart, animator, viewPortHandler);
}
private RectFmBarShadowRectBuffer =new RectF();
@Override
protected void drawDataSet(Canvas c, IBarDataSet dataSet, int index) {
Transformer trans =mChart.getTransformer(dataSet.getAxisDependency());
mBarBorderPaint.setColor(dataSet.getBarBorderColor());
mBarBorderPaint.setStrokeWidth(Utils.convertDpToPixel(dataSet.getBarBorderWidth()));
final boolean drawBorder = dataSet.getBarBorderWidth() >0.f;
float phaseX =mAnimator.getPhaseX();
float phaseY =mAnimator.getPhaseY();
// draw the bar shadow before the values
if (mChart.isDrawBarShadowEnabled()) {
mShadowPaint.setColor(dataSet.getBarShadowColor());
BarData barData =mChart.getBarData();
final float barWidth = barData.getBarWidth();
final float barWidthHalf = barWidth /2.0f;
float x;
for (int i =0, count = Math.min((int) (Math.ceil((float) (dataSet.getEntryCount()) * phaseX)), dataSet.getEntryCount());
i < count;
i++) {
BarEntry e = dataSet.getEntryForIndex(i);
x = e.getX();
mBarShadowRectBuffer.top = x - barWidthHalf;
mBarShadowRectBuffer.bottom = x + barWidthHalf;
trans.rectValueToPixel(mBarShadowRectBuffer);
if (!mViewPortHandler.isInBoundsTop(mBarShadowRectBuffer.bottom))
continue;
if (!mViewPortHandler.isInBoundsBottom(mBarShadowRectBuffer.top))
break;
mBarShadowRectBuffer.left =mViewPortHandler.contentLeft();
mBarShadowRectBuffer.right =mViewPortHandler.contentRight();
float radius = (mBarShadowRectBuffer.bottom -mBarShadowRectBuffer.top) /2;
// 画半圆+矩形
RectF rectFTo =new RectF(mBarShadowRectBuffer.right -2 * radius, mBarShadowRectBuffer.top,
mBarShadowRectBuffer.right, mBarShadowRectBuffer.bottom);
Path path =new Path();
path.arcTo(rectFTo, -90, 180, true);
if (mBarShadowRectBuffer.right -mBarShadowRectBuffer.left < radius) {
path.lineTo(rectFTo.centerX(), rectFTo.bottom);
Path srcPath =new Path();
srcPath.addRect(mBarShadowRectBuffer.left, mBarShadowRectBuffer.top, mBarShadowRectBuffer.right, mBarShadowRectBuffer.bottom, Path.Direction.CW);
path.op(srcPath, Path.Op.INTERSECT); // 相交部分
}else {
path.moveTo(rectFTo.centerX(), rectFTo.bottom);
path.lineTo(mBarShadowRectBuffer.left, mBarShadowRectBuffer.bottom);
path.lineTo(mBarShadowRectBuffer.left, mBarShadowRectBuffer.top);
path.lineTo(rectFTo.centerX(), mBarShadowRectBuffer.top);
}
c.drawPath(path, mShadowPaint);
}
}
// initialize the buffer
BarBuffer buffer =mBarBuffers[index];
buffer.setPhases(phaseX, phaseY);
buffer.setDataSet(index);
buffer.setInverted(mChart.isInverted(dataSet.getAxisDependency()));
buffer.setBarWidth(mChart.getBarData().getBarWidth());
buffer.feed(dataSet);
trans.pointValuesToPixel(buffer.buffer);
final boolean isSingleColor = dataSet.getColors().size() ==1;
if (isSingleColor) {
mRenderPaint.setColor(dataSet.getColor());
}
for (int j =0; j < buffer.size(); j +=4) {
if (!mViewPortHandler.isInBoundsTop(buffer.buffer[j +3]))
break;
if (!mViewPortHandler.isInBoundsBottom(buffer.buffer[j +1]))
continue;
if (!isSingleColor) {
// Set the color for the currently drawn value. If the index
// is out of bounds, reuse colors.
mRenderPaint.setColor(dataSet.getColor(j /4));
}
// 画半圆+矩形
float barWidthHalf = (buffer.buffer[j +3] - buffer.buffer[j +1]) /2;
RectF rectFTo =new RectF(buffer.buffer[j +2] -2 * barWidthHalf, buffer.buffer[j +1],
buffer.buffer[j +2], buffer.buffer[j +3]);
Path path =new Path();
path.arcTo(rectFTo, -90, 180, true);
if (buffer.buffer[j +2] - buffer.buffer[j] < barWidthHalf) {
path.lineTo(rectFTo.centerX(), rectFTo.bottom); // 封闭半圆
Path srcPath =new Path();
srcPath.addRect(buffer.buffer[j], buffer.buffer[j +1], buffer.buffer[j +2], buffer.buffer[j +3], Path.Direction.CW);
path.op(srcPath, Path.Op.INTERSECT); // 相交部分
}else {
path.moveTo(rectFTo.centerX(), rectFTo.bottom);
path.lineTo(buffer.buffer[j], buffer.buffer[j +3]);
path.lineTo(buffer.buffer[j], buffer.buffer[j +1]);
path.lineTo(rectFTo.centerX(), buffer.buffer[j +1]);
}
c.drawPath(path, mRenderPaint);
if (drawBorder) {
c.drawPath(path, mBarBorderPaint);
}
}
}
@Override
public void drawHighlighted(Canvas c, Highlight[] indices) {
BarData barData =mChart.getBarData();
final float barWidth = barData.getBarWidth();
final float barWidthHalf = barWidth /2.0f;
for (Highlight high : indices) {
IBarDataSet set = barData.getDataSetByIndex(high.getDataSetIndex());
if (set ==null || !set.isHighlightEnabled())
continue;
BarEntry e = set.getEntryForXValue(high.getX(), high.getY());
if (!isInBoundsX(e, set))
continue;
Transformer trans =mChart.getTransformer(set.getAxisDependency());
mHighlightPaint.setColor(set.getHighLightColor());
mHighlightPaint.setAlpha(set.getHighLightAlpha());
boolean isStack = (high.getStackIndex() >=0 && e.isStacked()) ?true :false;
final float y1;
final float y2;
if (isStack) {
if (mChart.isHighlightFullBarEnabled()) {
y1 = e.getPositiveSum();
y2 = -e.getNegativeSum();
}else {
Range range = e.getRanges()[high.getStackIndex()];
y1 = range.from;
y2 = range.to;
}
}else {
y1 = e.getY();
y2 =0.f;
}
// 画半圆
float leftTo = y1 -2 * barWidth;
float rightTo = y1;
float topTo = e.getX() - barWidthHalf;
float bottomTo = e.getX() + barWidthHalf;
RectF rectFTo =new RectF(leftTo, topTo, rightTo, bottomTo);
trans.rectToPixelPhase(rectFTo, mAnimator.getPhaseY());
Path path =new Path();
path.arcTo(rectFTo, -90, 180, true);
RectF rectF =new RectF(y2, topTo, rightTo, bottomTo);
trans.rectToPixelPhase(rectF, mAnimator.getPhaseY());
if (y1 - barWidth <0) {
path.lineTo(rectFTo.centerX(), rectFTo.bottom);
Path srcPath =new Path();
srcPath.addRect(rectF.left,rectF.top, rectF.right, rectF.bottom, Path.Direction.CW);
path.op(srcPath, Path.Op.INTERSECT); // 相交部分
}else {
path.moveTo(rectFTo.centerX(), rectFTo.bottom);
path.lineTo(rectF.left, rectFTo.bottom);
path.lineTo(rectF.left, rectFTo.top);
path.lineTo(rectFTo.centerX(), rectFTo.top);
}
c.drawPath(path, mHighlightPaint);
}
}
}
```
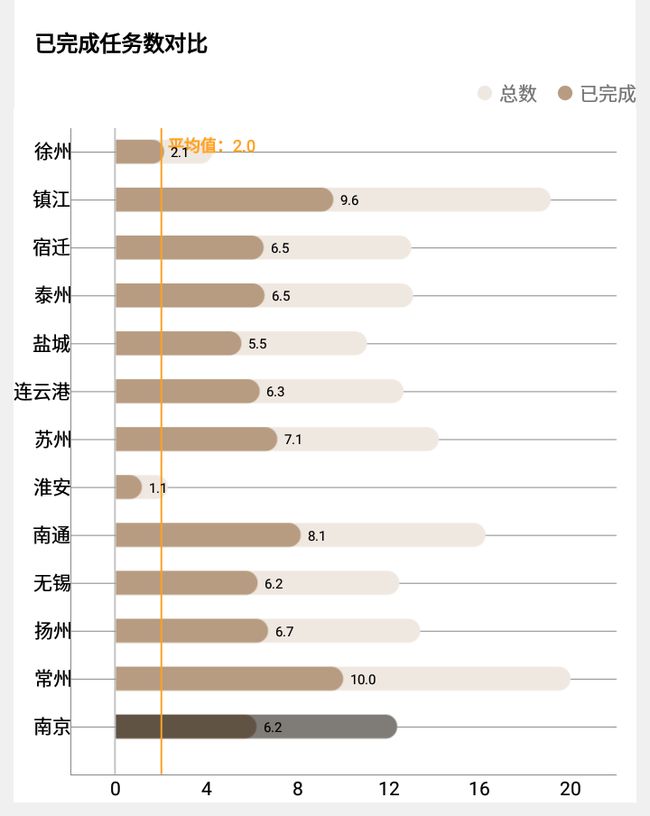
#####最后来看看最终实现效果:
~~~~~~ 结束,第一次写,对的格式不熟悉,可能会在代码开头和结尾有“```” ,复制代码时请删除```”。


