python数据可视化与matplotlib的应用
1.什么是数据可视化
数据可视化有着非常久远的历史,最早可以追溯至远古时期。数据可视化是借助图形化的手段将一组数据以图形的形式表示,并利用数据分析和开发工具发现其中未知信息的数据处理过程。数据可视化其实是一个抽象的过程,简单来说就是将一个不易描述的事物形成一个可感知画面的过程,即从数据空间到图形空间的映射
matplotlib的绘制图表
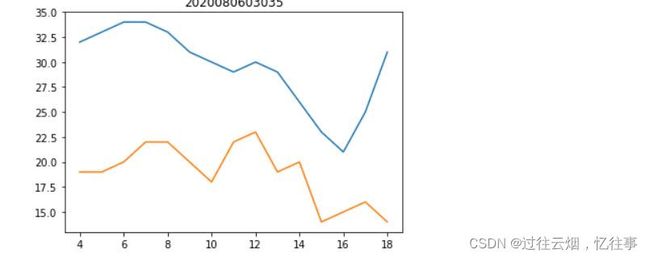
折线图:
import matplotlib.pyplot as plt
import numpy as np
x = np.arange(4,19)
y_max = np.array([32,33,34,34,33,31,30,29,30,29,26,23,21,25,31])
y_min = np.array([19,19,20,22,22,20,18,22,23,19,20,14,15,16,14])
# 绘制折线图
plt.plot(x,y_max)
plt.plot(x,y_min)
plt.title("2020080603035")
plt.show()
import matplotlib.pyplot as plt
import numpy as np
x = np.arange(5)
y1 = np.array([10,8,7,11,13])
bar_width = 0.3
plt.bar(x,y1,tick_label=['a','b','c','d','e'],width=bar_width)
plt.title("2020080603035")
plt.show()
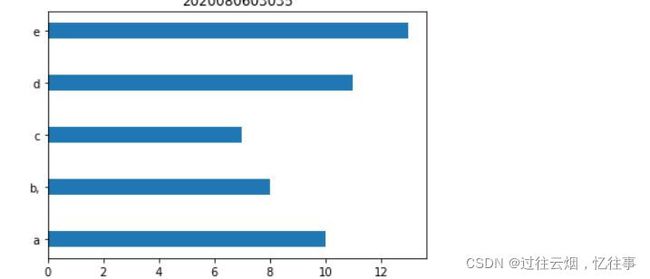
条形图:
y = np.arange(5)
x1 = np.array([10,8,7,11,13])
bar_height = 0.3
plt.barh(y,x1,tick_label=['a','b,','c','d','e'],height=bar_height)
plt.title("2020080603035")
plt.show()


