2021APMCM赛后总结——边缘检测
APMCM被称为小美赛,和美赛一样使用英文提交论文,比赛时间又在国赛后美赛前,因此很适合作为MCM的热身赛。
第一次参加这种正规比赛,而且是英文写作,作为对美赛的预热,花四天时间提前演练一下是很有必要的。在日常上课和(几乎)按时休息的条件下,最终,我们队能够拿到二等奖,算是比较满意了。
赛前准备
APMCM四天时间,而期间有部分期中考试,因此对时间的把握很重要。我们提前半个月寻找讨论地点,在排除了书店、咖啡厅及教学楼之后,我们选择了图书馆总馆的学习研讨空间。从早上八点到晚上十点,期间在登高路恰饭。
我们主要看了往年题目,学了一点点建模技巧,然后买了美赛和Matlab的相关资料。将讨论地点选在图书馆也有这样的考虑:遇到跨专业问题时能够及时翻阅到相关资料。
比赛时
2021年亚太赛里,A题有关边缘检测,涉及图形图像处理;b题跨专业程度大,不考虑;c题传统数据处理。刚好我们手边有冈萨雷斯的《图形图像处理》,而我又恰好看了关于边缘检测的一节,于是我们选择冲一冲A题。
比赛持续四天。
第一天图书馆闭馆之后,我们借用了信息院的会议室工作到凌晨一点。
后来发现通宵效率不高,之后便统一早八晚十,之后各自回寝室整理工作。
虽然大方向在第一天就已经确定了,但代码的实现还有部分功能复现还是走了一些弯路。
关于资料:我选择的是知网和同方,遇到问题有CSDN和mathwork,总的来说,这道题比较难上手,但比较对我们组的方向。
还有的话,蕾娜图真是拿都在用,我已经见过无数个版本了。
现就问题A简述我们当时对边缘检测问题的思考与分析:
2021APMCM问题A
问题背景
Problem A
Image Edge Analysis and Application
With the development of science and technology, the demand for measurement accuracy of various workpieces and parts is getting higher and higher, and the requirements for measurement instruments are also getting more and more demanding. Various image measuring equipment such as digital image size measuring instrument are now gradually replacing the traditional manual caliper measurement application. Generally, after the camera is calibrated, based on the the dot matrix or checkerboard feature information of the calibrated image, the image can be corrected for distortion and the mapping relationship between the image coordinate space and the world coordinate space can be calculated.
The edge of the target object is very useful for image recognition and computer analysis. Image edge is the reflection of discontinuity of the local characteristics of an image. The edge can outline the target object and make it clear to the observer at a glance. The edge contains rich intrinsic information (such as orientation, step property and shape, etc.), which is an important attribute for extracting image features in image recognition. Image edge contour extraction is a very important processing in boundary segmentation and also a classical problem in image processing. The purpose of both contour extraction and contour tracking is to obtain the external contour features of an image. Applying certain methods where necessary to express the features of the contours to prepare for image shape analysis has a significant impact on performing high-level processing such as feature description, recognition and understanding.
The contour can be described as a set of ordered points, and the common expression of the contour is a polygon. Contours can be either closed or open. The closed contours on an image are all connected start to end, and the open contours generally intersect with the image boundary. In Figure 1, there are five closed contour curves. Although edge detection algorithms such as sobel and canny can detect the image edge pixels boundary based on the difference of image gray value, it does not take the contour as a whole. On an image, a contour corresponds to a series of pixel points. The contour describes a continuous sequence of points, and the edge pixel points can be assembled into a contour curve to describe the edge information of the image.
A sub-pixel is a virtual pixel defined between two physical pixels of an image acquisition sensor. To improve resolution or image quality, sub-pixel calculation is very useful. Image sub-pixel edge extraction is a more accurate method than traditional pixel edge extraction. Sub-pixel means that the coordinate value of each pixel point on the image is no longer integer positioning, but floating-point number positioning. If the accuracy is increased to 0.1 pixel using subpixel technique, it is equivalent to 10 times higher resolution of image system analysis.
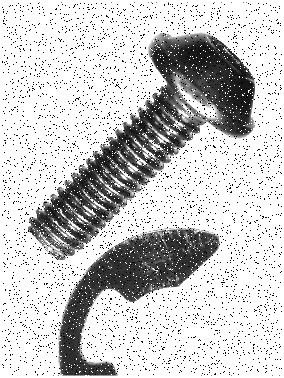
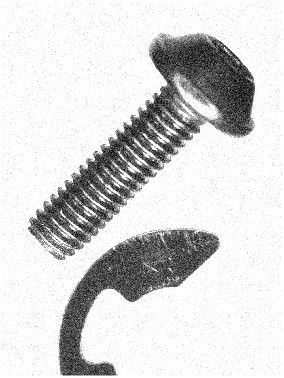
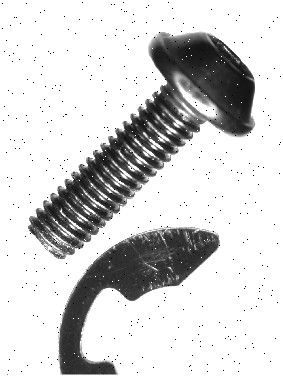
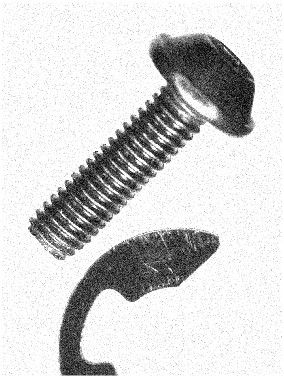
For the following three schematic diagrams, in Figure 1, the object edge contour lines of the image have been extracted and the image edge contour has been segmented into basic graphics such as straight line segments, circular arc segments, and circles. In Figure 2, The edge contour of a rounded rectangle is divided into several geometric shapes. In Figure 3, an elliptical sub-pixel contour curve is shown drawn on the background of a grayscale pixel image grid.
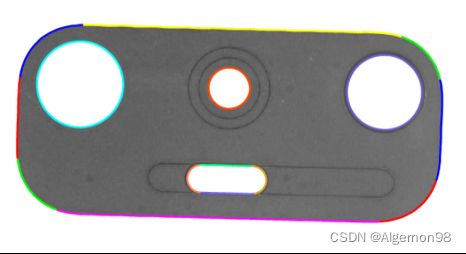
Figure 1. Image Edge Detection

Figure 2. Segmentation Image Edge Contour

Figure 3. Sub-pixel Edge Contour of Image
题目
Question 1
: Build a mathematical model, analyze the method and process of extracting sub-pixel edge with 1/10 pixel accuracy and above, extract sub-pixel edge contour boundaries of the main edge parts of the objects on the three images (Pic1_1, Pic1_2, Pic1_3) in Annex 1, and convert the edge sub-pixel point data into ordered edge contour curve data, with the need to considering how to eliminate the interference effects of edge burrs and shadow parts of the edges. Note that the Pic1_3 image was taken under relatively complex lighting conditions, with more interference information.
a)Please draw the extracted edge contours in different colors on the image, output it as a color edge contour image and save it as png image format for submission. The file names are pic1_1.png, pic1_2.png, pic1_3.png.
b)Output the edge contour data in the format of EdgeContoursOutput.xls file in Annex 1, and output the data of the Pic1_1 and Pic1_2 images to the corresponding Sheet1 and Sheet2 of the worksheet respectively. The output data contains the total edge contours count, the total edge contours length in the image coordinate space, point count and length of each contour curve, and the X and Y coordinate data of each contour point.
c)The total contour curves count on each image and the point count and length data on each curve should be given in the paper. See Table 1, Table 2 and Table 3.
Question 2
:While the measured image is taken, there is a dot matrix calibration plate placed at the same horizontal height of the target object. The diameter of the dots on the calibration plate is 1 mm, and the center distance between two dots is 2 mm. Annex 2 contains three calibration plate images taken at different angles and one product image (Pic2_4.bmp). Please build a mathematical model, use the calibration plate image information to conduct image rectification analysis of the product image and consider how to calculate, as accurately as possible, the actual physical sizes of the edge segmentation fitting curve segments on the product image. Please calculate the length (mm) of each edge contour, and finally calculate the total edge contours length (mm). According to the contour data labeling shown in Figure 4, output the data results of the table format files such as EdgeContoursLengthOutput.xls in Annex 2.

Figure 4. Image Contour Data Labeling
Question 3
: Two sub-pixel contour edge data (EdgeContour1.xls and EdgeContour2.xls) are provided in Annex 3, and the shape are shown in Figure 5. Please build a mathematical model, analyze the automated segmentation and fitting of edge contour curve data into straight line segments, circular arc segments (including circles), or elliptical arc segments (including ellipses), and discuss the model method or strategy for automated segmentation and fitting of edge contours. The blue curve starts from the blue digit 1 label and outputs the model calculation result data along the arrow direction. The green curve starts from the green digit 1 label and outputs the model calculation result data along the arrow direction. Please fill in the parameters of the segmented curve segments into the table in the table format. Submit Table 7 and Table 8 (regarding contour 1 and contour 2 segmentation data) in the paper. Note that the type of the lines in this table is populated according to the actual type.

Figure 5. Edge Contour Curve Data
Remark:
- SweepAngle indicates the sweep angle from the start point to the end point, angular system;
- Size indicates the radius value of specified ellipse or elliptic arc in the X and Y directions;
- RotationAngle indicates the rotation angle value of specified ellipse or elliptic arc, angular system;
- For the direction of rotation angle, the rotation direction from positive direction of x-axis to positive direction of y-axis is positive direction, and vice versa is negative direction.
- All image coordinate points are expressed under the image coordinate system, that is, the upper left corner is the (0,0) origin, the positive direction of the X-axis is to the right, and the positive direction of the Y-axis is downward.
分析
首先,对于这种包含专业术语的问题,及时翻译成中文很重要。在拿到题的半个小时内我就得到了A、B、C三题的word及pdf版本翻译,我们组得以及时讨论确定选择的题目,在这里感谢我的朋友和他的WPS会员。
当然,机翻总会有不完美的时候,在遇到个别词语或句子的问题时还是得一个个查。
多方参考之后,我们对题目得出了一个初步印象:
对所给图片进行边缘检测,并标出边缘,按照题目要求统计不同亚像素结构。
这个时候,就是冈萨雷斯派上用场的时候了。一百六十大洋没有白花。
天阶斗技:“第十章:图像分割”!
从点、线和边缘检测,到多阈值处理,这本书为我们提供了切入问题的关键角度,当然,沿着这个思路再去网上寻找资料,也会明确很多。
基础知识
边缘模型
不同图像灰度不同,边界处一般会有明显的边缘,利用此特征可以分割图像。边缘检测是根据灰度突变来分割图像的一种常用方法。
边缘模型可根据它们的灰度剖面来分类。可以被分为台阶模型、斜坡模型和屋顶边缘模型等。
尽管噪声和边缘会导致边缘偏离理想形状,但利用边缘模型的特性仍可以识别出图像的边缘。在此过程中,我们用“梯度”作为求图像f中任意位置(x,y)处的边缘强度和方向的工具,用∇f表示它,并把它定义为向量。
∇f(x,y)≡grad[f (x,y)]≡ [ g x ( x , y ) g y ( x , y ) ] \begin{bmatrix} g_x (x,y)\\ g_y (x,y) \end{bmatrix} [gx(x,y)gy(x,y)]= [ ∂ f ( x , y ) ∂ x ∂ f ( x , y ) ∂ y ] \begin{bmatrix} \cfrac{\partial f (x,y)}{\partial x}\\ \cfrac{\partial f (x,y)}{\partial y} \end{bmatrix} ⎣⎢⎢⎡∂x∂f(x,y)∂y∂f(x,y)⎦⎥⎥⎤
梯度向量在点(x,y)处的幅度M(x,y)由其欧几里得向量范数给出。
角度是相对于x轴逆时针方向度量的。点(x,y)处边缘的方向与该点处梯度向量的方向正交。
算法
边缘检测子
Sobel 算子是一个离散微分算子。它结合了高斯平滑和微分求导,用来计算图像灰度函数的近似梯度。Sobel算子首先对图像像素做卷积,然后对生成的新像素灰度值做阈值运算,以此来确定边缘信息。
若Gx是对原图x方向上的卷积,Gy是对原图y方向上的卷积。
Sobel 算子对噪声具有平滑抑制作用,但是得到的边缘较粗,且可能出现伪边缘。
Canny边缘检测子基于三个基本目标:低错误率、边缘点应被很好的定位、单个边缘点效应。
基于三个基本目标,对于被加性高斯白噪声污染的一维台阶边缘使用数值最优,可得如下结论,即对最优台阶边缘检测子的一个较好近似是高斯一阶导数。
canny边缘检测算法的步骤小结如下:
1.使用一个高斯滤波器平滑输入图像。
2.计算梯度幅度图像和角度图像。
3.对梯度幅度图像应用非极大值限制。
使用双阈值处理和连通性分析来检测与连接边缘
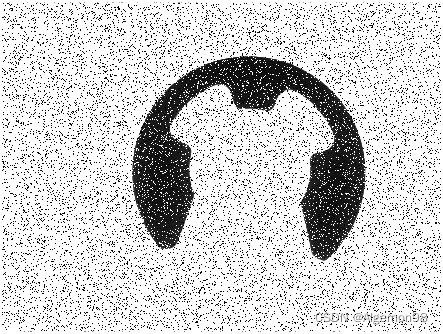
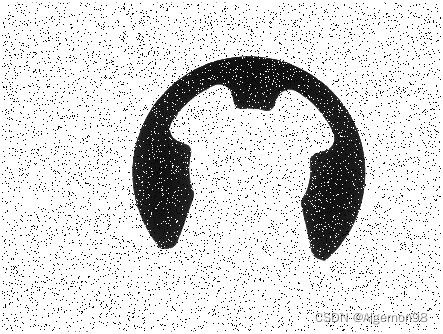
椒盐模糊
椒盐噪声就是在图像上随机出现黑色白色的像素。在指定信噪比SNR(其取值范围在[0, 1]之间)后,计算总像素数目SP,得到要加噪的像素数目,并随机获取要加噪的每个像素位置P(i, j)并指定像素值为255或者0。
降噪
1.邻域平均法是空间域平滑噪声技术,它是一种线性滤波技术.
2.中值滤波的基本原理是把数字图像或数字序列中一点的值用该点的一个邻域中各点值的中值代替。中值滤波器是抑制噪声的非线性处理方法.这种方法运算简单,易于实现,而且能 较好地保护边界‚但有时会失掉图像中的细线和小块区域,采用窗口的大小和形状有时对滤波效果影响很大,同时需要指出的是它对滤除高斯分布的噪声效果不明显。
3.Winner 滤波是使原始图像 f(x,y)及其恢复图像 g(x,y)之间的均方误差最小的复原方法. Wiener 滤波对高斯白噪声的图像滤波与邻域平均法比较,滤波效果好。它比线性滤波器具有更好的选择性,可以更好地保存图像的边缘和高频细节信息。虽然Wiener 滤波在大多数情况下都可以获得满意的结果,尤其对含有白噪声的图像,但在信噪比比较低的情况下,效果往往不能令 人满意。另外,最小均方误差准则与人的视觉效果不一定匹配。
Hough变换
标准 Hough 变换 (SHT) 使用线条的参数化表示:
![]()
变量 rho 是沿垂直于线条的向量从原点到线条的距离。θ是从原点到线条的垂直投影相对于正 x 轴顺时针测量的角度(以度为单位)。θ的范围是 –90° ≤ θ < 90°。线条本身的角度是 θ + 90°,也是相对于正 x 轴顺时针测量的。
Matlab图像处理工具箱中提供了3个与Hough变换相关的函数。函数hough()实现了前面讨论的概念;函数houghpeaks()寻找Hough变换的峰值(累加单元的高计数);函数houghlines()以来自其他两个函数的结果为基础在原始图像中提取线段。
部分图像处理
总结
- 找一个代码写得好的队友很重要,模型出来了运用到实际问题里还是有不少坑,需要对算法进行改进,即使是现成的代码也得看懂,更不用说根据算法写代码了。
- mathtype真香。这篇博文为什么没有太多公式,因为用latex打公式太麻烦啦!
- mathwork上有关于matlab部分算法及功能的介绍,如果在使用时有不懂可以先去上面找找。
- 知网很好用,但关键词要找准,计算机视觉这个大类下,即使是边缘检测也有很多领域的运用,要找准适合比赛题目方向的。
- 有一本专业的书籍在手边会方便很多。
参考资料:冈萨雷斯《图形图像处理》

