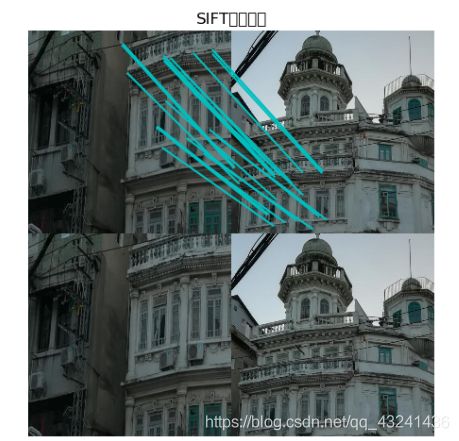
Python计算机视觉——SIFT特征提取与检索
文章目录
-
- SIFT特征提取算法
-
- 1. 定义
- 2. 步骤
- 3. 构造DOG尺度空间
- 4. 图像尺度空间
- 5. 多分辨率金字塔
- 6. 高斯差分金字塔
- 7. 关键点搜索与定位
-
- 7.1 关键点搜索
- 7.2 关键点的精确定位
- 7.3 消除边界响应
- 8. 方向赋值
-
- 8.1 特征点的主方向
- 9. 生成特征描述
- 10. SIFT特征提取与检索实验
-
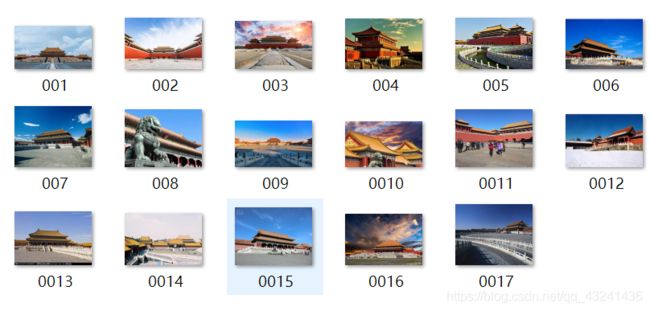
- 10.1 构造数据集
- 10.2 提取数据集中每张图片的SIFT特征并展示
-
-
- Windows解压tar.gz文件办法
- (1)实现数据集中,每张图片的SIFT特征提取,并展示特征点
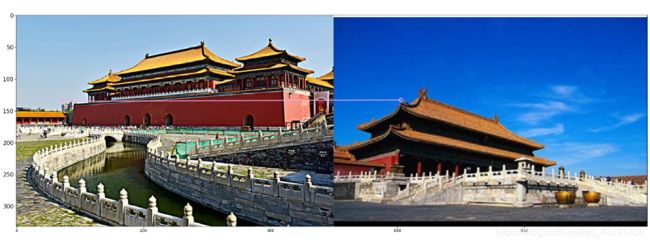
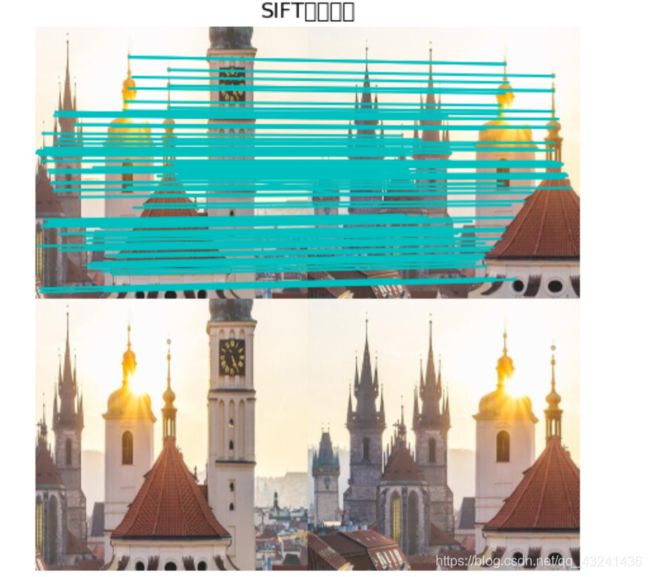
- (2)给定两张图片,计算其SIFT特征匹配结果
-
- python3.7导入lxml,xlwt库
- (3)给定一张输入的图片,在数据集内部进行检索,输出与其匹配最多的三张图片
- (4)匹配地理标记图像
- (5) 图像全景拼接 RANSAC
-
- 1.景深丰富
- 2.景深单一
-
- 11. 总结与结论
SIFT特征提取算法
1. 定义
SIFT的全称是Scale Invariant Feature Transform,尺度不变特征变换。是在不同的尺度空间上查找关键点(特征点),并计算出关键点的方向。SIFT所查找到的关键点是一些十分突出、不会因光照、仿射变换和噪音等因素而变化的点,如角点、边缘点、暗区的亮点及亮区的暗点等。SIFT特征对旋转、尺度缩放、亮度变化等保持不变性,是一种非常稳定的局部特征。
2. 步骤
- 构建DOG尺度空间
- 关键点搜索和定位
- 方向赋值和特征描述的生成
3. 构造DOG尺度空间
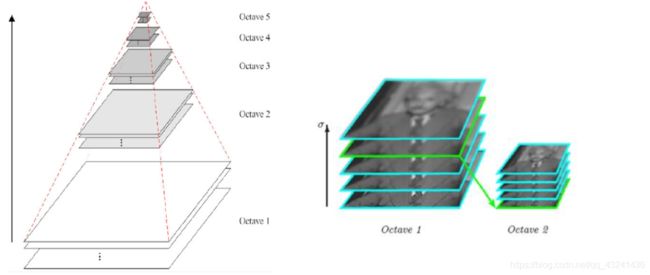
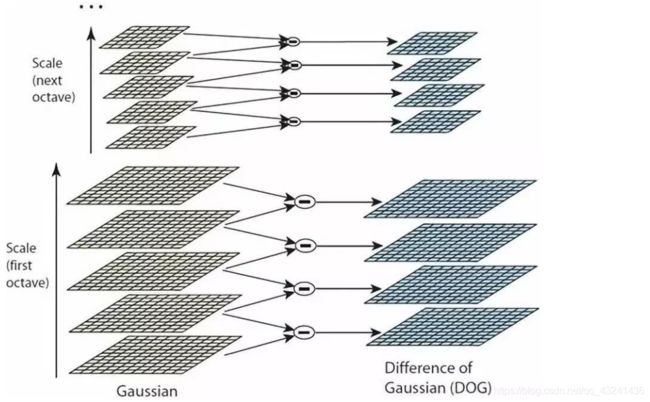
模拟图像数据的多尺度特征,大尺度轮廓特征,小尺度细节特征。通过构建高斯金字塔(每一层用不同的参数σ做高斯模糊(加权)),保证图像在任何尺度都能有对应的特征点,即保证尺度不变性。
4. 图像尺度空间
在一定的范围内,无论物体是大还是小,人眼都可以分辨出来,然而计算机要有相同的能力却很难,所以要让机器能够对物体在不同尺度下有一个统一的认知,就需要考虑图像在不同的尺度下都存在的特点。
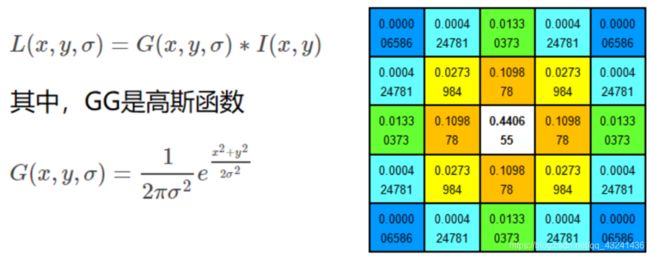
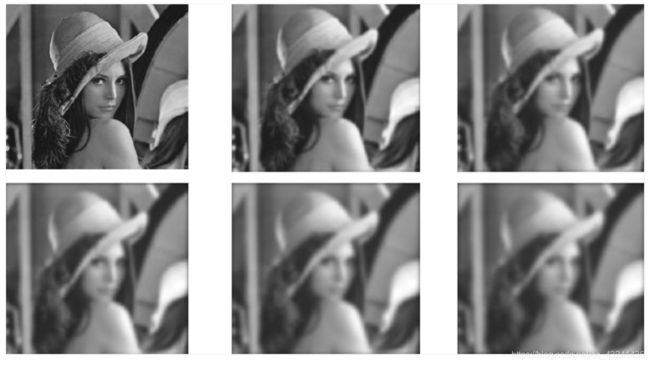
尺度空间的获取通常使用高斯模糊来实现,不同σ的高斯函数决定了对图像的平滑程度,越大的σ值对应的图像越模糊。
5. 多分辨率金字塔
图像金字塔是同一图像在不同的分辨率下得到的一组结果,一个传统的金字塔中,每一层的图像是其上一层图像长、高的各一半。
多分辨率的图像金字塔虽然生成简单,但其本质是降采样,图像的局部特征则难以保持,也就是无法保持特征的尺度不变性。
通过图像的模糊程度来模拟人在距离物体由远到近时物体在视网膜上成像过程,距离物体越近其尺寸越大图像也越模糊,这就是高斯尺度空间。通过结合高斯尺度空间和多分辨率金字塔可以检测出在不同的尺度下都存在的特征点。
6. 高斯差分金字塔
7. 关键点搜索与定位
7.1 关键点搜索
为了寻找尺度空间的极值点,每个像素点要和其图像域(同一尺度空间)和尺度域(相邻的尺度空间)的所有相邻点进行比较,当其大于(或者小于)所有相邻点时,该点就是极值点。如下图所示,中间的检测点要和其所在图像的3×3邻域8个像素点,以及其相邻的上下两层的3×3领域18个像素点,共26个像素点进行比较。

7.2 关键点的精确定位
这些候选关键点是DOG空间的局部极值点,而且这些极值点均为离散的点,精确定位极值点的一种方法是,对尺度空间DoG函数进行曲线拟合,计算其极值点,从而实现关键点的精确定位。


7.3 消除边界响应
8. 方向赋值
8.1 特征点的主方向
每个特征点可以得到三个信息(x,y,σ,θ),即位置、尺度和方向。具有多个方向的关键点可以被复制成多份,然后将方向值分别赋给复制后的特征点,一个特征点就产生了多个坐标、尺度相等,但是方向不同的特征点。
9. 生成特征描述
在完成关键点的梯度计算后,使用直方图统计邻域内像素的梯度和方向。
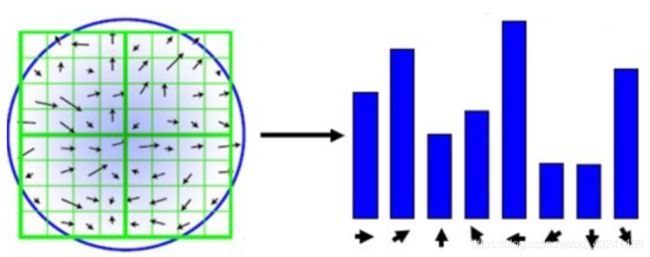
为了保证特征矢量的旋转不变性,要以特征点为中心,在附近邻域内将坐标轴旋转θ角度,即将坐标轴旋转为特征点的主方向。
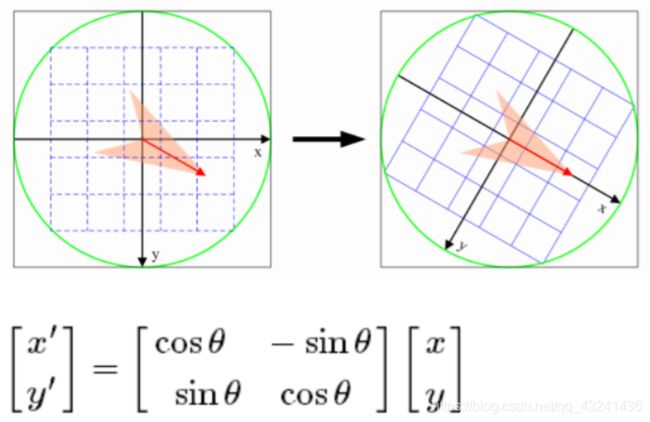
旋转之后的主方向为中心取8x8的窗口,求每个像素的梯度幅值和方向,箭头方向代表梯度方向,长度代表梯度幅值,然后利用高斯窗口对其进行加权运算,最后在每个4x4的小块上绘制8个方向的梯度直方图,计算每个梯度方向的累加值,即可形成一个种子点,即每个特征的由4个种子点组成,每个种子点有8个方向的向量信息。
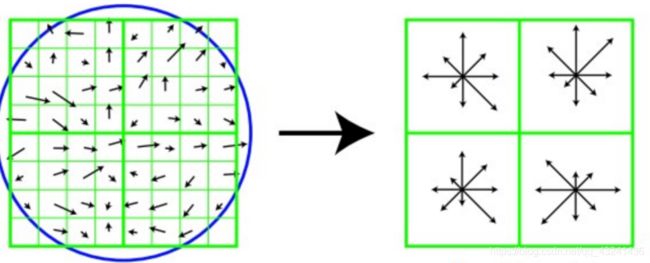
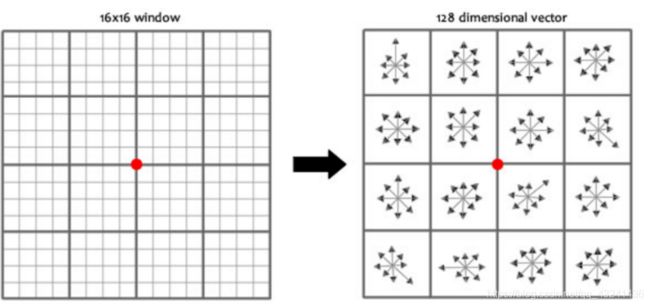
论文中建议对每个关键点使用4x4共16个种子点来描述,这样一个关键点就会产生128维的SIFT特征向量。
参考文档:opencv SIFT特征提取
10. SIFT特征提取与检索实验
10.1 构造数据集
10.2 提取数据集中每张图片的SIFT特征并展示
使用开源工具包VLFeat提供的二进制文件来计算图像的SIFT特征。VLFeat工具包可以从http://www.vlfeat.org/下载,二进制文件可以在所有主要的平台上运行。将下载后的VLFeat解压,选择适合你电脑的位数。注意!!!官网上是最新的VLfeat-0.9.21版本,但最好选择VLfeat-0.9.20版本,如果用最新版本,有的电脑会出现生成的picture1.sift文件为空的情况,导致报错picture1.sift not found
Windows解压tar.gz文件办法

解压后打开bin文件夹下的win64,将其中的sift.exe和vl.dll这两个文件复制到项目的文件夹中。
不过解压完了进行了后续操作,还是报错…这是一个大坑,这是python2.7的解决方法…而我是python3.7
终于知道自己错在哪了…
python3 sift算法的简单实现
emmmmm坑实在是太多了,详解参见opencv-contrib-python,python3.3,SIFT和SURF
最后终于实现了sift算法:
代码:
"""
Created on Sat Sep 29 14:43:02 2018

@author: qgl
"""

import numpy as np
import cv2
from matplotlib import pyplot as plt


imgname = 'C://Users//Garfield//Desktop//dataunion//005.jpg'


sift = cv2.xfeatures2d.SIFT_create()

img = cv2.imread(imgname)
gray = cv2.cvtColor(img, cv2.COLOR_BGR2GRAY)
kp, des = sift.detectAndCompute(img, None)

cv2.imshow('gray', gray)
#cv2.waitKey(0)

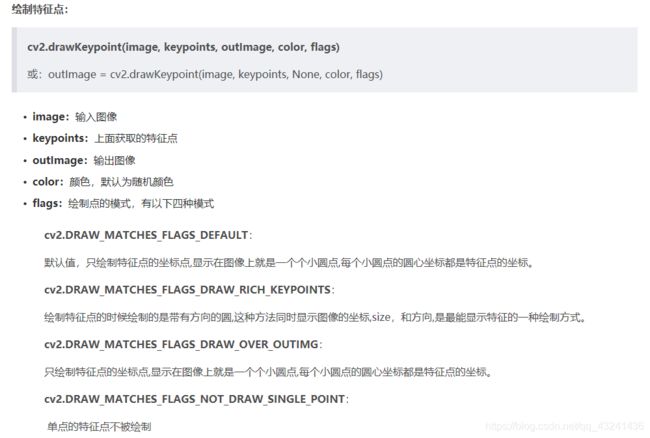
img1 = cv2.drawKeypoints(img, kp, img, color=(255, 0, 255))

cv2.imshow('point', img1)
cv2.waitKey(0)
(1)实现数据集中,每张图片的SIFT特征提取,并展示特征点
代码:
import os.path

import glob

import cv2


def convertjpg(jpgfile, outdir, width=128, height=128):
    src = cv2.imread(jpgfile, cv2.IMREAD_ANYCOLOR)

    try:

        #dst = cv2.resize(src, (width, height), interpolation=cv2.INTER_CUBIC)
        sift = cv2.xfeatures2d.SIFT_create()

        img = cv2.imread(jpgfile)
        gray = cv2.cvtColor(img, cv2.COLOR_BGR2GRAY)
        kp, des = sift.detectAndCompute(img, None)

        #cv2.imshow('gray', gray)
        # cv2.waitKey(0)

        img1 = cv2.drawKeypoints(img, kp, img, color=(255, 0, 255))

        #cv2.imshow('point', img1)
        #cv2.waitKey(0)

        cv2.imwrite(os.path.join(outdir, os.path.basename(jpgfile)), img1)

    except Exception as e:

        print(e)


for jpgfile in glob.glob(r'C://Users//Garfield//Desktop//dataunion//*.jpg'):
    convertjpg(jpgfile, r'C://Users//Garfield//Desktop//dataunion//re')
参考博客:Python-OpenCV 从文件夹中批量读取图片
运行结果:
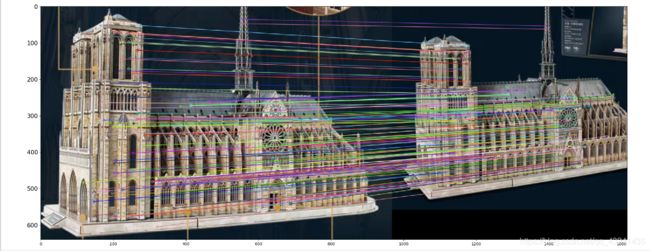
(2)给定两张图片,计算其SIFT特征匹配结果
代码要顺利运行需要安装以下库
python3.7导入lxml,xlwt库
打开cmd,输入
pip3 install lxml
pip install xlwt
另外,还会出现报错 ModuleNotFoundError: No module named ‘cPickle’
![]()
python2有cPickle,但是在python3下,是没有cPickle的;
解决办法:进入到报错目录下,将import cPickle改为
import pickle as pk
或者:
import pandas as pd
import pickle
就都可以了
解决报错:ModuleNotFoundError: No module named ‘tqdm’
pip install tqdm
解决以上问题后终于可以运行了…
代码:
# coding: utf-8
from matplotlib import pyplot as plt
from imagedt.decorator import time_cost
import cv2
print('cv version: ', cv2.__version__)


def bgr_rgb(img):
    (r, g, b) = cv2.split(img)
    return cv2.merge([b, g, r])


def orb_detect(image_a, image_b):
    # feature match
    orb = cv2.ORB_create()

    kp1, des1 = orb.detectAndCompute(image_a, None)
    kp2, des2 = orb.detectAndCompute(image_b, None)

    # create BFMatcher object
    bf = cv2.BFMatcher(cv2.NORM_HAMMING, crossCheck=True)

    # Match descriptors.
    matches = bf.match(des1, des2)

    # Sort them in the order of their distance.
    matches = sorted(matches, key=lambda x: x.distance)

    # Draw first 10 matches.
    img3 = cv2.drawMatches(image_a, kp1, image_b, kp2, matches[:100], None, flags=2)

    return bgr_rgb(img3)

@time_cost
def sift_detect(img1, img2, detector='surf'):
    if detector.startswith('si'):
        print("sift detector......")
        sift = cv2.xfeatures2d.SURF_create()
    else:
        print("surf detector......")
        sift = cv2.xfeatures2d.SURF_create()

    # find the keypoints and descriptors with SIFT
    kp1, des1 = sift.detectAndCompute(img1, None)
    kp2, des2 = sift.detectAndCompute(img2, None)

    # BFMatcher with default params
    bf = cv2.BFMatcher()
    matches = bf.knnMatch(des1, des2, k=2)

    # Apply ratio test
    good = [[m] for m, n in matches if m.distance < 0.5 * n.distance]

    # cv2.drawMatchesKnn expects list of lists as matches.
    img3 = cv2.drawMatchesKnn(img1, kp1, img2, kp2, good, None, flags=2)

    return bgr_rgb(img3)


if __name__ == "__main__":
    # load image
    image_a = cv2.imread('C://Users//Garfield//Desktop//dataunion//005.jpg')
    image_b = cv2.imread('C://Users//Garfield//Desktop//dataunion//006.jpg')

    # ORB
    # img = orb_detect(image_a, image_b)

    # SIFT or SURF
    img = sift_detect(image_a, image_b)

    plt.imshow(img)
    plt.show()
(3)给定一张输入的图片,在数据集内部进行检索,输出与其匹配最多的三张图片
将图片的特征数据进行保存,每次匹配时,只需读取特征数据进行匹配即可。我们以下图为例:
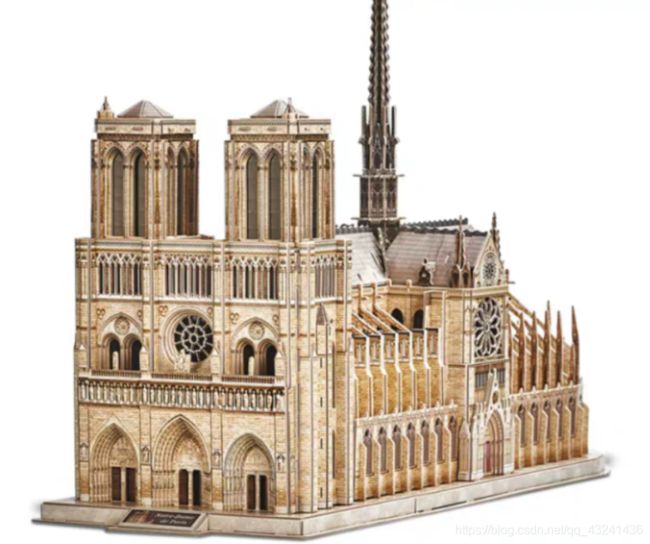

根据图1在图2中查找最佳匹配的图片。首先获取图2的全部图片的特征数据,将代码保存在features.py:
import cv2
import numpy as np
from os import walk
from os.path import join

def create_descriptors(folder):
    files = []
    for (dirpath, dirnames, filenames) in walk(folder):
        files.extend(filenames)
    for f in files:
        if '.png' in f:
            save_descriptor(folder, f, cv2.xfeatures2d.SIFT_create())

def save_descriptor(folder, image_path, feature_detector):
    # 判断图片是否为npy格式
    if image_path.endswith("npy"):
        return
    # 读取图片并检查特征
    img = cv2.imread(join(folder,image_path), 0)
    keypoints, descriptors = feature_detector.detectAndCompute(img, None)
    # 设置文件名并将特征数据保存到npy文件
    descriptor_file = image_path.replace("png", "npy")
    np.save(join(folder, descriptor_file), descriptors)

if __name__=='__main__':
    path = 'C://Users//Garfield//Desktop//dataunion'
    create_descriptors(path)
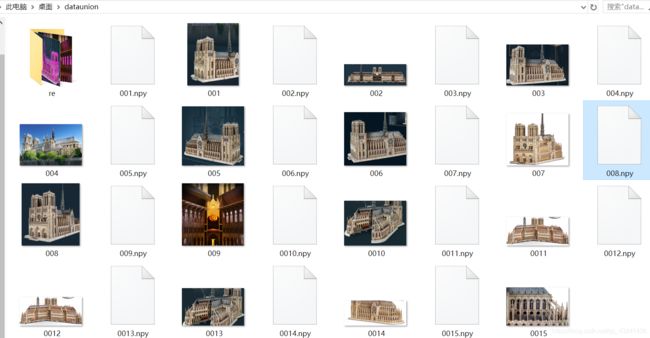
运行后结果如图所示:
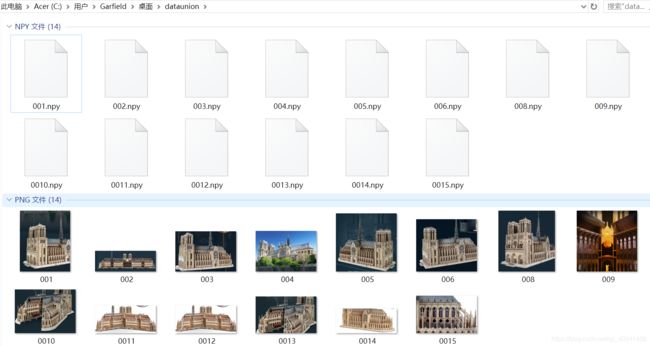
将图片的特征数据保存在npy文件。下一步是根据图1与这些特征数据文件进行匹配,从而找出最佳匹配的图片。代码存在matching.py:
from os.path import join
from matplotlib import pyplot as plt
from os import walk
import numpy as np
import cv2

query = cv2.imread('C://Users//Garfield//Desktop//007.png', 0)
folder = 'C://Users//Garfield//Desktop//dataunion'
descriptors = []
# 获取特征数据文件名
for (dirpath, dirnames, filenames) in walk(folder):
    for f in filenames:
        if f.endswith("npy"):
            descriptors.append(f)
    print(descriptors)

# 使用SIFT算法检查图像的关键点和描述符
sift = cv2.xfeatures2d.SIFT_create()
query_kp, query_ds = sift.detectAndCompute(query, None)

# 创建FLANN匹配器
index_params = dict(algorithm=0, trees=5)
search_params = dict(checks=50)
flann = cv2.FlannBasedMatcher(index_params, search_params)

potential_culprits = {}
for d in descriptors:
    # 将图像query与特征数据文件的数据进行匹配
    matches = flann.knnMatch(query_ds, np.load(join(folder, d)), k=2)
    # 清除错误匹配
    good = []
    for m, n in matches:
        if m.distance < 0.7 * n.distance:
            good.append(m)
    # 输出每张图片与目标图片的匹配数目
    print("img is %s ! matching rate is (%d)" % (d, len(good)))
    potential_culprits[d] = len(good)

max_matches = None
potential_suspect = None
for culprit, matches in potential_culprits.items():
    if max_matches == None or matches > max_matches:
        max_matches = matches
        potential_suspect = culprit


print("potential suspect is %s" % potential_suspect.replace("npy", "").upper())
代码运行后,输出结果如图所示:
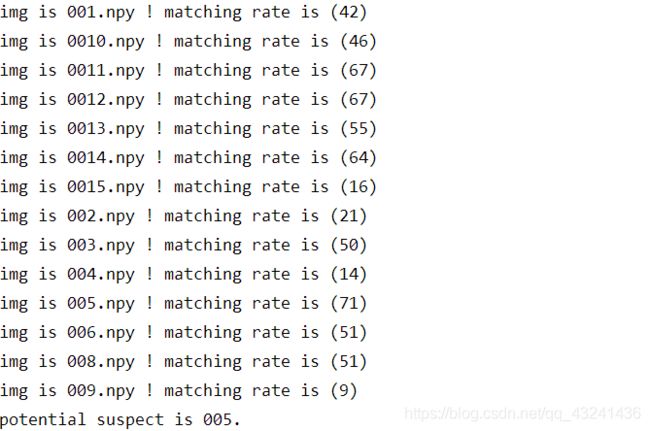
从输出的结果可以看到,图1与图2的005.png最为匹配,如图所示:
参考文档:Python 使用Opencv实现图像特征检测与匹配
(4)匹配地理标记图像
首先要安装graphviz和pydot,确保安装顺序正确:graphviz->grapphviz软件本身->pydot
参考文档 匹配地理标记图像
完成安装
成功的在python3.7环境下使用vlfeat实现了sift算法:
参考文档 https://blog.csdn.net/weixin_43837871/article/details/88604483
代码:
1.提取特征点
先对图像使用SIFT特征提取代码进行处理,并且将特征保存在和图像同名(但文件名是.sift,而不是.jpg)的文件路径下。
问题:这里一直出现报错
解决办法:
将上图代码部分改成 featlist = [‘out_sift_1.txt’ for imname in imlist]
from pylab import *
from PIL import Image
import pydot
from PCV.tools.imtools import get_imlist
import sift

""" This is the example graph illustration of matching images from Figure 2-10.
To download the images, see ch2_download_panoramio.py."""

#download_path = "panoimages"  # set this to the path where you downloaded the panoramio images
#path = "/FULLPATH/panoimages/"  # path to save thumbnails (pydot needs the full system path)

download_path = "C://Users//Garfield//Desktop//dataunion//le//"  # set this to the path where you downloaded the panoramio images
path = "C://Users//Garfield//Desktop//dataunion//le//"  # path to save thumbnails (pydot needs the full system path)

imlist = get_imlist(download_path)
nbr_images = len(imlist)


featlist = ['out_sift_1.txt' for imname in imlist]
for i, imname in enumerate(imlist):
    sift.process_image(imname, featlist[i])
2.使用局部描述子匹配
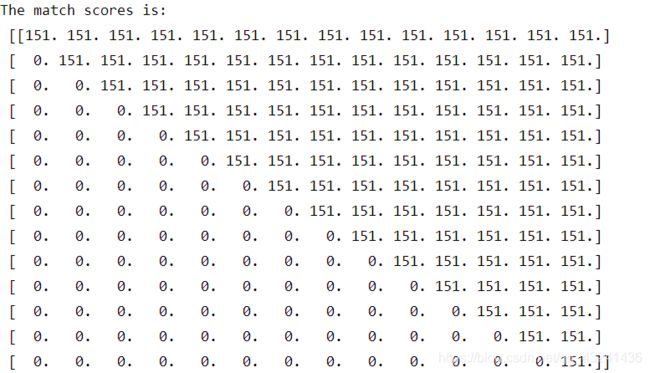
对所有的组合图像进行逐个匹配,将每对图像间的匹配特征数保存在matchscores数组中。
matchscores = zeros((nbr_images, nbr_images))

for i in range(nbr_images):
    for j in range(i, nbr_images):  # only compute upper triangle
        print('comparing ', imlist[i], imlist[j])
        l1, d1 = sift.read_features_from_file(featlist[i])
        l2, d2 = sift.read_features_from_file(featlist[j])
        matches = sift.match_twosided(d1, d2)
        nbr_matches = sum(matches > 0)
        print('number of matches = ', nbr_matches)
        matchscores[i, j] = nbr_matches
print("The match scores is: \n", matchscores)
for i in range(nbr_images):
    for j in range(i + 1, nbr_images):  # no need to copy diagonal
        matchscores[j, i] = matchscores[i, j]
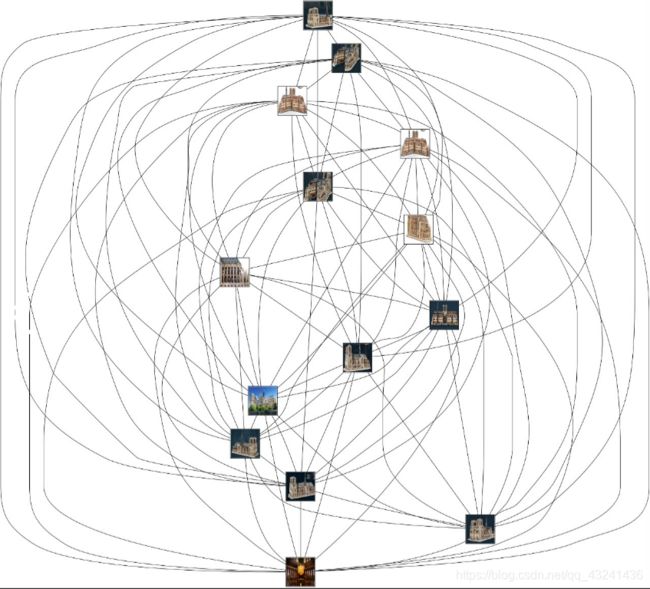
3.可视化连接图像
为了创建显示可能图像组的图,如果匹配的数目高于一个阈值,我们使用边来连接相应的图像节点。为了得到图中的图像,需要使用图像的全路径(使用path变量表示)
结尾处g.write_png()方法里面要给出图片要存的完整路径,否则无图片写入。
#可视化

threshold = 2  # min number of matches needed to create link

g = pydot.Dot(graph_type='graph')  # don't want the default directed graph

for i in range(nbr_images):
    for j in range(i + 1, nbr_images):
        if matchscores[i, j] > threshold:
            # first image in pair
            im = Image.open(imlist[i])
            im.thumbnail((100, 100))
            filename = path + str(i) + '.png'
            im.save(filename)  # need temporary files of the right size
            g.add_node(pydot.Node(str(i), fontcolor='transparent', shape='rectangle', image=filename))

            # second image in pair
            im = Image.open(imlist[j])
            im.thumbnail((100, 100))
            filename = path + str(j) + '.png'
            im.save(filename)  # need temporary files of the right size
            g.add_node(pydot.Node(str(j), fontcolor='transparent', shape='rectangle', image=filename))
            g.add_edge(pydot.Edge(str(i), str(j)))
g.write_png('C://Users//Garfield//Desktop//dataunion//le//paris.png')
- 另外,要确保程序成功运行,应使用.jpg类型文件,为使程序运行速度不至于太慢,可以对文件内图片统一进行修改成相同(较小的)尺寸,可以减少需要检测的像素点,加快运行速度。如果不是统一尺寸,程序也会报错。统一尺寸的修改代码在上面有链接。
- 本次进行实验的数据集主要是角度的不同,通过实验结果可以看到匹配度相较而言会比较好。
(5) 图像全景拼接 RANSAC
RANSAC是“RANdom SAmple Consensus(随机抽样一致)”的缩写。它可以从一组包含“局外点”的观测数据集中,通过迭代方式估计数学模型的参数。它是一种不确定的算法——它有一定的概率得出一个合理的结果;为了提高概率必须提高迭代次数。
RANSAC的基本假设是:
(1)数据由“局内点”组成,例如:数据的分布可以用一些模型参数来解释;
(2)“局外点”是不能适应该模型的数据;
(3)除此之外的数据属于噪声。
局外点产生的原因有:噪声的极值;错误的测量方法;对数据的错误假设。
RANSAC也做了以下假设:给定一组(通常很小的)局内点,存在一个可以估计模型参数的过程;而该模型能够解释或者适用于局内点。
RANSAC的算法步骤:
1.随机选择四对匹配特征
2.根据DLT计算单应矩阵 H (唯一解)
3.对所有匹配点,计算映射误差ε= ||pi’, H pi||
4.根据误差阈值,确定inliers(例如3-5像素)
5.针对最大inliers集合,重新计算单应矩阵 H
在上面原理介绍中,有两个重要的参数需要设置,即采样次数和阈值。
当数据过大的时候,若采集所有样本会造成算法复杂度过高,计算难度加大。Fischler和Bolles通过概率统计的方法得出了采样次数与数据中外点比例和得到一个好样本概率之间的数学关系。

其中K为需要采样的次数,z为获取一个好样本的概率,一般设为99%;w为点集中inliers的比例,一般可以在初始时设置一个较小值,如0.1,然后迭代更新;n为模型参数估计需要的最小点个数,通常设置为2,直线拟合最少需要2个点。
阈值一般根据经验来设定,当观测误差符合0均值和sigma标准差的高斯分布时,则可以计算距离阈值。当inliers被接受的概率为95%时,阈值t2=3.84σ2。
全景拼接流程
1、针对某个场景拍摄多张/序列图像
2、通过匹配特征(sift匹配)计算下一张图像与上一张图像之间的变换结构。
3、图像映射,将下一张图像叠加到上一张图像的坐标系中
4、变换后的融合/合成
重复上述过程
代码:
from pylab import *
from numpy import *
from PIL import Image

# If you have PCV installed, these imports should work
from PCV.geometry import homography, warp
import sift
from PCV.tools.imtools import get_imlist
"""
This is the panorama example from section 3.3.
"""

# set paths to data folder

#featname = ['C://Users//Garfield//Desktop//towelmatch//' + str(i + 1) + 'out_sift_1.txt' for i in range(5)]
#imname = ['C://Users//Garfield//Desktop//towelmatch//' + str(i + 1) + '.jpg' for i in range(5)]
imname = ['C://Users//Garfield//Desktop//towelmatch//re//' + str(i + 1) + '.jpg' for i in range(5)]

download_path = "C://Users//Garfield//Desktop//towelmatch//re//"  # set this to the path where you downloaded the panoramio images

imlist = get_imlist(download_path)

l = {}
d = {}
featname = ['out_sift_1.txt' for imna in imlist]
for i, imna in enumerate(imlist):
    sift.process_image(imna, featname[i])
    l[i], d[i] = sift.read_features_from_file(featname[i])


# extract features and match
# l = {}
# d = {}
# for i in range(5):
#     sift.process_image(imname[i], featname[i])
#     l[i], d[i] = sift.read_features_from_file(featname[i])

matches = {}
for i in range(4):
    matches[i] = sift.match(d[i + 1], d[i])

# visualize the matches (Figure 3-11 in the book)
# sift匹配可视化
for i in range(4):
    im1 = array(Image.open(imname[i]))
    im2 = array(Image.open(imname[i + 1]))
    figure()
    sift.plot_matches(im2, im1, l[i + 1], l[i], matches[i], show_below=True)


# function to convert the matches to hom. points
# 将匹配转换成齐次坐标点的函数
def convert_points(j):
    ndx = matches[j].nonzero()[0]
    fp = homography.make_homog(l[j + 1][ndx, :2].T)
    ndx2 = [int(matches[j][i]) for i in ndx]
    tp = homography.make_homog(l[j][ndx2, :2].T)

    # switch x and y - TODO this should move elsewhere
    fp = vstack([fp[1], fp[0], fp[2]])
    tp = vstack([tp[1], tp[0], tp[2]])
    return fp, tp


# estimate the homographies
# 估计单应性矩阵
model = homography.RansacModel()

fp, tp = convert_points(1)
H_12 = homography.H_from_ransac(fp, tp, model)[0]  # im 1 to 2  # im1 到 im2 的单应性矩阵


fp, tp = convert_points(0)
H_01 = homography.H_from_ransac(fp, tp, model)[0]  # im 0 to 1

tp, fp = convert_points(2)  # NB: reverse order
H_32 = homography.H_from_ransac(fp, tp, model)[0]  # im 3 to 2

tp, fp = convert_points(3)  # NB: reverse order
H_43 = homography.H_from_ransac(fp, tp, model)[0]  # im 4 to 3

# warp the images
# 扭曲图像

delta = 2000  # for padding and translation 用于填充和平移

im1 = array(Image.open(imname[1]), "uint8")
im2 = array(Image.open(imname[2]), "uint8")
im_12 = warp.panorama(H_12, im1, im2, delta, delta)

im1 = array(Image.open(imname[0]), "f")
im_02 = warp.panorama(dot(H_12, H_01), im1, im_12, delta, delta)

im1 = array(Image.open(imname[3]), "f")
im_32 = warp.panorama(H_32, im1, im_02, delta, delta)

im1 = array(Image.open(imname[4]), "f")
im_42 = warp.panorama(dot(H_32, H_43), im1, im_32, delta, 2 * delta)
imsave('jmu2.jpg', array(im_42, "uint8"))
figure()
imshow(array(im_42, "uint8"))
axis('off')
show()
代码根据自身的运行环境略改动过,仅供部分参考。
参考博客:计算机视觉学习4_python_RANSAC_全景拼接
代码有涉及的一些原理详解也可参见博客 python–基于RANSAC的图像全景拼接
1.景深丰富
运行结果①:
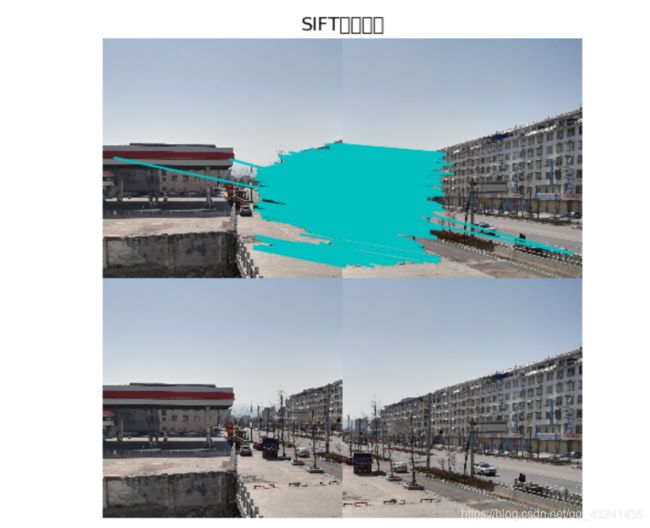


最后拼接出来的效果如上图,不知道为什么很模糊…不过还是隐约可以看出来有拼接的痕迹,总的来说效果还比较好,拼接没有特别大出入(右图来说),左图可以看到明显的落差。
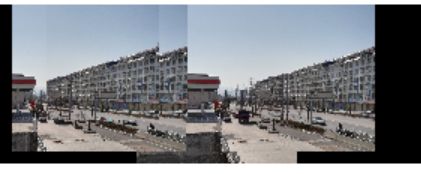
把像素调高了一点。
运行结果②:
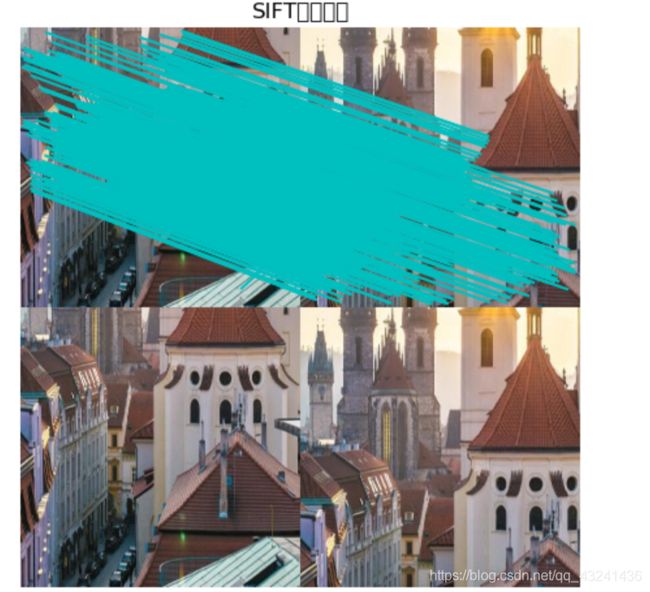
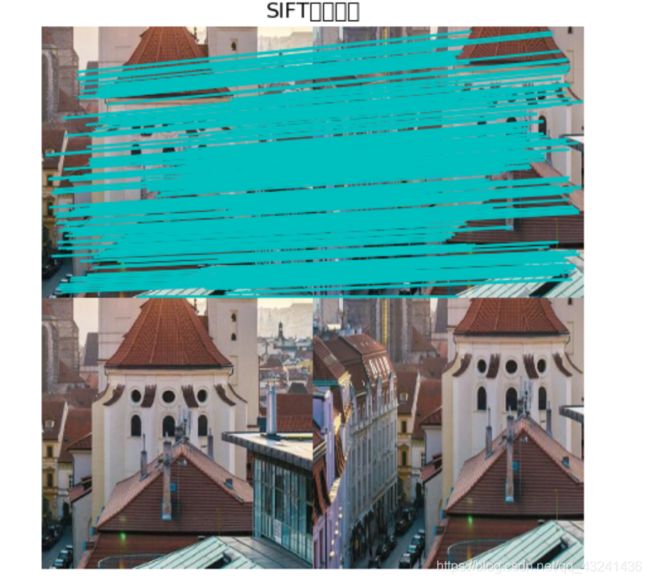
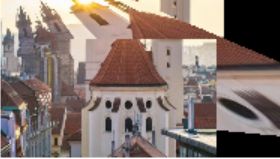
结果拼接的相当扭曲,可以推测出落差大的图片失真率较高,拼接效果也比落差小的差,扭曲程度较大。
于是我又运行了一次:


这次效果相对较好。后面又再运行了几次,都是这样的效果,大概是第一次没匹配好,导致结果异常。
同样,建筑物拼接的并不平滑。
2.景深单一

可以看到拼接的结果会比较平滑,都在同一参考线上,景深单一拼接的更理想。
解决方法:
1.把
import matplotlib.delaunay as md
改成
from scipy.spatial import Delaunay
2.进入到PCV\geometry\warp.py,把triangulate_points(x,y)里面的代码替换成
tri = Delaunay(np.c_[x,y]).simplices
- 另外,用于测试的场景图需要等尺寸的,否则会出现报错:
ValueError: all the input arrays must have same number of dimensions, but the array at index 0 has 3 dimension(s) and the array at index 1 has 2 dimension(s)
2.did not meet fit acceptance criteria
- 可能是图片尺寸过小,我最后设置成了1000*1000的分辨率,不过运行时间会延长。但如果分辨率太小会导致找不到相匹配的特征点。
- 另外,测试图片为五张,放在同一个文件夹中,名字最好分别命名为1.jpg、2.jpg…
3.RuntimeWarning: Glyph 37197 missing from current font.
警告原因,plt 画图是找不到字体,需要手动设置:
- 解决方法:参照这个博客,不过我也还没解决,好像并不影响最后的结果
4 RuntimeWarning: divide by zero encountered in true_divide
row /= points[-1]
这个错误提示我们遇到了无效值,可以通过导入numpy库里的方法来解决:
 import numpy as np
 np.seterr(divide='ignore', invalid='ignore')
5.小结:
- 落差大的图片失真率较高,拼接效果也比落差小的差,扭曲程度较大。
- sift特征匹配无法对边缘光滑的目标准确提取特征点,会导致拼接效果不太好。
参考博客:
【计算机视觉】图像全景拼接 RANSAC
计算机视觉——全景拼接原理及其应用
11. 总结与结论
Sift算法就是用不同尺度(标准差)的高斯函数对图像进行平滑,然后比较平滑后图像的差别,差别大的像素就是特征明显的点。
SIFT特征是基于物体上的一些局部外观的兴趣点而与影像的大小和旋转无关。对于光线、噪声、微视角改变的容忍度也相当高。基于这些特性,它们是高度显著而且相对容易撷取,在母数庞大的特征数据库中,很容易辨识物体而且鲜有误认。使用SIFT特征描述对于部分物体遮蔽的侦测率也相当高,甚至只需要3个以上的SIFT物体特征就足以计算出位置与方位。在现今的电脑硬件速度下和小型的特征数据库条件下,辨识速度可接近即时运算。SIFT特征的信息量大,适合在海量数据库中快速准确匹配。
本次实验对于SIFT特征提取与检索的原理有了一个更深刻的理解,并且深刻体会到搭建好运行环境的重要性,python3与python2的不兼容导致实验过程中遇到了许多问题,而解决问题的时候一定要先考虑是不是版本不兼容的问题,最后还要注意语法,多读代码。
