【基础汇总】——python数据分析必备三大工具
目录
- 前言
- 一、numpy
-
- 1、数组创建
- 2、数组运算
- 3、矩阵运算
- 二、pandas
-
- 1、数据结构
- 2、数据处理
-
- 2.1、数据结构与描述性统计
- 2.2、切片访问与缺失处理
- 2.3、多表合并
- 三、matplotlib
-
- 1、matplotlib图形绘制
-
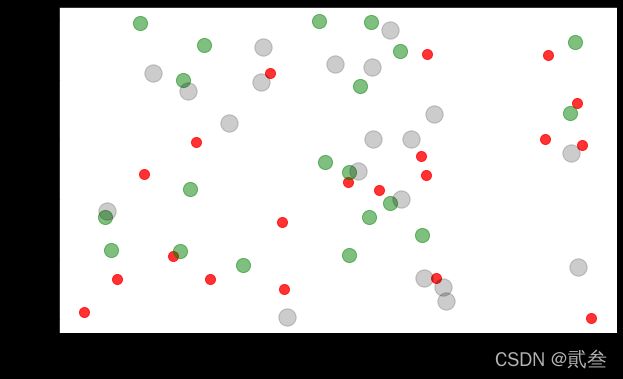
- 1.1、绘制散点图
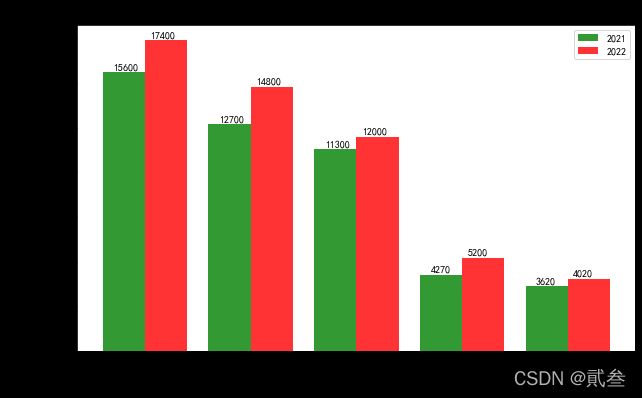
- 1.2、绘制柱状图
- 1.3、绘制饼状图
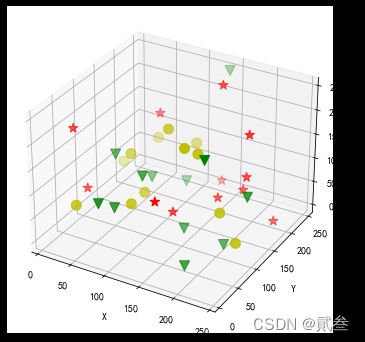
- 1.4、绘制3D图
- 2、seaborn图形绘制
- 3、实际案例
- 结语
前言
之前写了那么多的关于金融数据分析的实战案例,我想是时候将这些例子中的使用到的python基础知识进行总结了……
想要学好数据分析,必须掌握的numpy、pandas、matplotlib三大数据分析相关库的知识,收藏这一篇万字长文就足够了!!!
一、numpy
numpy为python提供了大量高效实现复杂数组和矩阵运算的函数
1、数组创建
import numpy as np
# 32位整数型数组
a = np.array([1,2,3])
print('a = ', a)
print('数组元素类型:', a.dtype)

Out:	a = [1 2 3]
		数组元素类型:int32
# 浮点数型数组
b = np.array([1.2, 2.3, 3.4])
print('b = ', b)
print('数组元素类型:', b.dtype)

Out:	b = [1.2 2.3 3.4]
		数组元素类型:float64
# 复数型数组
c = np.array([[1,2],[3,4]], dtype=np.complex64)
print('c = ', c)
print('数组元素类型:', c.dtype)

Out:	c =  [[1.+0.j 2.+0.j]
 		[3.+0.j 4.+0.j]]
		数组元素类型:complex64
# 二维数组
d = np.array([(1.2, 2.3),(3, 4)])
print('d = ', d)
print('数组元素类型:', d.dtype)

Out:	d =  [[1.2 2.3]
 		[3.  4. ]]
		数组元素类型: float64
# 生成3*4的二维数组,并用0填充
e = np.zeros((3,4))
print('e = ', e)
print('数组元素类型:', e.dtype)

e =  [[0. 0. 0. 0.]
 [0. 0. 0. 0.]
 [0. 0. 0. 0.]]
数组元素类型: float64
# 生成2*3*4的三维数组,并用1填充,元素类型限定为int16
f = np.ones((2,3,4), dtype=np.int16)
print('f = ', f)
print('数组元素类型:', f.dtype)

f =  [[[1 1 1 1]
  [1 1 1 1]
  [1 1 1 1]]

 [[1 1 1 1]
  [1 1 1 1]
  [1 1 1 1]]]
数组元素类型: int16
# 生成数组h,取值范围[0,2),步长0.3
h = np.arrange(0, 2, 0.3)
print('h = ', h)
print('数组元素类型:', h.dtype)

h =  [0.  0.3 0.6 0.9 1.2 1.5 1.8]
数组元素类型: float64
numpy使用ndarray类对象来处理多维数组,ndarray一些可以直接访问的属性:
| 属性名 | 含义 |
|---|---|
| ndarray.ndim | 数组轴的个数 |
| ndarray.shape | 数组的形状 |
| ndarray.size | 数组中元素的总数 |
| ndarray.dtype | 数组中元素的数据类型 |
| ndarray.itemsize | 数组中每个元素的字节大小 |
| ndarray.data | 实际数组元素的缓冲区 |
# 数组x,取值范围[0,14),步长1,
x = np.arange(15).reshape(3,5)
print('x = ', x)
print('数组轴的个数:',x.ndim)
print('数组的形状:',x.shape)
print('数组中元素的总数:',x.size)
print('数组中元素的数据类型:',x.dtype)
print('数组中每个元素的字节大小:',x.itemsize)
print('实际数组元素的缓冲区:',x.data)

x =  [[ 0  1  2  3  4]
 [ 5  6  7  8  9]
 [10 11 12 13 14]]
数组轴的个数: 2
数组的形状: (3, 5)
数组中元素的总数: 15
数组中元素的数据类型: int32
数组中每个元素的字节大小: 4
实际数组元素的缓冲区: <memory at 0x0000024C2033D708>
numpy数组输出基本规则:一维数组输出成行,二维数组输出为矩阵,三维数组输出为矩阵列表。
2、数组运算
a = np.array([20,30,40,50])
b = np.arange(4)
print('a = ',a)
print('b = ',b)

a =  [20 30 40 50]
b =  [0 1 2 3]
# 数组减法运算
c = a - b
print('c = (a - b) = ',c)

c = (a - b) =  [20 29 38 47]
# 数组元素乘方
b_2 = b**2
print('b_2 = b * b = ',b_2)

b_2 = b * b =  [0 1 4 9]
# 数组元素求正弦值
a_sin = np.sin(a)
print('a_sin = sin(a) = ',a_sin)

a_sin = sin(a) =  [ 0.91294525 -0.98803162  0.74511316 -0.26237485]
# 数组元素条件运算
a_cond = (a<35)
print('a_cond = (a<35) = ',a_cond)
# 输出数组中满足条件的元素
print('a数组中小于35的元素是:',a[a<35])

a_cond = (a<35) =  [ True  True False False]
a数组中小于35的元素是: [20 30]
# 数组加法、乘法运算
# 'a+=b'相当于'a=a+b'
# 其他运算同理
f = np.ones((2,3),dtype=np.int)
g = np.random.random((2,3))
print('f = ',f)
print('g = ',g)
f*=3
g+=f
print('f = ',f)
print('g = ',g)

f =  [[1 1 1]
 [1 1 1]]
g =  [[0.48818655 0.14805382 0.24190023]
 [0.23753093 0.87251939 0.53028234]]
f =  [[3 3 3]
 [3 3 3]]
g =  [[3.48818655 3.14805382 3.24190023]
 [3.23753093 3.87251939 3.53028234]]
# 数组的和、最大值、最小值
print('g.sum()=',g.sum())
print('g.min()=',g.min())
print('g.max()=',g.max())

g.sum()= 20.518473272469617
g.min()= 3.1480538249037986
g.max()= 3.872519388164515
# 按指定的轴axis进行运算
print('axis=0,表示按列进行运算,g.max(axis=0)=',g.max(axis=0))
print('axis=1,表示按行进行运算,g.max(axis=1)=',g.max(axis=1))

axis=0,表示按列进行运算,g.max(axis=0)= [3.48818655 3.87251939 3.53028234]
axis=1,表示按行进行运算,g.max(axis=1)= [3.48818655 3.87251939]
# 对数组进行排序
h = np.random.random(15)
print('h = ',h)
print('排序后的h = ',np.sort(h))

h =  [0.05010685 0.16184821 0.59109447 0.98844731 0.68039122 0.13331593
 0.61283281 0.49090379 0.30930569 0.0817642  0.30148594 0.18140083
 0.03374513 0.75961934 0.990532  ]
排序后的h =  [0.03374513 0.05010685 0.0817642  0.13331593 0.16184821 0.18140083
 0.30148594 0.30930569 0.49090379 0.59109447 0.61283281 0.68039122
 0.75961934 0.98844731 0.990532  ]
numpy常见函数:
| 函数名 | 功能 |
|---|---|
| np.array(X)或np.array(X, dtype) | 将数据转化为一个ndarray;数组中元素类型为dtype |
| np.asarray(array) | cope一个新的数组 |
| np.ones(X)或np.ones(X, dtype)或np.ones_like(array) | 形成一个元素全为1的数组;数组中元素类型为dtype;形状与参数array相同 |
| np.zeros(X)或np.zeros(X, dtype)或np.zeros_like(array) | 形成一个元素全为0的数组;数组中元素类型为dtype;形状与参数array相同 |
| np.empty(X)或np.empty(X, dtype)或np.empty_like(array) | 形成一个未初始化的数组;数组中元素类型为dtype;形状与参数array相同 |
| np.eye(N)或np.identity(N) | 形成一个N*N维的数组,对角线为1,其余为0 |
| np.arange(num)或np.arange(begin,end)或np.arange(begin,end,step) | 形成一个[0,num-1)的数组;形成一个[begin,end-1)的数组;步长为step |
| np.mershgrid(ndarray,…) | 生成一个ndarray*ndarray*…的多维ndarray |
| np.where(cond,ndarray1,ndarray2) | 根据条件cond,选取ndarray1或ndarray2 |
| np.in1d(ndarray,[a,b,…]) | 检查ndarray中是否有元素等于[a,b,…],返回bool数组 |
| np.diag(ndarray)或np.diag([x,y…]) | 以一维数组形式返回方阵的对角线;将一维数组转化为方阵 |
| np.dot(ndarray,ndarray) | 矩阵乘法 |
| np.trace(ndarray) | 对角线元素和 |
| np.sort(ndarray)或np.unique(ndarray) | 排序;排除重复元素再排序 |
| np.save(string.ndarray) | 将ndarray保存为string.npy的文件中 |
| np.savez(string,ndarray1,ndarray2…) | 将所有ndarray压缩保存为string.npy的文件中 |
| np.savetxt(string,ndarray,fmt,newline=‘\n’) | 将ndarray保存到fmt格式的文件中 |
| np.load(string) | 读取文件转化为ndarray对象 |
| np.loadtxt(string,delimiter) | 读取文件,以delimiter为分隔符转化为ndarray对象 |
3、矩阵运算
矩阵式金融数据分析的重要数据结构之一。矩阵运算主要包括:生成矩阵、矩阵加减乘除,点积和内积运算、矩阵转置、矩阵特征值和特征向量,矩阵行列式值等等
a = np.array([[1,2],[3,4]])
b = np.array([[5,6],[7,8]])
print('a = ',a)
print('b = ',b)

# 元素乘法,数组对应元素相乘
print('元素乘法a*b:',a*b)
# 线性代数矩阵相乘
print('矩阵相乘:',np.dot(a,b))

a =  [[1 2]
 [3 4]]
b =  [[5 6]
 [7 8]]
元素乘法a*b: [[ 5 12]
 [21 32]]
矩阵相乘: [[19 22]
 [43 50]]
a = np.array([[1,2],[3,4]])
b = np.linalg.det(a)
print('矩阵a对应的行列式的值:',b)
c = np.linalg.inv(a)
print('矩阵a的逆矩阵:',c)
d = np.linalg.eig(a)
print('矩阵a的特征值',d[0])
print('矩阵a的特征向量',d[1])

矩阵a对应的行列式的值: -2.0000000000000004
矩阵a的逆矩阵: [[-2.   1. ]
 [ 1.5 -0.5]]
矩阵a的特征值 [-0.37228132  5.37228132]
矩阵a的特征向量 [[-0.82456484 -0.41597356]
 [ 0.56576746 -0.90937671]]
# 线性方程组求解

 1. 3x + y - 2z = 5
 2. x - y + 4z = -2
 3. 2x + 3z = 2.5
from scipy.linalg import solve
a = np.array([[3,1,-2],[1,-1,4],[2,0,3]])
b = np.array([5,-2,2.5])
print('方程形如Ax=b,其中A={},\nb={}'.format(a,b))
x = solve(a,b)
print('方程的解为:',x)

方程形如Ax=b,其中A=[[ 3  1 -2]
 [ 1 -1  4]
 [ 2  0  3]],
b=[ 5.  -2.   2.5]
方程的解为: [0.5 4.5 0.5]
二、pandas
pandas是以numpy为基础的python程序包,具备丰富的表格型数据操作功能
1、数据结构
Series:一维数组,类似list数据类型,用下标索引方式访问数据元素
Time-Series:时间序列,采用时间索引方式访问数据元素
DataFrame:二维表格型数据结构
Panel:三维数据,可装载多个DataFrame
# 大多数情况下,pandas都会配合numpy一起使用,用于对数据进行运算处理
import pandas as pd
# 构造一维数组
s1 = pd.Series([100,'gd','gz'])
print(s1)
print('s1.shape=',s1.shape)
print('s1.index=',s1.index)
print('s1.values=',s1.values)

0    100
1     gd
2     gz
dtype: object
s1.shape= (3,)
s1.index= RangeIndex(start=0, stop=3, step=1)
s1.values= [100 'gd' 'gz']
# 自定义索引,构造一维数组
s2 = pd.Series([100,'gd','gz'], index=['mark','university','city'])
print(s1)
print('s2.shape=',s2.shape)
print('s2.index=',s2.index)
print('s2.values=',s2.values)
print('s2["mark"]=',s2['mark'])

0    100
1     gd
2     gz
dtype: object
s2.shape= (3,)
s2.index= Index(['mark', 'university', 'city'], dtype='object')
s2.values= [100 'gd' 'gz']
s2["mark"]= 100
# 通过字典构造一维数组
data = {'name':['python','java','c++'],'score':[95,90,99],'year':[2020,2021,2022]}
print('字典data:',data)
s3 = pd.DataFrame(data)
print('DataFrame s3:\n',s3)
print('s3.shape=',s3.shape)
print('s3.index=',s3.index)
print('s3.values=',s3.values)

字典data: {'name': ['python', 'java', 'c++'], 'score': [95, 90, 99], 'year': [2020, 2021, 2022]}
DataFrame s3:
      name  score  year
0  python     95  2020
1    java     90  2021
2     c++     99  2022
s3.shape= (3, 3)
s3.index= RangeIndex(start=0, stop=3, step=1)
s3.values= [['python' 95 2020]
 ['java' 90 2021]
 ['c++' 99 2022]]
2、数据处理
2.1、数据结构与描述性统计
dates = pd.date_range('20220401',periods=6)
df = pd.DataFrame(np.random.randn(6,3),index=dates,columns=['a','b','c'])
print('df:\n',df)

df:
                    a         b         c
2022-04-01  1.157682  1.248710  0.252461
2022-04-02  1.890162 -0.460040 -0.952669
2022-04-03 -0.089896  1.124548  0.842600
2022-04-04  1.088276  0.359554  1.005010
2022-04-05 -0.087399  0.242903  0.389513
2022-04-06  1.431301  1.716398  0.374692
df_1 = pd.DataFrame({'a':1.,
                    'b':pd.Timestamp('20220401'),
                    'c':pd.Series(1,index=list(range(4)),dtype='float32'),
                    'd':np.array([3]*4,dtype='int32'),
                    'e':pd.Categorical(["test","train","test","train"]),
                    'f':'foo'})
print('df_1:\n',df_1)
print('各列数据类型:\n',df_1.dtypes)

df_1:
      a          b    c  d      e    f
0  1.0 2022-04-01  1.0  3   test  foo
1  1.0 2022-04-01  1.0  3  train  foo
2  1.0 2022-04-01  1.0  3   test  foo
3  1.0 2022-04-01  1.0  3  train  foo
各列数据类型:
 a           float64
b    datetime64[ns]
c           float32
d             int32
e          category
f            object
dtype: object
# 数据描述
print('df_1数据描述:\n',df_1.describe())

df_1数据描述:
          a    c    d
count  4.0  4.0  4.0
mean   1.0  1.0  3.0
std    0.0  0.0  0.0
min    1.0  1.0  3.0
25%    1.0  1.0  3.0
50%    1.0  1.0  3.0
75%    1.0  1.0  3.0
max    1.0  1.0  3.0
# 排序
print('按e列的值进行排序:\n',df_1.sort_values(by='e'))

按e列的值进行排序:
      a          b    c  d      e    f
0  1.0 2022-04-01  1.0  3   test  foo
2  1.0 2022-04-01  1.0  3   test  foo
1  1.0 2022-04-01  1.0  3  train  foo
3  1.0 2022-04-01  1.0  3  train  foo
2.2、切片访问与缺失处理
print('访问b、c列:\n',df[['b','c']])

访问b、c列:
                    b         c
2022-04-01  0.057102 -0.183773
2022-04-02 -0.487013  0.513329
2022-04-03  0.184821  0.509904
2022-04-04 -0.392358  1.952551
2022-04-05 -0.740828  0.595205
2022-04-06  1.425204  0.604636
print('访问前2行:\n',df[0:2])

访问前2行:
                    a         b         c
2022-04-01  0.400813  0.057102 -0.183773
2022-04-02  1.652287 -0.487013  0.513329
# 利用loc按照行列标签进行精确选择
print('利用loc:\n',df.loc['20220402',['a','b']])
# 利用iloc进行切片访问
print('利用iloc:\n',df.iloc[3:5,0:2])

利用loc:
a    1.652287
b   -0.487013
Name: 2022-04-02 00:00:00, dtype: float64
利用iloc:
                    a         b
2022-04-04  0.915201 -0.392358
2022-04-05  1.037104 -0.740828
print('df中b列大于0的数据:\n',df[df.b>0])

df中b列大于0的数据:
                    a         b         c
2022-04-01  0.400813  0.057102 -0.183773
2022-04-03  1.124814  0.184821  0.509904
2022-04-06  0.733508  1.425204  0.604636
# df增加一列d从索引项20220402开始
df['d'] = pd.Series([1,2,3,4,5,6],index=pd.date_range('20220402',periods=6))
print(df)

a         b         c    d
2022-04-01  0.400813  0.057102 -0.183773  NaN
2022-04-02  1.652287 -0.487013  0.513329  1.0
2022-04-03  1.124814  0.184821  0.509904  2.0
2022-04-04  0.915201 -0.392358  1.952551  3.0
2022-04-05  1.037104 -0.740828  0.595205  4.0
2022-04-06  0.733508  1.425204  0.604636  5.0
# 对NaN数据进行处理
# axis=0对行进行操作,how='any'只要存在一个就删除,'all'全部都是nan才删除
df1 = df.dropna(axis=0,how='any')
print(df1)

  a         b         c    d
2022-04-02  1.652287 -0.487013  0.513329  1.0
2022-04-03  1.124814  0.184821  0.509904  2.0
2022-04-04  0.915201 -0.392358  1.952551  3.0
2022-04-05  1.037104 -0.740828  0.595205  4.0
2022-04-06  0.733508  1.425204  0.604636  5.0
# 用0填充NaN数据
df2 = df.fillna(value=0)
print(df2)

a         b         c    d
2022-04-01  0.400813  0.057102 -0.183773  0.0
2022-04-02  1.652287 -0.487013  0.513329  1.0
2022-04-03  1.124814  0.184821  0.509904  2.0
2022-04-04  0.915201 -0.392358  1.952551  3.0
2022-04-05  1.037104 -0.740828  0.595205  4.0
2022-04-06  0.733508  1.425204  0.604636  5.0
2.3、多表合并
df3 = pd.DataFrame({'id':[1001,1002,1003,1004,1005,1006],
                   'date':pd.date_range('20220401',periods=6),
                   'city':['beijing','shanghai','guanzhou','shenzhen','tianjin','xian'],
                   'age':[23,44,54,32,34,32],
                   'category':['100a','100b','110a','110c','210a','130f'],
                   'price':[1200,np.nan,2133,5433,np.nan,4432]})
print('df3:\n',df3)

df3:
      id       date      city  age category   price
0  1001 2022-04-01   beijing   23     100a  1200.0
1  1002 2022-04-02  shanghai   44     100b     NaN
2  1003 2022-04-03  guanzhou   54     110a  2133.0
3  1004 2022-04-04  shenzhen   32     110c  5433.0
4  1005 2022-04-05   tianjin   34     210a     NaN
5  1006 2022-04-06      xian   32     130f  4432.0
df4 = pd.DataFrame({'id':[1001,1002,1003,1004,1005,1006,1007,1008],
                   'gender':['male','female','male','female','male','male','female','female'],
                   'pay':['y','n','n','y','n','n','y','y'],
                   'point':[10,12,20,40,40,40,30,20]})
print('df4:\n',df4)

df4:
      id  gender pay  point
0  1001    male   y     10
1  1002  female   n     12
2  1003    male   n     20
3  1004  female   y     40
4  1005    male   n     40
5  1006    male   n     40
6  1007  female   y     30
7  1008  female   y     20
# 合并交集
print('df3、df4的交集:\n',pd.merge(df3,df4,how='inner'))

df3、df4的交集:
      id       date      city  age category   price  gender pay  point
0  1001 2022-04-01   beijing   23     100a  1200.0    male   y     10
1  1002 2022-04-02  shanghai   44     100b     NaN  female   n     12
2  1003 2022-04-03  guanzhou   54     110a  2133.0    male   n     20
3  1004 2022-04-04  shenzhen   32     110c  5433.0  female   y     40
4  1005 2022-04-05   tianjin   34     210a     NaN    male   n     40
5  1006 2022-04-06      xian   32     130f  4432.0    male   n     40
# 按照右表数据进行右连接,左连接用left
print('df3_df4_right:\n',pd.merge(df3,df4,how='outer'))

df3_df4_right:
      id       date      city   age category   price  gender pay  point
0  1001 2022-04-01   beijing  23.0     100a  1200.0    male   y     10
1  1002 2022-04-02  shanghai  44.0     100b     NaN  female   n     12
2  1003 2022-04-03  guanzhou  54.0     110a  2133.0    male   n     20
3  1004 2022-04-04  shenzhen  32.0     110c  5433.0  female   y     40
4  1005 2022-04-05   tianjin  34.0     210a     NaN    male   n     40
5  1006 2022-04-06      xian  32.0     130f  4432.0    male   n     40
6  1007        NaT       NaN   NaN      NaN     NaN  female   y     30
7  1008        NaT       NaN   NaN      NaN     NaN  female   y     20
pandas文件读取
| 函数 | 功能 |
|---|---|
| pd.read_csv(‘file.csv’) | 读取csv文件 |
| pd.read_json(‘file.json’) | 读取json文件 |
| pd.read_excel(‘file.xls’,sheetname=[0,1…]) | 读取excel文件多个sheet页,返回多个df的字典 |
pandas数据预处理函数
| 函数 | 功能 |
|---|---|
| df.duplicated()或df.drop_duplicated() | 返回各行是否是上一行的重复行;删除重复行 |
| df.fillna(0) | 用0填充nan |
| df.dropna(axis,how) | axis=0:按行,axis=1:按列;how=‘any’:有nan就删,how=‘all’:全是nan才删 |
| del df([‘col’,…],axis) | 删除行列 |
| df.column=col_name | 指定列名 |
pandas数据筛选函数
| 函数名 | 功能 |
|---|---|
| df.columns | 列名 |
| df.index | 索引名 |
| df.shape | 行x列 |
| df.head(n=N) | 前几行 |
| df.tail(n=N) | 后几行 |
| df.values | np对象的二维数组 |
| df.reindex(index=[‘row1’…],columns=[‘col1’…] | 重新排序 |
| df[n:m] | 切片,n~m-1 |
pandas数学运算和描述性统计函数
| 函数名 | 功能 |
|---|---|
| df.T | 转置 |
| df1+df2 | 合并,空值nan |
| df1.add(df2,fill_value=0) | 合并,空值0 |
| df.sort_index(axis=0) | 按行索引升序 |
| df.sort_index(by=[‘col1’…]) | 按特定值排序 |
| df.rank() | 计算排名rank值 |
| df.describe() | 描述性统计 |
| df.count() | 计算非nan值 |
| df.max/min/sum/mean/median/var/std() | 最大值最小值… |
| df.cumsum() | 累计和 |
| df.cov() | 协方差 |
| df.groupby(‘col1’) | 按列分组 |
三、matplotlib
1、matplotlib图形绘制
绘图区域有figure表示,一个figure表示一个图形窗口
import matplotlib.pyplot as plt

# 处理图表内嵌中文字体问题
plt.rcParams['font.sans-serif']=['SimHei']
plt.rcParams['axes.unicode_minus']=False

x = np.arange(100,201)
y = 2*x + 1
# 图片尺寸
plt.figure(figsize=(10,6))
# X坐标范围
plt.xlim(100,201)
plt.plot(x,y)
plt.xlabel('X值',fontsize=16)
plt.ylabel('Y值',fontsize=16)
plt.xticks(fontproperties='Time New Roman',size=14)
plt.yticks(fontproperties='Time New Roman',size=14)
plt.savefig('pic1.png',dpi=300,bbox_inches='tight')
plt.show()
1.1、绘制散点图
# 处理图表内嵌中文字体问题
plt.rcParams['font.sans-serif']=['SimHei']
plt.rcParams['axes.unicode_minus']=False

# 图片尺寸
plt.figure(figsize=(10,6))
# 散点图
n = 20
plt.scatter(np.random.rand(n)*100,np.random.rand(n)*100,c='r',s=100,alpha=0.8)
plt.scatter(np.random.rand(n)*100,np.random.rand(n)*100,c='g',s=200,alpha=0.5)
plt.scatter(np.random.rand(n)*100,np.random.rand(n)*100,c='k',s=300,alpha=0.2)

plt.xlabel('X值',fontsize=16)
plt.ylabel('Y值',fontsize=16)
plt.xticks(fontproperties='Time New Roman',size=14)
plt.yticks(fontproperties='Time New Roman',size=14)
# plt.savefig('pic1.png',dpi=300,bbox_inches='tight')
plt.show()
1.2、绘制柱状图
# 柱状图
y2021 = [15600,12700,11300,4270,3620]
y2022 = [17400,14800,12000,5200,4020]
labels = ['bj','sh','hk','sz','gz']
bar_width=0.4
plt.figure(figsize=(10,6))
plt.bar(np.arange(5),y2021,label='2021',color='g',alpha=0.8,width=bar_width)
plt.bar(np.arange(5)+bar_width,y2022,label='2022',color='r',alpha=0.8,width=bar_width)
plt.xlabel('top5 city',fontproperties='Time New Roman',size=16)
plt.ylabel('family amount',fontproperties='Time New Roman',size=16)
plt.xticks(np.arange(5)+bar_width/2,labels)

plt.xticks(fontproperties='Time New Roman',size=14)
plt.yticks(fontproperties='Time New Roman',size=14)
plt.title('millions family amount top5 city distribution',fontproperties='Time New Roman',size=16)

for x1,y1 in enumerate(y2021):
    plt.text(x1-0.1,y1+150,y2021[x1])
for x2,y2 in enumerate(y2022):
    plt.text(x2+0.25,y2+150,y2022[x2])

plt.legend()
plt.show()
1.3、绘制饼状图
# 饼状图
plt.figure(figsize=(10,6))
edu = [0.2515,0.0057,0.3724,0.3336,0.0368]
labels = ['highschool','others','junior college','bachelor','master']
exp = [0.1,0,0,0,0]
colors = ['r','g','y','purple','blue']
plt.axes(aspect='equal')
plt.xlim(0,4)
plt.ylim(0,4)
plt.pie(x = edu,# 数据
       explode = exp,# 突出部分
       labels = labels,# 标签
       colors = colors,# 颜色
       autopct = '%.1f%%',# 百分比一位小数
       pctdistance = 0.5,# 百分比标签与圆心距离
       labeldistance = 0.8,# 标签与圆心距离
       startangle = 180,# 饼图初始角度
       radius = 1.5,# 半径
       counterclock = False,# 顺逆时针
       wedgeprops = {'linewidth':1.5,'edgecolor':'white'},# 边界属性
       textprops = {'fontsize':15,'color':'k'},# 标签属性
       center = (2,2),# 原点
       frame = 1)# 是否显示图框
plt.xticks(())
plt.yticks(())
plt.title('xx客户分析')
plt.show()
1.4、绘制3D图
# 3D图
from mpl_toolkits.mplot3d import Axes3D
plt.figure(figsize=(10,6))
data = np.random.randint(0,255,size=[6,6,6])

x,y,z = data[0],data[1],data[2]
ax = plt.subplot(111,projection='3d')
ax.scatter(x[0:2],y[0:2],z[0:2],c='y',s=100)
ax.scatter(x[2:4],y[2:4],z[2:4],c='r',marker='*',s=100)
ax.scatter(x[4:6],y[4:6],z[4:6],c='g',marker='v',s=100)
ax.set_zlabel('Z')
ax.set_ylabel('Y')
ax.set_xlabel('X')
plt.show()
2、seaborn图形绘制
seaborn是基于matplotlib的python数据可视化程序包,它简化了繁琐复杂的参数设置,有助于用户创建具有统计意义的图形
import matplotlib.pyplot as plt
import seaborn as sns

plt.figure(figsize=(10,6))
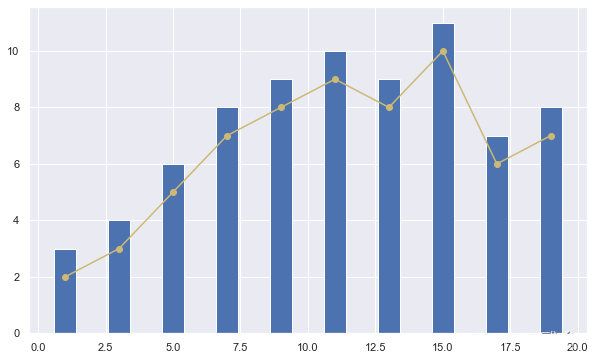
x = [1,3,5,7,9,11,13,15,17,19]
y_bar = [3,4,6,8,9,10,9,11,7,8]
y_line = [2,3,5,7,8,9,8,10,6,7]
sns.set()
plt.bar(x,y_bar)
plt.plot(x,y_line,'-o',color='y')
plt.show
# 概率分布图
import numpy as np
import matplotlib.pyplot as plt
import seaborn as sns
%matplotlib inline

plt.figure(figsize=(10,6))
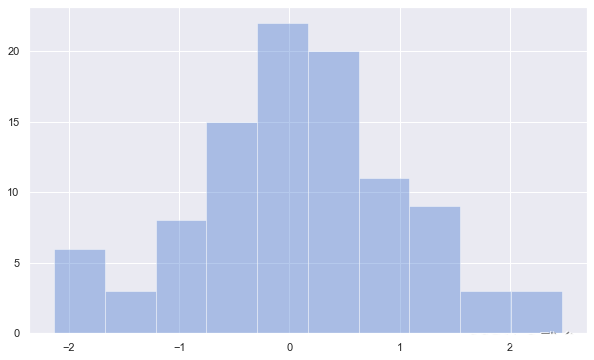
sns.set(palette="muted",color_codes=True)
rs = np.random.RandomState(10)
d = rs.normal(size=100)
sns.distplot(d,kde=False,color='b')
plt.show()

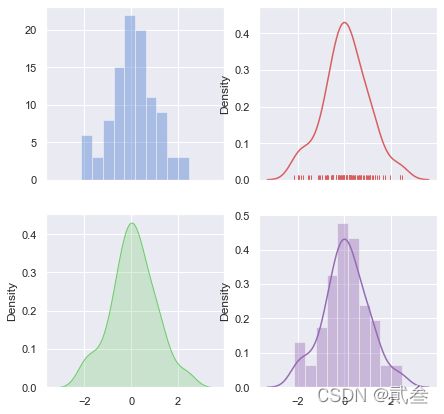
f,axes = plt.subplots(2,2,figsize=(7,7),sharex=True)
sns.distplot(d,kde=False,color='b',ax=axes[0,0])
sns.distplot(d,hist=False,rug=True,color='r',ax=axes[0,1])
sns.distplot(d,hist=False,color='g',kde_kws={"shade":True},ax=axes[1,0])
sns.distplot(d,color='m',ax=axes[1,1])
plt.show()
# 联合分布热力图
import numpy as np
import pandas as pd
import matplotlib.pyplot as plt
import seaborn as sns
%matplotlib inline
from scipy import stats

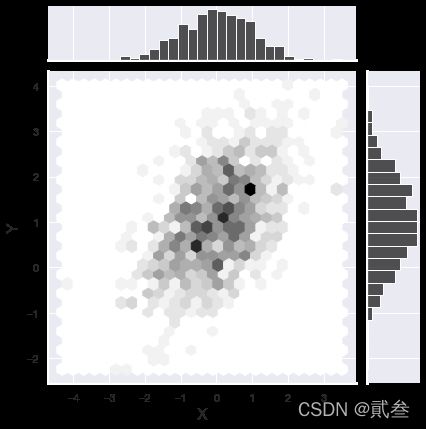
mean,cov = [0,1],[(1,.5),(.5,1)]
data = np.random.multivariate_normal(mean,cov,1000)
df = pd.DataFrame(data,columns=['x','y'])

plt.figure(figsize=(10,6))
g = sns.jointplot(x='x',y='y',data=df,kind='hex',color='k')
g.set_axis_labels('X','Y',size=16)
g.annotate(stats.pearsonr,fontsize=12)
g.show()
# 回归分析图
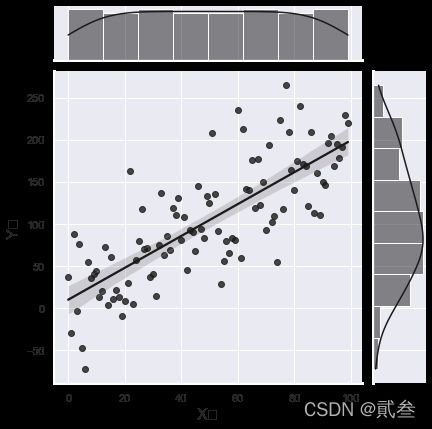
x = np.arange(0,100)
y = 2*x+1
var = np.random.normal(0,50,100)
y = y + var
df1 = pd.DataFrame()
df1['x'] = x
df1['y'] = y
plt.figure(figsize=(10,6))
g1 = sns.jointplot(x='x',y='y',data=df1,kind='reg',color='k')
g1.set_axis_labels('X值','Y值',size=16)
g1.savefig('sea05.png',dpi=300,bbox_inches='tight')
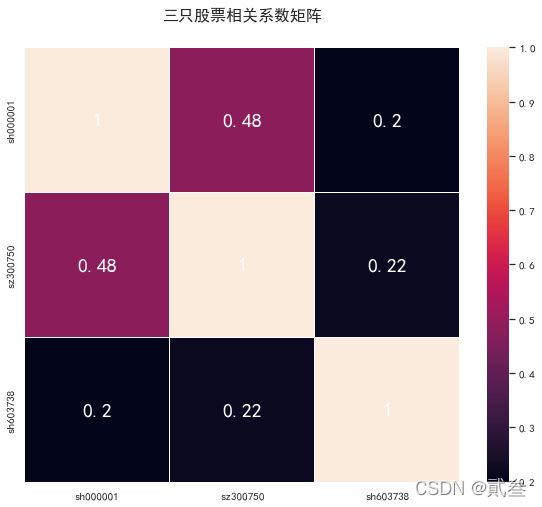
3、实际案例
import akshare as ak
stock1 = ak.stock_zh_a_daily('sh000001','20201231','20211231')
stock2 = ak.stock_zh_a_daily('sz300750','20201231','20211231')
stock3 = ak.stock_zh_a_daily('sh603738','20201231','20211231')

df = pd.DataFrame()
df['sh000001'] = stock1['close'].pct_change()
df['sz300750'] = stock2['close'].pct_change()
df['sh603738'] = stock3['close'].pct_change()

plt.rcParams['font.sans-serif']=['SimHei']
plt.rcParams['axes.unicode_minus']=False
sns.set_style("whitegrid",{'font.sans-serif':['simhei','Arial']})

sns.PairGrid(df).map(plt.scatter)
plt.figure(figsize=(10,8))
plt.title("三只股票相关系数矩阵",y=1.05,size=16)
sns.heatmap(df.corr(),linewidths=0.1,vmax=1.0,square=True,linecolor='white',
           annot=True,annot_kws={'size':20,'weight':'bold','color':'white'})
plt.savefig('相关矩阵.png',dpi=300,bbox_inches='tight')
结语
看完这些基础知识后再看以前写的实战案例文章栏目【金融数据分析】,或许会有新的收获~
大家也可以在评论区留言,一起交流学习吧!

