数据可视化实验:python数据可视化-柱状图,条形图,直方图,饼图,棒图,散点图,气泡图,雷达图,箱线图,折线图
数据可视化实验:python数据可视化
实验8-12:大数据可视化工具—python
目录
- 1柱状图
- 2条形图
- 3直方图
- 4饼图
- 5棒图
- 6散点图
- 7气泡图
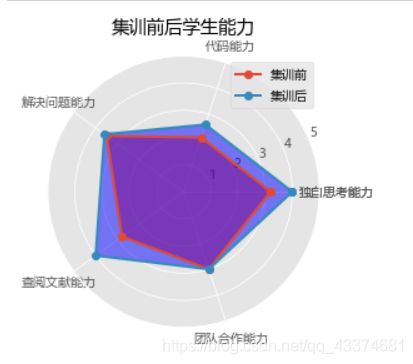
- 8雷达图
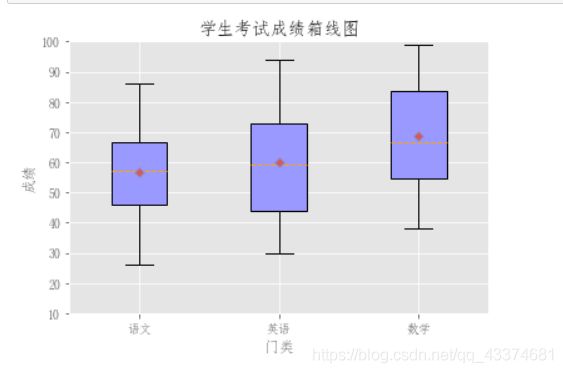
- 9箱线图
- 10折线图
1柱状图
#导包
import matplotlib.pyplot as plt
import numpy as np
# 设置中文显示
plt.rcParams['font.sans-serif'] = 'SimHei'
plt.rcParams['axes.unicode_minus'] = False
# 设置标题
plt.title('班级A同学爱好统计')
#数据准备
x = ['乒乓球','羽毛球','篮球','跑步','足球']
y1= [7,8,4,5,3]
y2= [6,7,5,6,3]
#设置图形宽度
bar_width = 0.3
X_A = np.arange(len(x))  # A班条形图的横坐标
X_B = X_A + bar_width  # B班条形图的横坐标
#绘制图形
plt.bar(X_A,y1,bar_width,align='center',color='r')
#并列柱状图:x轴加上宽度
plt.bar(X_B,y2,width=bar_width,color='y')
plt.xticks(X_A + bar_width/2, x)# 让横坐标显示运动
#加图例
plt.legend(['班级A','班级B'])
plt.ylabel('人数')  # 纵坐标轴标题
fig=plt.gcf()
fig.set_facecolor('green')
#显示
plt.show()
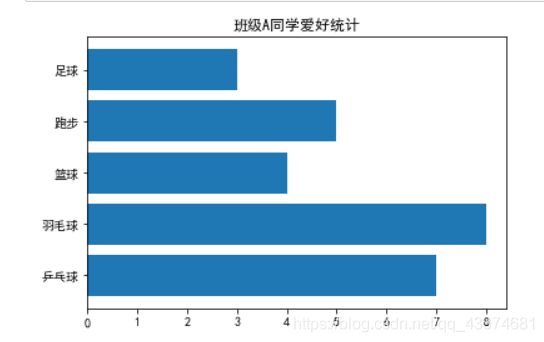
2条形图
#导包
import matplotlib.pyplot as plt
import numpy as np
# 设置中文显示
plt.rcParams['font.sans-serif'] = 'SimHei'
plt.rcParams['axes.unicode_minus'] = False
# 设置标题
plt.title('班级A同学爱好统计')
#数据准备
x = ['乒乓球','羽毛球','篮球','跑步','足球']
y1= [7,8,4,5,3]
#绘制图形,横放条形图函数 barh
plt.barh(x, y1)
#显示
plt.show()
3直方图
制作数据
import random
def random_int_list(start, stop, length):
  start, stop = (int(start), int(stop)) if start <= stop else (int(stop), int(start))
  length = int(abs(length)) if length else 0
  random_list = []
  for i in range(length):
   random_list.append(random.randint(start, stop))
  return random_list
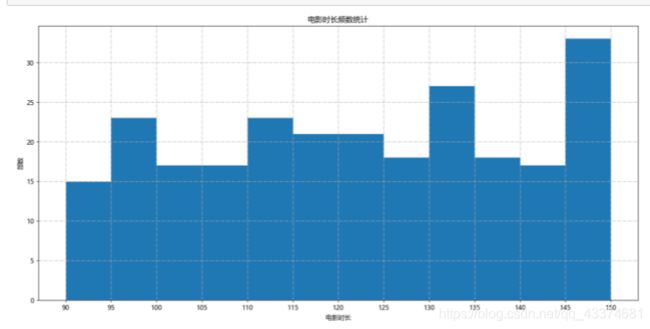
a = random_int_list(90,150,250)
print("250部电影时长:",a)
from matplotlib import pyplot as plt
import matplotlib
font = {'family': 'MicroSoft YaHei'}
matplotlib.rc('font', **font) # 使支持中文
d = 5                                #d代表组距,即每组的长度,以此为依据对数据分组
num_bins = (max(a)-min(a))//d        #求出有多少组
plt.figure(figsize=(17,8),dpi=110)    #规定直方图大小
plt.hist(a,num_bins)        #hist()函数用来描绘直方图
plt.xticks(range(min(a),max(a)+d,d)) #xticks()函数用来画网络线
plt.grid(True,linestyle="-.")        #规定网格线样式
plt.title('电影时长频数统计')
plt.xlabel("电影时长")
plt.ylabel("部数")
plt.show()
4饼图
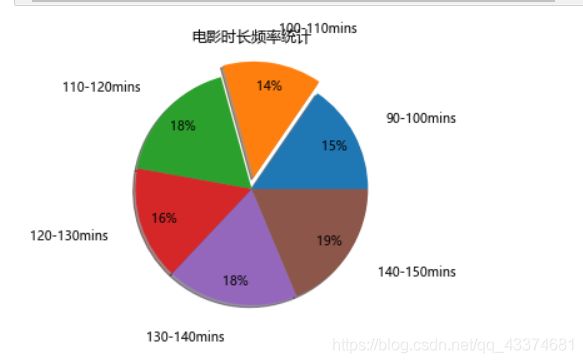
数据来自于3直方图
import  matplotlib.pyplot as plt
from matplotlib import font_manager
d = (max(a)-min(a))//6       #安分五组计算组距
ls = [0,0,0,0,0,0]             #初始化列表ls,记录每组频数
for i in range(len(a)):      #在a中依次找出每组数据,并在ls中计数
    if a[i] < min(a)+d*1:
        ls[0] = ls[0]+1
    elif a[i] < min(a)+d*2:
        ls[1] = ls[1]+1
    elif a[i] < min(a)+d*3:
        ls[2] = ls[2]+1
    elif a[i] < min(a)+d*4:
        ls[3] = ls[3]+1
    elif a[i] < min(a)+d*5:
        ls[4] = ls[4]+1
    elif a[i] < min(a)+d*6:
        ls[5] = ls[5]+1
#编辑标签:
labels = ['90-100mins','100-110mins','110-120mins','120-130mins','130-140mins','140-150mins']

explode = (0,0.1,0,0,0,0)
#画饼:
plt.pie(ls,labels=labels,labeldistance=1.3,autopct="%1.f%%",pctdistance=0.8,shadow=True,startangle=0,explode=explode)
plt.axis("equal")#使之呈现“正圆”,默认扁圆
plt.title('电影时长频率统计')
plt.show()
5棒图
import matplotlib.pyplot as plt
import numpy as np
import matplotlib

# 使显示中文
font = {'family': 'MicroSoft YaHei'}
matplotlib.rc('font', **font) # 使支持中文
# 数据
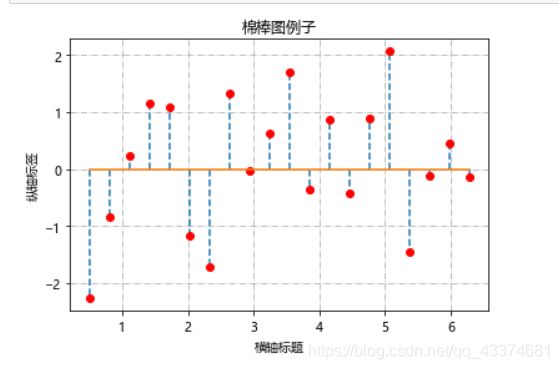
a = np.linspace(0.5, 2*np.pi, 20)
b = np.random.randn(20)
x, y, z = plt.stem(a, b, linefmt="--.", markerfmt="o", basefmt="-")

#设置棉棒末端
plt.setp(x, color='r')

plt.xlabel("横轴标题")
plt.ylabel("纵轴标签")
#设置标题
plt.title('棉棒图例子')

#增加背景网格
plt.grid(True,linestyle="-.")
# 显示
plt.show()
6散点图
import numpy as np
import matplotlib.pyplot as plt

#  在区间 [a, b] 上均匀地取指定数量的值
np.random.seed(22)

x1 = np.linspace(0.05, 10, 100)
x2 = np.linspace(0.05, 10, 100)
y1 = np.random.randn(100)
y2 = np.random.randn(100)

# 图表元素中正常显示中文字符
plt.rcParams['font.sans-serif'] = 'SimHei'
# 坐标轴刻度标签正常显示负号
plt.rcParams['axes.unicode_minus'] = False

plt.scatter(x1, y1,
            s=87,  # 标记点大小
            marker='*',  # 标记点的样式 星号
            c='r',  # 红色
            linewidths=0.41,
            edgecolor='y',  # 边缘颜色
            label='scatter figure')
plt.scatter(x2, y2,
            s=87,  # 标记点大小
            marker='*',  # 标记点的样式 星号
            c='g',  # green 绿色
            linewidths=0.41,
            edgecolor='y',  # 边缘颜色
            label='scatter figure')

plt.xticks(size=12, color='grey')  # x 轴刻度标签
plt.yticks(size=12, color='grey')  # y 轴刻度标签
plt.title('散点图', size=14, color='r');  # 添加图表标题
plt.legend()  # 添加图例


plt.xlabel('X轴')
plt.ylabel('Y轴')

#设置网格线,linestyle设置线图类型,color设置颜色
plt.grid(linestyle=':',color='r')
# 设置坐标轴刻度范围
plt.xlim(-0.5, 10.5)
plt.ylim(-3.5, 3.5);
7气泡图
import matplotlib.pyplot as plt
import numpy as np
# 图表元素中正常显示中文字符
plt.rcParams['font.sans-serif'] = 'SimHei'
# 数据
x = np.random.rand(40)
y = np.random.rand(40)
z = np.random.rand(40)
colors = np.random.rand(40)

plt.xlabel('X轴')
plt.ylabel('Y轴')
plt.title('气泡图', size=14, color='r');  # 添加图表标题

#设置网格线,linestyle设置线图类型,color设置颜色
plt.grid(linestyle=':',color='r')

plt.scatter(x, y, s=z*1000,c=colors,cmap=mpl.cm.RdYlBu, marker="o")
plt.show()
8雷达图
import numpy as np
import matplotlib.pyplot as plt

# 中文和负号的正常显示
plt.rcParams['font.sans-serif'] = 'Microsoft YaHei'
plt.rcParams['axes.unicode_minus'] = False

#使用ggplot的风格绘图
plt.style.use('ggplot')

#构造数据
values = [3.2,2.1,3.5,2.8,3]
values_1 = [4,2.6,3.6,4.0,3]
feature = [' ','代码能力','解决问题能力','查阅文献能力','团队合作能力','独自思考能力']

N = len(values)

#设置雷达图的角度,用于平分切开一个平面
angles = np.linspace(0,2*np.pi,N,endpoint=False)

#使雷达图封闭起来
values = np.concatenate((values,[values[0]]))
angles = np.concatenate((angles,[angles[0]]))

values_1 = np.concatenate((values_1,[values_1[0]]))
#绘图
fig = plt.figure()
#设置为极坐标格式
ax = fig.add_subplot(111, polar=True)
#绘制折线图
ax.plot(angles,values,'o-',linewidth=2,label='集训前')
ax.fill(angles,values,'r',alpha=0.5)

#填充颜色
ax.plot(angles,values_1,'o-',linewidth=2,label='集训后')
ax.fill(angles,values_1,'b',alpha=0.5)

#添加每个特质的标签
ax.set_thetagrids(angles*180/np.pi,feature)
#设置极轴范围
ax.set_ylim(0,5)
#添加标题
plt.title('集训前后学生能力')

plt.legend(loc='upper right')  # 添加图例
#添加网格线
ax.grid(True)
plt.show()
9箱线图
import matplotlib.pyplot as plt
import numpy as np

#中文显示
plt.rcParams['font.family']='FangSong'

# 设置图形的显示风格
plt.style.use('ggplot')

#数据准备
Chinese = np.random.randint(25,90,60)
English = np.random.randint(30,95,60)
math = np.random.randint(35,100,60)
grade=[Chinese,English,math]
wid=0.4

#设置坐标轴
label = ['语文','英语','数学']

# 设置y轴的范围
plt.ylim(10,100)

plt.title('学生考试成绩箱线图')
plt.xlabel("门类")
plt.ylabel("成绩")
#绘制箱线图
plt.boxplot(grade,widths=wid,
            patch_artist=True,
            labels=label,
            showmeans=True,
            medianprops = {'linestyle':'--','color':'orange'},
            meanprops = {'marker':'D','markerfacecolor':'indianred'},
            boxprops = {'color':'black','facecolor':'#9999ff'})

#展示
plt.show()
10折线图
import numpy as np
import matplotlib.pyplot as plt
# 设置中文和负号正常显示
plt.rcParams['font.sans-serif'] = 'Microsoft YaHei'
plt.rcParams['axes.unicode_minus'] = False
# x轴刻度标签
x_ticks = ['一月', '二月', '三月', '四月', '五月','六月','七月','八月','九月','十月','十一月','十二月']
# x轴范围
x = np.arange(len(x_ticks))
# 第1条折线数据
y1 = [5, 8, 13, 20, 25, 28,30,30, 26, 20, 13,7]
# 第2条折线数据
y2 = [-5, -2, 3, 9, 14, 18,21,20,16,10,3,-2]
plt.figure(figsize=(10, 6))
# 第1条折线度
plt.plot(x, y1, color='#FF0000', label='最高平均温', linewidth=3.0)
# 第2条折线
plt.plot(x, y2, color='#00FF00', label='最低平均温度', linewidth=3.0)
# 给第1条折线数据点加上数值,前两个参数是坐标,第三个是数值,ha和va分别是水平和垂直位置(数据点相对数值)。
for a, b in zip(x, y1):
    plt.text(a, b, '%d'%b, ha='center', va= 'bottom', fontsize=18)
# 给第2条折线数据点加上数值
for a, b in zip(x, y2):
    plt.text(a, b, '%d'%b, ha='center', va= 'bottom', fontsize=18)
# 画水平横线,参数分别表示在y=3,x=0~len(x)-1处画直线。
plt.hlines(3, 0, len(x)-1, colors = "#000000", linestyles = "dashed")
plt.xticks([r for r in x], x_ticks, fontsize=18, rotation=20)
plt.yticks(fontsize=18)
# 添加x轴和y轴标签
plt.xlabel(u'月份', fontsize=18)
plt.ylabel(u'温度', fontsize=18)
# 标题
plt.title(u'全年温度折线图', fontsize=18)
# 图例
plt.legend(fontsize=18)
# 显示图片
plt.show()

