Seaborn学习之散点图,箱型图,柱状图,折线图及多面板绘图
分类散点图
stripplot()
import numpy as np
import pandas as pd
import seaborn as sns
import matplotlib as mpl
import matplotlib.pyplot as plt
sns.set(style="whitegrid", color_codes=True)
np.random.seed(sum(map(ord, "categorical")))
tips = sns.load_dataset("tips")
titanic = sns.load_dataset("titanic")
iris = sns.load_dataset("iris")
sns.stripplot(x="day", y="total_bill", data=tips)
plt.show()
结果如下:
使用 swarmplot(),避免散点重叠带分布的散点图
sns.swarmplot(x="day", y="total_bill", data=tips)
plt.show()
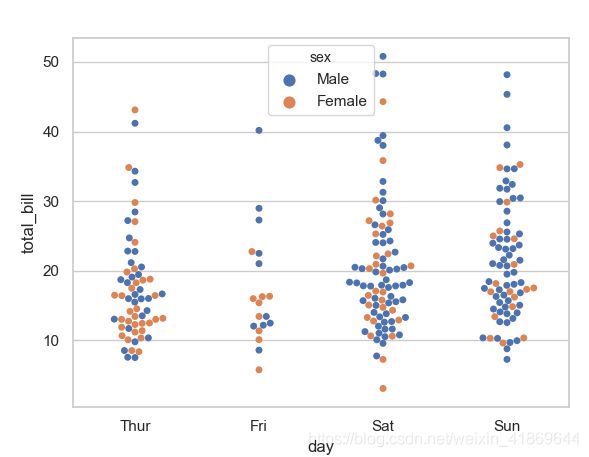
使用hue参数添加一个分类变量
sns.swarmplot(x="day", y="total_bill",hue='sex', data=tips)
plt.show()
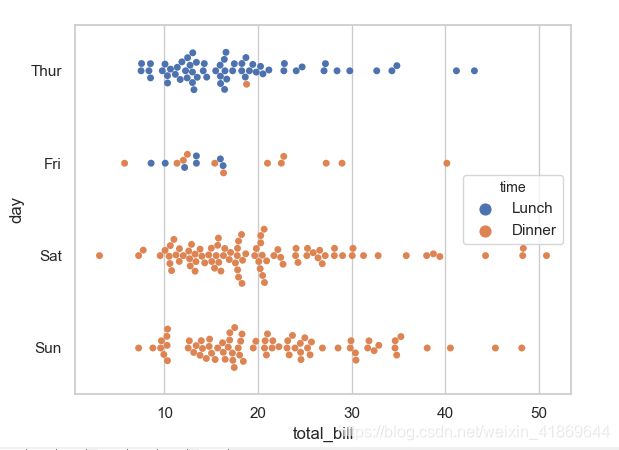
分类变量放在y轴上
sns.swarmplot(x="total_bill", y="day", hue="time", data=tips)
plt.show()
箱型图
boxplot()
import numpy as np
import pandas as pd
import seaborn as sns
import matplotlib as mpl
import matplotlib.pyplot as plt
sns.set(style="whitegrid", color_codes=True)
np.random.seed(sum(map(ord, "categorical")))
tips = sns.load_dataset("tips")
titanic = sns.load_dataset("titanic")
iris = sns.load_dataset("iris")
#palette 调色板
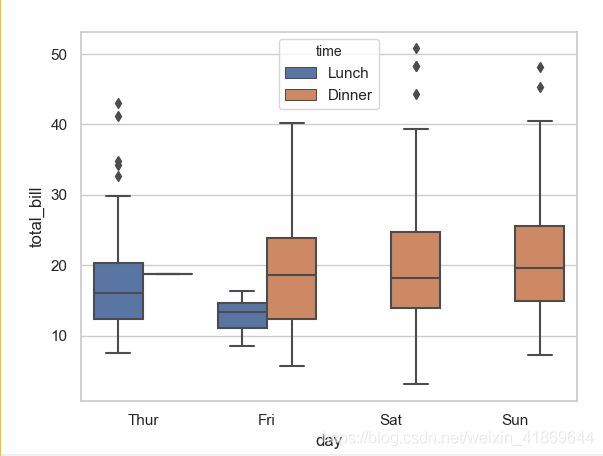
#分组绘制箱线图,分组因子是day,在x轴不同位置绘制
#分组箱线图,分子因子是time,不同的因子用不同颜色区分
# 相当于分组之后又分组
sns.boxplot(y="total_bill", x="day", hue="time", data=tips)
plt.show()
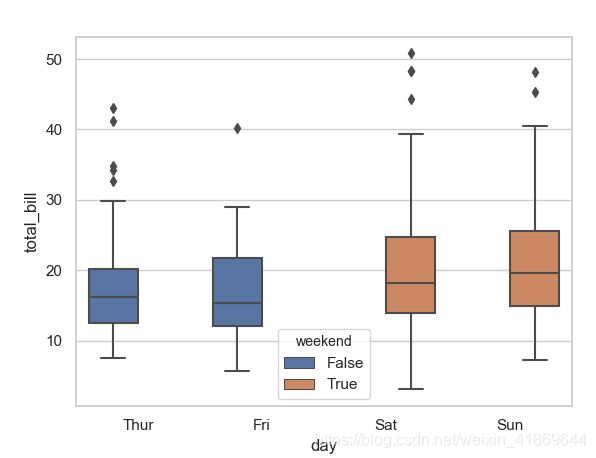
自定义分组
import numpy as np
import pandas as pd
import seaborn as sns
import matplotlib as mpl
import matplotlib.pyplot as plt
sns.set(style="whitegrid", color_codes=True)
np.random.seed(sum(map(ord, "categorical")))
tips = sns.load_dataset("tips")
titanic = sns.load_dataset("titanic")
iris = sns.load_dataset("iris")
#palette 调色板
#分组绘制箱线图,分组因子是day,在x轴不同位置绘制
#分组箱线图,分子因子是time,不同的因子用不同颜色区分
# 相当于分组之后又分组
tips["weekend"] = tips["day"].isin(["Sat", "Sun"])
sns.boxplot(x="day", y="total_bill", hue="weekend",
data=tips)
#sns.boxplot(x=tips["day"], y=tips["total_bill"], hue=tips["weekend"])
plt.show()
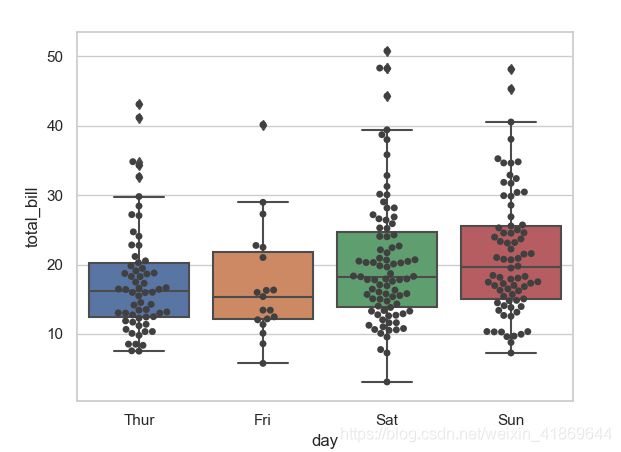
箱线图+有分布趋势的散点图
import numpy as np
import pandas as pd
import seaborn as sns
import matplotlib as mpl
import matplotlib.pyplot as plt
sns.set(style="whitegrid", color_codes=True)
np.random.seed(sum(map(ord, "categorical")))
tips = sns.load_dataset("tips")
titanic = sns.load_dataset("titanic")
iris = sns.load_dataset("iris")
# 图形组合也就是两条绘图语句一起运行就可以了,相当于图形覆盖了
sns.boxplot(x=tips["day"], y=tips["total_bill"])
sns.swarmplot(x="day", y="total_bill", data=tips, color=".25")
plt.show()
分类柱状图
barplot
import seaborn as sns
import matplotlib.pyplot as plt
titanic = sns.load_dataset("titanic")
sns.barplot(x="sex", y="survived", hue="class", data=titanic,capsize=.05)
plt.show()
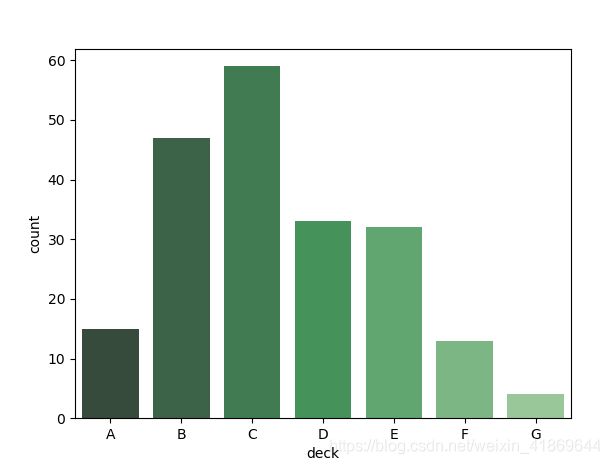
对因子变量计数,然后绘制条形图
import seaborn as sns
import matplotlib.pyplot as plt
titanic = sns.load_dataset("titanic")
sns.countplot(x="deck", data=titanic, palette="Greens_d")
plt.show()
import seaborn as sns
import matplotlib.pyplot as plt
titanic = sns.load_dataset("titanic")
f, ax = plt.subplots(figsize=(7, 3))
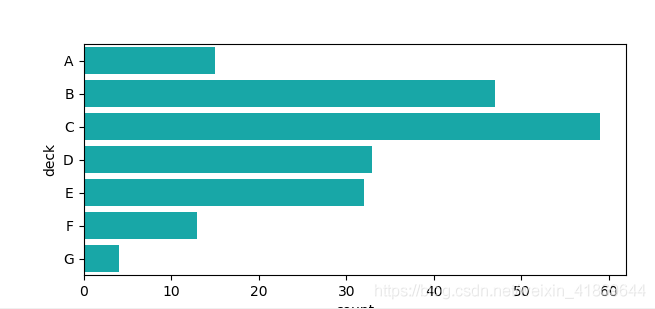
sns.countplot(y="deck", data=titanic, color="c")
plt.show()
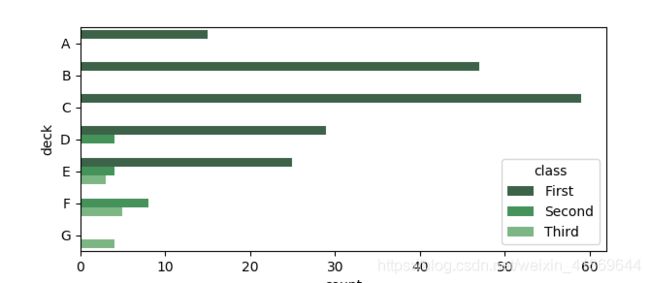
因子变量分类统计
import seaborn as sns
import matplotlib.pyplot as plt
titanic = sns.load_dataset("titanic")
f, ax = plt.subplots(figsize=(7, 3))
sns.countplot(y="deck", hue="class", data=titanic, palette="Greens_d")
plt.show()
import seaborn as sns
import matplotlib.pyplot as plt
titanic = sns.load_dataset("titanic")
ax = sns.countplot(x="class", hue="who", data=titanic)
plt.show()
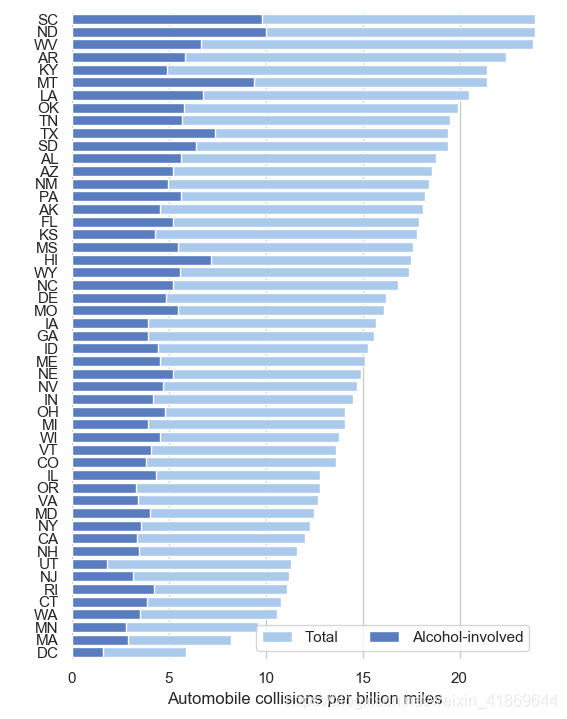
水平堆砌条形图
import seaborn as sns
import matplotlib.pyplot as plt
sns.set(style="whitegrid")
#设置子图的大小
f, ax = plt.subplots(figsize=(6, 15))
#导入数据集car crash dataset
crashes = sns.load_dataset("car_crashes").sort_values("total", ascending=False)
sns.set_color_codes("pastel")
sns.barplot(x="total", y="abbrev", data=crashes,
label="Total", color="b")
sns.set_color_codes("muted")
sns.barplot(x="alcohol", y="abbrev", data=crashes,
label="Alcohol-involved", color="b")
#设置图例和坐标信息
ax.legend(ncol=2, loc="lower right", frameon=True)
ax.set(xlim=(0, 24), ylabel="",
xlabel="Automobile collisions per billion miles")
sns.despine(left=True, bottom=True)
plt.show()
Point plots
import seaborn as sns
import matplotlib.pyplot as plt
titanic = sns.load_dataset("titanic")
print(titanic)
sns.pointplot(x="deck", y="survived", hue="sex", data=titanic,
palette={"male": "g", "female": "m"},
markers=["^", "o"], linestyles=["-", "--"],capsize=0.1)
plt.show()
import seaborn as sns
import matplotlib.pyplot as plt
titanic = sns.load_dataset("titanic")
print(titanic)
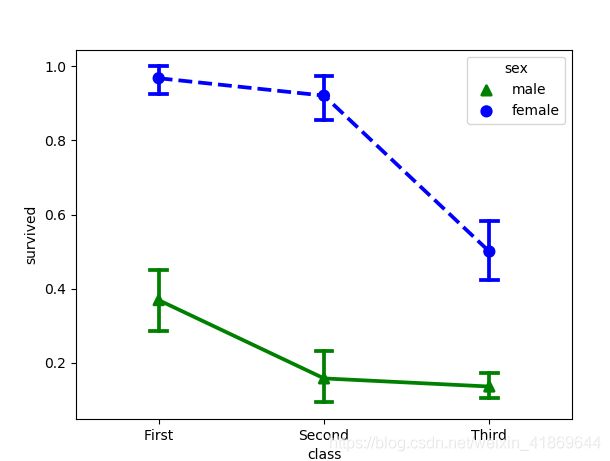
sns.pointplot(x="class", y="survived", hue="sex", data=titanic,
palette={"male": "g", "female": "b"},
markers=["^", "o"], linestyles=["-", "--"],capsize=0.1)
plt.show()
多面板绘图
import seaborn as sns
import matplotlib.pyplot as plt
tips = sns.load_dataset("tips")
sns.factorplot(x="time", y="total_bill", hue="smoker",
col="day", data=tips, kind="box", size=4, aspect=.5,legend=False)
plt.legend(loc = 'best',title ='smoker')
plt.show()
import numpy as np
import pandas as pd
import seaborn as sns
import matplotlib.pyplot as plt
sns.set(style="ticks")
# Create a dataset with many short random walks
rs = np.random.RandomState(4)
pos = rs.randint(-1, 2, (20, 5)).cumsum(axis=1)
pos -= pos[:, 0, np.newaxis]
step = np.tile(range(5), 20)
walk = np.repeat(range(20), 5)
df = pd.DataFrame(np.c_[pos.flat, step, walk],
columns=["position", "step", "walk"])
# Initialize a grid of plots with an Axes for each walk
grid = sns.FacetGrid(df, col="walk", hue="walk", col_wrap=5, size=1.5)
# Draw a horizontal line to show the starting point
grid.map(plt.axhline, y=0, ls=":", c=".5")
# Draw a line plot to show the trajectory of each random walk
grid.map(plt.plot, "step", "position", marker="o", ms=4)
# Adjust the tick positions and labels
grid.set(xticks=np.arange(5), yticks=[-3, 3],
xlim=(-.5, 4.5), ylim=(-3.5, 3.5))
# Adjust the arrangement of the plots
grid.fig.tight_layout(w_pad=1)
plt.show()
注:本文转自:https://blog.csdn.net/sunchengquan/article/details/78964132
本博主新开公众号, 希望大家能扫码关注一下,十分感谢大家。


