Python实战之MNIST手写数字识别详解
更多python教程请到友情连接: 菜鸟教程https://www.piaodoo.com
初中毕业读什么技校 http://cntkd.net
茂名一技http://www.enechn.com
ppt制作教程步骤 http://www.tpyjn.cn
兴化论坛http://www.yimoge.cn
电白论坛 http://www.fcdzs.com
数据集介绍
MNIST数据集是机器学习领域中非常经典的一个数据集,由60000个训练样本和10000个测试样本组成,每个样本都是一张28 * 28像素的灰度手写数字图片,且内置于keras。本文采用Tensorflow下Keras(Keras中文文档)神经网络API进行网络搭建。
开始之前,先回忆下机器学习的通用工作流程( √表示本文用到,×表示本文没有用到 )
1.定义问题,收集数据集(√)
2.选择衡量成功的指标(√)
3.确定评估的方法(√)
4.准备数据(√)
5.开发比基准更好的模型(×)
6.扩大模型规模(×)
7.模型正则化与调节参数(×)
关于最后一层激活函数与损失函数的选择
下面开始正文~
1.数据预处理
首先导入数据,要使用mnist.load()函数
我们来看看它的源码声明:
def load_data(path='mnist.npz'):
  """Loads the [MNIST dataset](http://yann.lecun.com/exdb/mnist/).
This is a dataset of 60,000 28x28 grayscale images of the 10 digits,
along with a test set of 10,000 images.
More info can be found at the
MNIST homepage.
Arguments:
path: path where to cache the dataset locally
(relative to ~/.keras/datasets).
Returns:
Tuple of Numpy arrays: (x_train, y_train), (x_test, y_test).
x_train, x_test: uint8 arrays of grayscale image data with shapes
(num_samples, 28, 28).
  **y_train, y_test**: uint8 arrays of digit labels (integers in range 0-9)
    with shapes (num_samples,).
“”"
可以看到,里面包含了数据集的下载链接,以及数据集规模、尺寸以及数据类型的声明,且函数返回的是四个numpy array组成的两个元组。
导入数据集并reshape至想要形状,再标准化处理。
其中内置于keras的to_categorical()就是one-hot编码——将每个标签表示为全零向量,只有标签索引对应的元素为1.
eg: col=10
[0,1,9]-------->[ [1,0,0,0,0,0,0,0,0,0],
                  [0,1,0,0,0,0,0,0,0,0],
                  [0,0,0,0,0,0,0,0,0,1] ]
我们可以手动实现它:
def one_hot(sequences,col):
        resuts=np.zeros((len(sequences),col))
        # for i,sequence in enumerate(sequences):
        #         resuts[i,sequence]=1
        for i in range(len(sequences)):
                for j in range(len(sequences[i])):
                        resuts[i,sequences[i][j]]=1
        return resuts
下面是预处理过程
def data_preprocess():
    (train_images, train_labels), (test_images, test_labels) = mnist.load_data()
    train_images = train_images.reshape((60000, 28, 28, 1))
    train_images = train_images.astype('float32') / 255
    #print(train_images[0])
    test_images = test_images.reshape((10000, 28, 28, 1))
    test_images = test_images.astype('float32') / 255
train_labels = to_categorical(train_labels)
test_labels = to_categorical(test_labels)
return train_images,train_labels,test_images,test_labels
2.网络搭建
这里我们搭建的是卷积神经网络,就是包含一些卷积、池化、全连接的简单线性堆积。我们知道多个线性层堆叠实现的仍然是线性运算,添加层数并不会扩展假设空间(从输入数据到输出数据的所有可能的线性变换集合),因此需要添加非线性或激活函数。relu是最常用的激活函数,也可以用prelu、elu
def build_module():
    model = models.Sequential()
    #第一层卷积层,首层需要指出input_shape形状
    model.add(layers.Conv2D(32, (3,3), activation='relu', input_shape=(28,28,1)))
    #第二层最大池化层
    model.add(layers.MaxPooling2D((2,2)))
    #第三层卷积层
    model.add(layers.Conv2D(64, (3,3), activation='relu'))
    #第四层最大池化层
    model.add(layers.MaxPooling2D((2,2)))
    #第五层卷积层
    model.add(layers.Conv2D(64, (3,3), activation='relu'))
    #第六层Flatten层,将3D张量平铺为向量
    model.add(layers.Flatten())
    #第七层全连接层
    model.add(layers.Dense(64, activation='relu'))
    #第八层softmax层,进行分类
    model.add(layers.Dense(10, activation='softmax'))
    return model
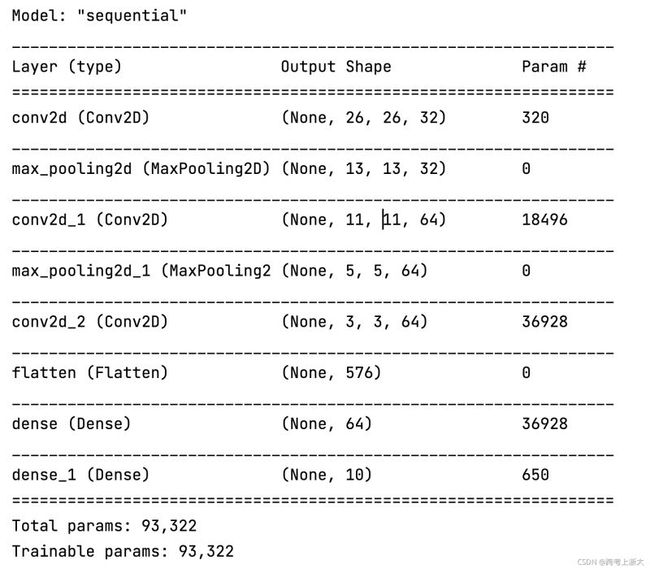
使用model.summary()查看搭建的网路结构:
3.网络配置
网络搭建好之后还需要关键的一步设置配置。比如:优化器——网络梯度下降进行参数更新的具体方法、损失函数——衡量生成值与目标值之间的距离、评估指标等。配置这些可以通过 model.compile() 参数传递做到。
我们来看看model.compile()的源码分析下:
  def compile(self,
              optimizer='rmsprop',
              loss=None,
              metrics=None,
              loss_weights=None,
              weighted_metrics=None,
              run_eagerly=None,
              steps_per_execution=None,
              **kwargs):
    """Configures the model for training.
关于优化器
优化器:字符串(优化器名称)或优化器实例。
字符串格式:比如使用优化器的默认参数
实例优化器进行参数传入:
keras.optimizers.RMSprop(lr=0.001, rho=0.9, epsilon=None, decay=0.0)
model.compile(optimizer='rmsprop',loss='mean_squared_error')
建议使用优化器的默认参数 (除了学习率 lr,它可以被自由调节)
参数:
lr: float >= 0. 学习率。
rho: float >= 0. RMSProp梯度平方的移动均值的衰减率.
epsilon: float >= 0. 模糊因子. 若为 None, 默认为 K.epsilon()。
decay: float >= 0. 每次参数更新后学习率衰减值。
类似还有好多优化器,比如SGD、Adagrad、Adadelta、Adam、Adamax、Nadam等
关于损失函数
取决于具体任务,一般来说损失函数要能够很好的刻画任务。比如
1.回归问题
希望神经网络输出的值与ground-truth的距离更近,选取能刻画距离的loss应该会更合适,比如L1 Loss、MSE Loss等
2.分类问题
希望神经网络输出的类别与ground-truth的类别一致,选取能刻画类别分布的loss应该会更合适,比如cross_entropy
具体常见选择可查看文章开始处关于损失函数的选择
关于指标
常规使用查看上述列表即可。下面说说自定义评价函数:它应该在编译的时候(compile)传递进去。该函数需要以 (y_true, y_pred) 作为输入参数,并返回一个张量作为输出结果。
import keras.backend as K
def mean_pred(y_true, y_pred):
    return K.mean(y_pred)
model.compile(optimizer=‘rmsprop’,
loss=‘binary_crossentropy’,
metrics=[‘accuracy’, mean_pred])
4.网络训练与测试
1.训练(拟合)
使用model.fit(),它可以接受的参数列表
def fit(self,
          x=None,
          y=None,
          batch_size=None,
          epochs=1,
          verbose=1,
          callbacks=None,
          validation_split=0.,
          validation_data=None,
          shuffle=True,
          class_weight=None,
          sample_weight=None,
          initial_epoch=0,
          steps_per_epoch=None,
          validation_steps=None,
          validation_batch_size=None,
          validation_freq=1,
          max_queue_size=10,
          workers=1,
          use_multiprocessing=False):
这个源码有300多行长,具体的解读放在下次。
我们对训练数据进行划分,以64个样本为小批量进行网络传递,对所有数据迭代5次
model.fit(train_images, train_labels, epochs = 5, batch_size=64)
2.测试
使用model.evaluates()函数
test_loss, test_acc = model.evaluate(test_images, test_labels)
关于测试函数的返回声明:
Returns:
        Scalar test loss (if the model has a single output and no metrics)
        or list of scalars (if the model has multiple outputs
        and/or metrics). The attribute `model.metrics_names` will give you
        the display labels for the scalar outputs.
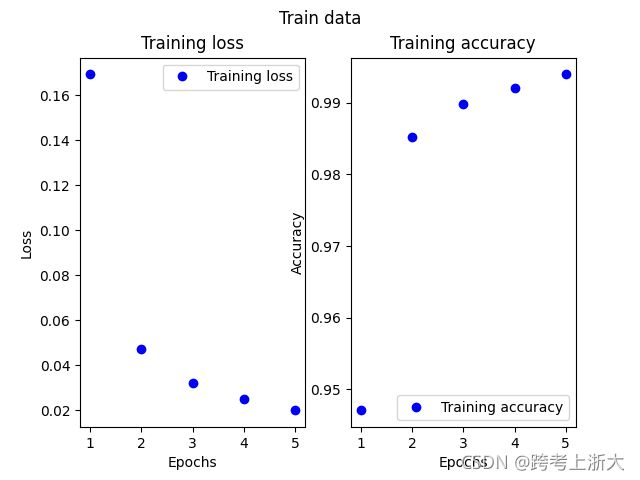
5.绘制loss和accuracy随着epochs的变化图
model.fit()返回一个History对象,它包含一个history成员,记录了训练过程的所有数据。
我们采用matplotlib.pyplot进行绘图,具体见后面完整代码。
Returns:
        A `History` object. Its `History.history` attribute is
        a record of training loss values and metrics values
        at successive epochs, as well as validation loss values
        and validation metrics values (if applicable).
def draw_loss(history):
    loss=history.history['loss']
    epochs=range(1,len(loss)+1)
    plt.subplot(1,2,1)#第一张图
    plt.plot(epochs,loss,'bo',label='Training loss')
    plt.title("Training loss")
    plt.xlabel('Epochs')
    plt.ylabel('Loss')
    plt.legend()
plt.subplot(1,2,2)#第二张图
accuracy=history.history['accuracy']
plt.plot(epochs,accuracy,'bo',label='Training accuracy')
plt.title("Training accuracy")
plt.xlabel('Epochs')
plt.ylabel('Accuracy')
plt.suptitle("Train data")
plt.legend()
plt.show()
6.完整代码
from tensorflow.keras.datasets import mnist
from tensorflow.keras import models
from tensorflow.keras import layers
from tensorflow.keras.utils import to_categorical
import matplotlib.pyplot as plt
import numpy as np
def data_preprocess():
    (train_images, train_labels), (test_images, test_labels) = mnist.load_data()
    train_images = train_images.reshape((60000, 28, 28, 1))
    train_images = train_images.astype('float32') / 255
    #print(train_images[0])
    test_images = test_images.reshape((10000, 28, 28, 1))
    test_images = test_images.astype('float32') / 255
train_labels = to_categorical(train_labels)
test_labels = to_categorical(test_labels)
return train_images,train_labels,test_images,test_labels
#搭建网络
def build_module():
model = models.Sequential()
#第一层卷积层
model.add(layers.Conv2D(32, (3,3), activation=‘relu’, input_shape=(28,28,1)))
#第二层最大池化层
model.add(layers.MaxPooling2D((2,2)))
#第三层卷积层
model.add(layers.Conv2D(64, (3,3), activation=‘relu’))
#第四层最大池化层
model.add(layers.MaxPooling2D((2,2)))
#第五层卷积层
model.add(layers.Conv2D(64, (3,3), activation=‘relu’))
#第六层Flatten层,将3D张量平铺为向量
model.add(layers.Flatten())
#第七层全连接层
model.add(layers.Dense(64, activation=‘relu’))
#第八层softmax层,进行分类
model.add(layers.Dense(10, activation=‘softmax’))
return model
def draw_loss(history):
loss=history.history[‘loss’]
epochs=range(1,len(loss)+1)
plt.subplot(1,2,1)#第一张图
plt.plot(epochs,loss,‘bo’,label=‘Training loss’)
plt.title(“Training loss”)
plt.xlabel(‘Epochs’)
plt.ylabel(‘Loss’)
plt.legend()
plt.subplot(1,2,2)#第二张图
accuracy=history.history['accuracy']
plt.plot(epochs,accuracy,'bo',label='Training accuracy')
plt.title("Training accuracy")
plt.xlabel('Epochs')
plt.ylabel('Accuracy')
plt.suptitle("Train data")
plt.legend()
plt.show()
if name==‘main’:
train_images,train_labels,test_images,test_labels=data_preprocess()
model=build_module()
print(model.summary())
model.compile(optimizer=‘rmsprop’, loss = ‘categorical_crossentropy’, metrics=[‘accuracy’])
history=model.fit(train_images, train_labels, epochs = 5, batch_size=64)
draw_loss(history)
test_loss, test_acc = model.evaluate(test_images, test_labels)
print(‘test_loss=’,test_loss,’ test_acc = ', test_acc)
迭代训练过程中loss和accuracy的变化
由于数据集比较简单,随便的神经网络设计在测试集的准确率可达到99.2%
以上就是Python实战之MNIST手写数字识别详解的详细内容,更多关于Python MNIST手写数字识别的资料请关注菜鸟教程www.piaodoo.com其它相关文章!


