【计算机视觉】:(1)基本的图像处理和操作
【计算机视觉】:(1)基本的图像处理和操作
- 1. 直方图
- 2. 高斯滤波
- 3. 直方图均衡化
1. 直方图
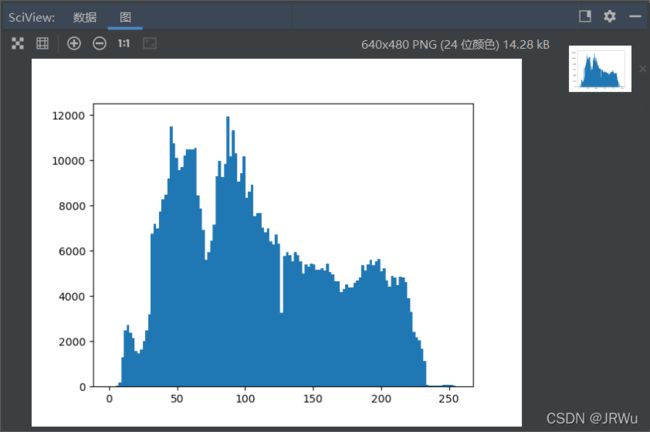
图像的直方图是用来表征图像像素值的分布情况。用一定数目的小区间(bin)来指定表征像素值的范围,每个小区间会得到落入该小区间表示范围的像素数目。该(灰度)图像的直方图可以使用hist()函数绘制,代码如下:
from PIL import Image
from pylab import *

"""
函数说明:绘制直方图

Parameters:
    无
Returns:
    无
"""
def Histogram():
    #读取图像到数组中并转换成灰度图像
    img = array(Image.open('jmu.jpg').convert('L'))
    #新建一个图像
    figure()
    hist(img.flatten(),128)
    show()

if __name__ == '__main__':
    Histogram()
2. 高斯滤波
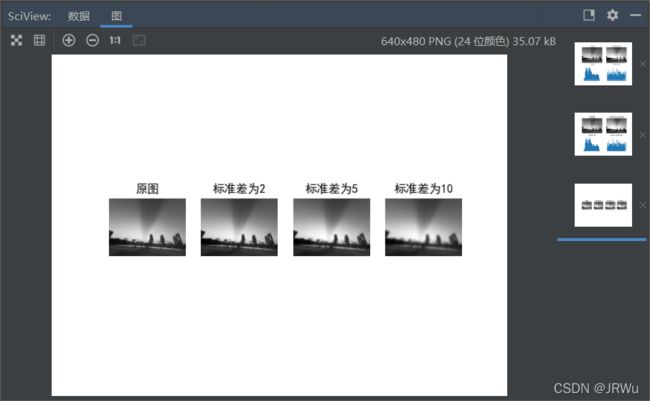
高斯滤波是一个经典的并且十分有用的图像卷积例子。高斯滤波可以用于定义图像尺度、计算兴趣点以及很多其他的应用场合。
代码如下:
from PIL import Image
from pylab import *
from scipy.ndimage import filters

"""
函数说明:高斯滤波

Parameters:
    无
Returns:
    无
"""
def Gaussian():
    img = array(Image.open('jmu.jpg').convert('L'))

    figure()
    gray()
    axis('off')
    subplot(1, 4, 1)
    axis('off')
    title('原图')
    imshow(img)

    for bi, blur in enumerate([2, 5, 10]):
        img2 = zeros(img.shape)
        img2 = filters.gaussian_filter(img, blur)
        img2 = np.uint8(img2)
        imNum=str(blur)
        subplot(1, 4, 2 + bi)
        axis('off')
        title('标准差为'+imNum)
        imshow(img2)
    show()

if __name__ == '__main__':
    #高斯滤波
    mpl.rcParams['font.sans-serif'] = ['SimHei']
    Gaussian()
3. 直方图均衡化
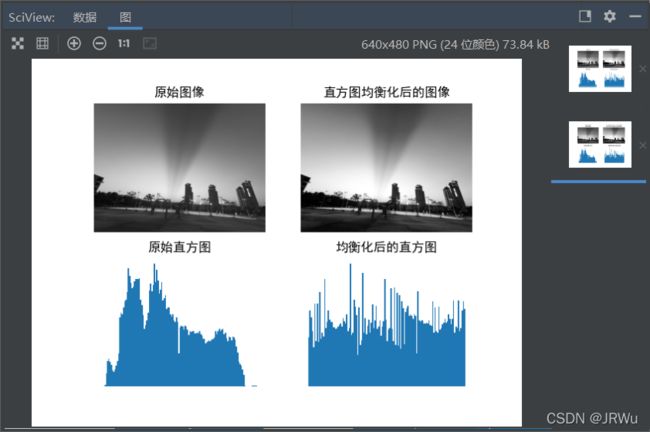
直方图均衡化是灰度变换的一种,指的是将一幅图像的灰度直方图变平,使变换后的图像中每个灰度值的分布概率都相同。可对图像灰度值起到归一化的作用,并且可以增强图像的对比度。
直方图均衡化的变换函数是图像中像素值的累积分布函数。
代码如下:
from PIL import Image
from pylab import *
from numpy import *
"""
函数说明:直方图均衡化

Parameters:
    img:灰度图像
    nbr_bins=256:直方图使用小区间的数目
Returns:
    img2.reshape(img.shape):直方图均衡化后的图像
    cdf:用来做像素值映射的累积分布函数
"""
def Histeq(img,nbr_bins=256):
    #计算图像的直方图
    imhist,bins=histogram(img.flatten(),nbr_bins)
    #累计分布函数
    cdf = imhist.cumsum()
    #归一化
    cdf = 255*cdf/cdf[-1]
    #使用累积分布函数的线性插值,计算新的像素值
    img2 = interp(img.flatten(),bins[:-1],cdf)

    return img2.reshape(img.shape),cdf

if __name__ == '__main__':
    #直方图均衡化
    #解决title是方框的问题
    mpl.rcParams['font.sans-serif'] = ['SimHei']
    img = array(Image.open('jmu.jpg').convert('L'))
    img2,cdf = Histeq(img)

    figure()
    subplot(2, 2, 1)
    #关闭所有坐标轴线、刻度标记和标签
    axis('off')
    gray()
    title('原始图像')
    imshow(img)

    subplot(2, 2, 2)
    axis('off')
    title('直方图均衡化后的图像')
    imshow(img2)

    subplot(2, 2, 3)
    axis('off')
    title('原始直方图')
    # hist(im.flatten(), 128, cumulative=True, normed=True)
    hist(img.flatten(), 128)

    subplot(2, 2, 4)
    axis('off')
    title('均衡化后的直方图')
    # hist(im2.flatten(), 128, cumulative=True, normed=True)
    hist(img2.flatten(), 128)

    show()


