经典卷积神经网络---VGG16详解
一.VGG概述
VGGNet是牛津大学视觉几何组(Visual Geometry Group)提出的模型,该模型在2014ImageNet图像分类与定位挑战赛 ILSVRC-2014中取得在分类任务第二,定位任务第一的优异成绩。VGGNet突出的贡献是证明了很小的卷积,通过增加网络深度可以有效提高性能。VGG很好的继承了Alexnet的衣钵同时拥有着鲜明的特点。即网络层次较深。
VGGNet结构
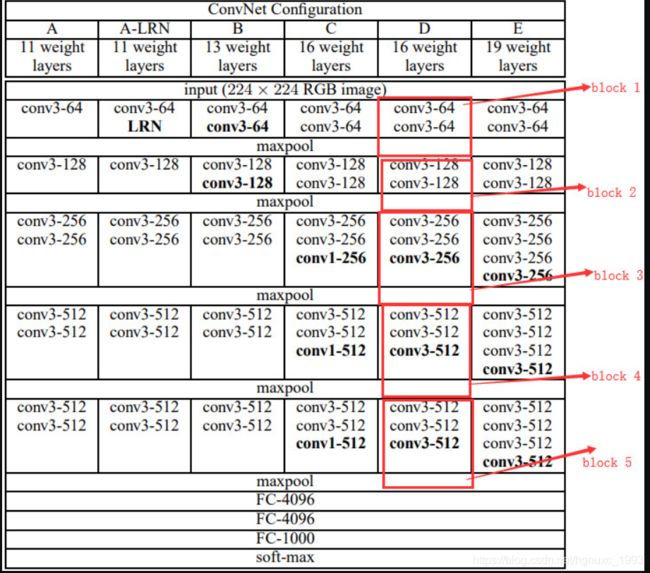
VGGNet模型有A-E五种结构网络,深度分别为11,11,13,16,19。其中较为典型的网络结构主要有vgg16和vgg19,本篇文章主要讲VGG16,并分享VGG16的Keras实现。其网络结构如下图中D列(红色方框):
VGG16网络结构
vggnet对输入图像的默认大小是224*224*3 (从表中input可以看出)。vgg16网络结构含有参数的网络层一共有16层,即13个卷积层,5个池化层,3个全连接层,不包括激活层。
vgg16网络结构可以划分为6个模块层次加1个输入模块,分别如下
| 模块 | 各模块的涉及的层次 |
| 输入模块 | 224*224*3 |
| 第一个模块 | conv3-64 |
| conv3-64 | |
| maxpool | |
| 第二个模块 | conv3-128 |
| conv3-128 | |
| maxpool | |
| 第三个模块 | conv3-256 |
| conv3-256 | |
| conv3-256 | |
| maxpool | |
| 第四个模块 | conv3-512 |
| conv3-512 | |
| conv3-512 | |
| maxpool | |
| 第五个模块 | conv-512 |
| conv3-512 | |
| conv3-512 | |
| maxpool | |
| 第六个模块(全连接层和输出层) | FC-4096 (实际上前面需要加一个Flatten层) |
| FC-4096 | |
| FC-1000 (负责分类) | |
| softmax(输出层函数) |
二.vgg16实现MNIST分类
(基于keras框架)
代码实现:
#从keras.model中导入model模块,为函数api搭建网络做准备
from keras.models import Model
from keras.layers import Flatten,Dense,Dropout,MaxPooling2D,Conv2D,BatchNormalization,Input,ZeroPadding2D,Concatenate
from keras.layers.convolutional import AveragePooling2D
from keras import regularizers  #正则化
from keras.optimizers import RMSprop  #优化选择器
from keras.layers import AveragePooling2D
from keras.datasets import mnist
from keras.utils import np_utils
import matplotlib.pyplot as plt
import numpy as np

#数据处理
(X_train,Y_train),(X_test,Y_test)=mnist.load_data()
X_test1=X_test
Y_test1=Y_test
X_train=X_train.reshape(-1,28,28,1).astype("float32")/255.0
X_test=X_test.reshape(-1,28,28,1).astype("float32")/255.0
Y_train=np_utils.to_categorical(Y_train,10)
Y_test=np_utils.to_categorical(Y_test,10)
print(X_train.shape)
print(Y_train.shape)
print(X_train.shape)

def vgg16():
    x_input = Input((28, 28, 1))  # 输入数据形状28*28*1
    # Block 1
    x = Conv2D(64, (3, 3), activation='relu', padding='same', name='block1_conv1')(x_input)
    x = Conv2D(64, (3, 3), activation='relu', padding='same', name='block1_conv2')(x)
    x = MaxPooling2D((2, 2), strides=(2, 2), name='block1_pool')(x)

    # Block 2
    x = Conv2D(128, (3, 3), activation='relu', padding='same', name='block2_conv1')(x)
    x = Conv2D(128, (3, 3), activation='relu', padding='same', name='block2_conv2')(x)
    x = MaxPooling2D((2, 2), strides=(2, 2), name='block2_pool')(x)

    # Block 3
    x = Conv2D(256, (3, 3), activation='relu', padding='same', name='block3_conv1')(x)
    x = Conv2D(256, (3, 3), activation='relu', padding='same', name='block3_conv2')(x)
    x = Conv2D(256, (3, 3), activation='relu', padding='same', name='block3_conv3')(x)
    x = MaxPooling2D((2, 2), strides=(2, 2), name='block3_pool')(x)

    # Block 4
    x = Conv2D(512, (3, 3), activation='relu', padding='same', name='block4_conv1')(x)
    x = Conv2D(512, (3, 3), activation='relu', padding='same', name='block4_conv2')(x)
    x = Conv2D(512, (3, 3), activation='relu', padding='same', name='block4_conv3')(x)
    x = MaxPooling2D((2, 2), strides=(2, 2), name='block4_pool')(x)

    # Block 5
    x = Conv2D(512, (3, 3), activation='relu', padding='same', name='block5_conv1')(x)
    x = Conv2D(512, (3, 3), activation='relu', padding='same', name='block5_conv2')(x)
    x = Conv2D(512, (3, 3), activation='relu', padding='same', name='block5_conv3')(x)

    #BLOCK 6
    x=Flatten()(x)
    x=Dense(256,activation="relu")(x)
    x=Dropout(0.5)(x)
    x = Dense(256, activation="relu")(x)
    x = Dropout(0.5)(x)
    #搭建最后一层,即输出层
    x = Dense(10, activation="softmax")(x)
    # 调用MDOEL函数,定义该网络模型的输入层为X_input,输出层为x.即全连接层
    model = Model(inputs=x_input, outputs=x)
    # 查看网络模型的摘要
    model.summary()
    return model
model=vgg16()
optimizer=RMSprop(lr=1e-4)
model.compile(loss="binary_crossentropy",optimizer=optimizer,metrics=["accuracy"])
#训练加评估模型
n_epoch=4
batch_size=128
def run_model(): #训练模型
    training=model.fit(
    X_train,
    Y_train,
    batch_size=batch_size,
    epochs=n_epoch,
    validation_split=0.25,
    verbose=1
    )
    test=model.evaluate(X_train,Y_train,verbose=1)
    return training,test
training,test=run_model()
print("误差:",test[0])
print("准确率:",test[1])

def show_train(training_history,train, validation):
    plt.plot(training.history[train],linestyle="-",color="b")
    plt.plot(training.history[validation] ,linestyle="--",color="r")
    plt.title("training history")
    plt.xlabel("epoch")
    plt.ylabel("accuracy")
    plt.legend(["training","validation"],loc="lower right")
    plt.show()
show_train(training,"accuracy","val_accuracy")

def show_train1(training_history,train, validation):
    plt.plot(training.history[train],linestyle="-",color="b")
    plt.plot(training.history[validation] ,linestyle="--",color="r")
    plt.title("training history")
    plt.xlabel("epoch")
    plt.ylabel("loss")
    plt.legend(["training","validation"],loc="upper right")
    plt.show()
show_train1(training,"loss","val_loss")

prediction=model.predict(X_test)
def image_show(image):
    fig=plt.gcf()  #获取当前图像
    fig.set_size_inches(2,2)  #改变图像大小
    plt.imshow(image,cmap="binary")  #显示图像
    plt.show()
def result(i):
    image_show(X_test1[i])
    print("真实值:",Y_test1[i])
    print("预测值:",np.argmax(prediction[i]))
result(0)
result(1)

