R语言|美化图表外观(一)———R语言数据可视化系列(四)
可视化之控制图像外观
-
- 设置图像标题
-
- 使用ggtitle添加标题
- 使用文本标注添加标题
- 修改文本外观
-
- 在图像内加入文本标签
- 小结一下
- 完整代码
-
-
- 创作不易,各位看官求三连(点赞+收藏+转发),你们的鼓(dainzhan)励(shoucang)是我创作的动力。
-
设置图像标题
图表是用来呈现大量复杂的数据的好工具,能节省许多空间,能将数据内涵直观表达出来,也能一目了然。但是好的图表一般都得有好的标题,这样方便人们去了解接下来的图表主要传达的内容。
使用ggtitle添加标题
在使用ggtitle函数的时候,一般还需要配套ggplot的主题函数(theme)对标题的大小,位置,颜色等属性进行控制。
### 控制图像外观
#### 设置图像标题
library(ggplot2)       # 加载绘图包
library(gcookbook)     # 加载数据集

##### 使用ggtitle添加标题
ggplot(heightweight, aes(x = ageYear, y = heightIn))+          # 选择数据
  geom_point()+                                                # 绘制散点图
  ggtitle("Age and Height of Schoolchildren")+                 # 生成标题内容
  theme (plot.title=element_text (hjust = 0.5,vjust = -5))     # 调整标题位置
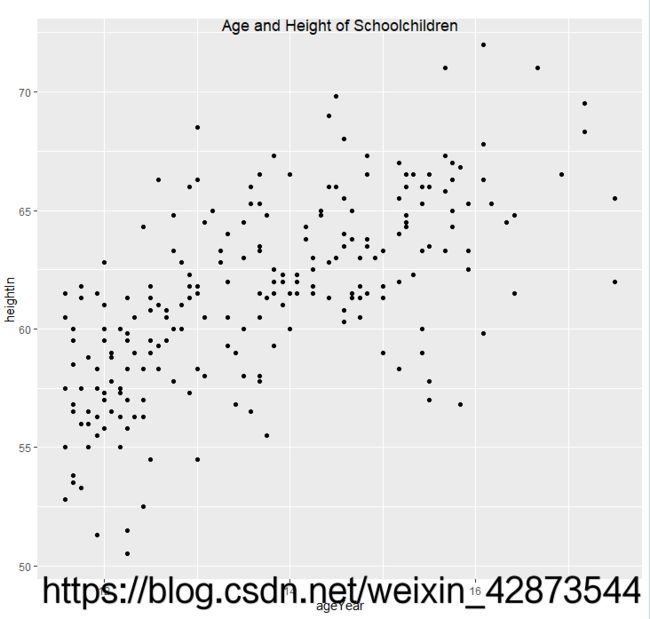
 图1 ggtitle默认图像 图1 ggtitle默认图像
|
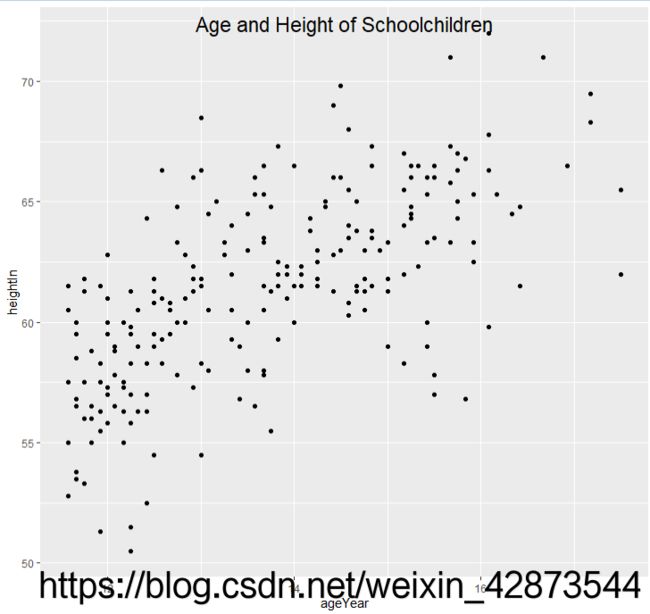
 图2 ggtitle调整图像 图2 ggtitle调整图像
|
如图2,加以任何修饰之后,可以看出标题可以居中,也可以位于坐标轴内。
使用文本标注添加标题
这种方式则是使用一个文本注解,设定其x的位置为x值域的中间,y的位置为Inf,这样就会将其置于绘图区域的顶部。这种方法同时需要vjust为正值,以使文本完全落入绘图区域。其本质原因是文本注解一般为了解释图表的数据或线条而存在,使用时一般存在于坐标面板内。这样他的缺陷也就显现了,他不能位于图表上方。
##### 使用文本注解添加标题
ggplot(heightweight, aes(x = ageYear, y = heightIn))+          # 选择数据
  geom_point()+                                                # 绘制散点图
  annotate("text", x = mean(range(heightweight$ageYear)), y = Inf,
           label = "Age and Height of Schoolchildren",
           vjust = 1.5, size = 6)                              # 添加文本注解
 图3 annotate函数绘制的图像
修改文本外观
如何修改图像中的文本外观呢?要设置如标题、坐标轴标签和坐标轴刻度线等主题项目(theme item)的外观,使用theme()并通过element_ text ()设定对应项目的属性即可。举例来说,axis.title.x控制着x轴标签的外观,而plot. title则控制着标题文本的外观:
ggplot(heightweight, aes(x = ageYear, y = heightIn))+               # 选择数据
  geom_point()+                                                     # 绘制散点图
  theme(axis.title.x = element_text(size = 16, lineheight = .9,     # 编辑x轴标签文本
                                    family = "黑体", colour = "red"))

ggplot(heightweight, aes(x = ageYear, y = heightIn))+               # 选择数据
  geom_point()+                                                     # 绘制散点图
  ggtitle("Age and Height \nof Schoolchildren")+                    # 生成标题内容
  theme (plot.title=element_text (size = rel(1.5), hjust = 0.5,     # 编辑标题标签文本
                                  colour = "red", lineheight = .9))
 图4 修改x轴标签文本的图像 图4 修改x轴标签文本的图像
|
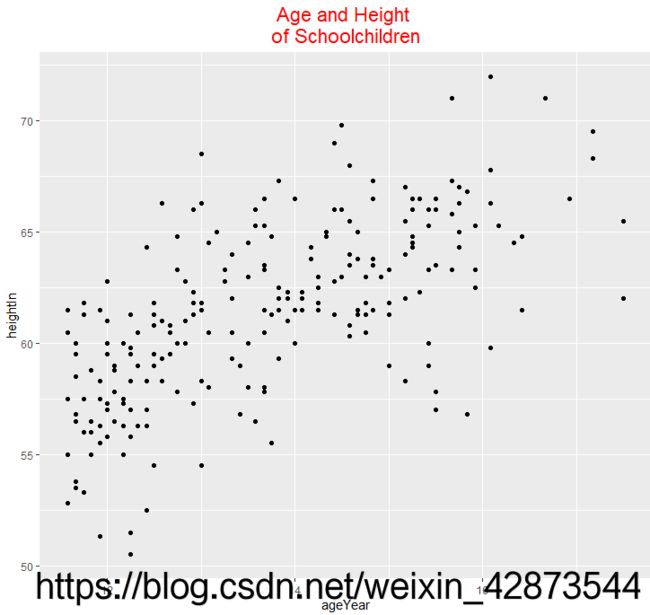
 图5 修改标题标签文本的图像 图5 修改标题标签文本的图像
|
仔细观察不难发现,图4的x轴文本标签的颜色,大小等均有明显变化,而图5更为明显,在标题文本标签可以看出巨大的变化。
在图像内加入文本标签
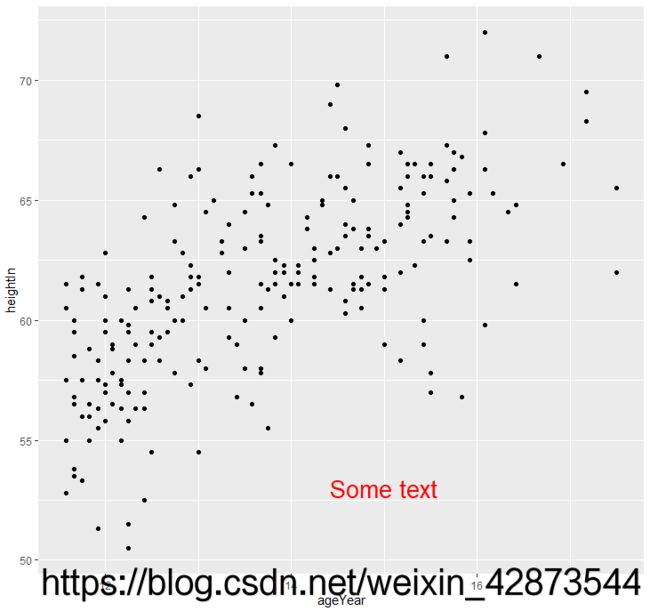
要设置文本几何对象(即在图形内部使用geom_ text() 或annotate ()添加的文本)的外观,只需设置其文本属性即可。举例来说:
##### 在图像内部加入文本标签
ggplot(heightweight, aes(x = ageYear, y = heightIn))+               # 选择数据
  geom_point()+                                                     # 绘制散点图
  annotate("text", x = 15, y = 53, label = "Some text",             # 插入文本标签
           size = 7, colour = "red")

ggplot(heightweight, aes(x = ageYear, y = heightIn))+               # 选择数据
  geom_point()+                                                     # 绘制散点图
  geom_text (aes (label=weightLb), size=4, colour="red")            # 插入文本标签
 图6 指定位置加入标签的图像 图6 指定位置加入标签的图像
|
 图5 所有位置加入标签的图像 图5 所有位置加入标签的图像
|
小结一下
在ggplot2中,文本项目分为两类:主题元素和文本几何对象。主题元素包括图形中的所有非数据元素:如标题、图例和坐标轴。文本几何对象则属于图形本身的一部分。
控制两类文本项目属性的参数略有不同,如表一所示。
| 主题元素 | 文本几何对象 | 说明 |
|---|---|---|
| family | family | Helvetica (无衬线)、Times (衬线)、Courier (等宽) |
| face | fontface | plain (普通)、bold (粗体)、italic (斜体)、bold.italic (粗斜体) |
| colour | colour | 文字颜色(颜色名称或"#RRGGBB"形式的十六进制颜色代码) |
| size | size | 字体大小(主题元素的单位是磅,几何对象的单位是毫米) |
| hjust | hjust | 横向对齐: 0=左对齐,0.5= 居中,1=右对齐 |
| vjust | vjust | 纵向对齐: 0=底部对齐,0.5= 居中,1= 顶部对齐 |
| angle | angle | 旋转角度,单位为度 |
| lineheight | lineheight | 行间距倍数 |
而在更改文本标签的文字形式时,使用的theme函数的使用说明如表二所示:
| 元素名称 | 说明 |
|---|---|
| axis.title | 双轴的标签外观 |
| axis.title.x | x轴的标签外观 |
| axis.title.y | y轴的标签外观 |
| axis.ticks | 双轴刻度标签的外观 |
| axis.ticks.x | x轴刻度标签的外观 |
| axis.ticks.y | y轴刻度标签的外观 |
| legend.title | 图标标题的外观 |
| legend.text | 图例项文本的外观 |
| plot.title | 图形总标题的外观 |
| strip.text | 双向分面标签的外观 |
| strip.text.x | 横向分面标签的外观 |
| strip.text.y | 纵向分面标签的外观 |
完整代码
### 控制图像外观
#### 设置图像标题
library(ggplot2)       # 加载绘图包
library(gcookbook)     # 加载数据集

##### 使用ggtitle添加标题
ggplot(heightweight, aes(x = ageYear, y = heightIn))+          # 选择数据
  geom_point()+                                                # 绘制散点图
  ggtitle("Age and Height of Schoolchildren")+                 # 生成标题内容
  theme (plot.title=element_text (hjust = 0.5,vjust = -5))     # 调整标题位置

##### 使用文本注解添加标题
ggplot(heightweight, aes(x = ageYear, y = heightIn))+          # 选择数据
  geom_point()+                                                # 绘制散点图
  annotate("text", x = mean(range(heightweight$ageYear)), y = Inf,
           label = "Age and Height of Schoolchildren",
           vjust = 1.5, size = 6)                              # 添加文本注解

#### 9.2修改文本外观
ggplot(heightweight, aes(x = ageYear, y = heightIn))+               # 选择数据
  geom_point()+                                                     # 绘制散点图
  theme(axis.title.x = element_text(size = 16, lineheight = .9,     # 编辑x轴标签文本
                                    family = "黑体", colour = "red"))

ggplot(heightweight, aes(x = ageYear, y = heightIn))+               # 选择数据
  geom_point()+                                                     # 绘制散点图
  ggtitle("Age and Height \nof Schoolchildren")+                    # 生成标题内容
  theme (plot.title=element_text (size = rel(1.5), hjust = 0.5,     # 编辑标题标签文本
                                  colour = "red", lineheight = .9))

##### 在图像内部加入文本标签
ggplot(heightweight, aes(x = ageYear, y = heightIn))+               # 选择数据
  geom_point()+                                                     # 绘制散点图
  annotate("text", x = 15, y = 53, label = "Some text",             # 插入文本标签
           size = 7, colour = "red")

ggplot(heightweight, aes(x = ageYear, y = heightIn))+               # 选择数据
  geom_point()+                                                     # 绘制散点图
  geom_text (aes (label=weightLb), size=4, colour="red")            # 插入文本标签