介绍
AUC(Area Under Curve)被定义为ROC曲线下与坐标轴围成的面积,显然这个面积的数值不会大于1。又由于ROC曲线一般都处于y=x这条直线的上方,所以AUC的取值范围在0.5和1之间。AUC越接近1.0,检测方法真实性越高;等于0.5时,则真实性最低,无应用价值。
auc计算方式:参考Python实现计算AUC的示例代码
实现代码
import numpy as np
from sklearn.metrics import roc_auc_score
y_true = [1,1,0,0,1,1,0]
y_pred = [0.8,0.7,0.5,0.5,0.5,0.5,0.3]
print(roc_auc_score(y_true, y_pred))
# 下面实现的是方法1
# https://blog.csdn.net/lieyingkub99/article/details/81266664?utm_medium=distribute.pc_relevant.none-task-blog-title-1&spm=1001.2101.3001.4242
def cal_auc1(y_true, y_pred):
    n_bins = 10
    postive_len = sum(y_true)  # M正样本个数
    negative_len = len(y_true) - postive_len  # N负样本个数
    total_case = postive_len * negative_len  # M * N样本对数
    pos_histogram = [0 for _ in range(n_bins)]  # 保存每一个概率值下的正样本个数
    neg_histogram = [0 for _ in range(n_bins)]  # 保存每一个概率值下的负样本个数
    bin_width = 1.0 / n_bins
    for i in range(len(y_true)):
        nth_bin = int(y_pred[i] / bin_width)  # 概率值转化为整数下标
        if y_true[i] == 1:
            pos_histogram[nth_bin] += 1
        else:
            neg_histogram[nth_bin] += 1
    print(pos_histogram)
    print(neg_histogram)
    accumulated_neg = 0
    satisfied_pair = 0
    for i in range(n_bins):
        satisfied_pair += (pos_histogram[i] * accumulated_neg + pos_histogram[i] * neg_histogram[i] * 0.5)
        print(pos_histogram[i], neg_histogram[i], accumulated_neg, satisfied_pair)
        accumulated_neg += neg_histogram[i]

    return satisfied_pair / float(total_case)
print(cal_auc1(y_true, y_pred))
# 下面实现的是方法2
# https://blog.csdn.net/lieyingkub99/article/details/81266664?utm_medium=distribute.pc_relevant.none-task-blog-title-1&spm=1001.2101.3001.4242
def cal_auc2(y_true, y_pred):
    n_bins = 10
    postive_len = sum(y_true)  # M正样本个数
    negative_len = len(y_true) - postive_len  # N负样本个数
    total_case = postive_len * negative_len  # M * N样本对数
    prob_rank = [0 for _ in range(n_bins)]  # 保存每一个概率值的rank
    prob_num = [0 for _ in range(n_bins)]  # 保存每一个概率值出现的次数
    bin_width = 1.0 / n_bins
    raw_arr = []
    for i in range(len(y_true)):
        raw_arr.append([y_pred[i], y_true[i]])
    arr = sorted(raw_arr, key=lambda d: d[0]) # 按概率由低到高排序
    for i in range(len(arr)):
        nth_bin = int(arr[i][0] / bin_width)  # 概率值转化为整数下标
        prob_rank[nth_bin] = prob_rank[nth_bin] + i + 1
        prob_num[nth_bin] = prob_num[nth_bin] + 1
    satisfied_pair = 0
    for i in range(len(arr)):
        if arr[i][1] == 1:
            nth_bin = int(arr[i][0] / bin_width)  # 概率值转化为整数下标
            satisfied_pair = satisfied_pair + prob_rank[nth_bin] / prob_num[nth_bin]
    return (satisfied_pair - postive_len * (postive_len + 1) / 2 ) / total_case


print(cal_auc2(y_true, y_pred))

# 根据roc曲线,找不同点算下面积, 需要点足够多
def cal_auc3(y_true, y_pred):
    """Summary
    Args:
        raw_arr (TYPE): Description
    Returns:
        TYPE: Description
    """
    raw_arr = []
    for i in range(len(y_true)):
        raw_arr.append([y_pred[i], y_true[i]])
    print(raw_arr)
    arr = sorted(raw_arr, key=lambda d:d[0], reverse=True)
    pos, neg = 0., 0.
    for record in arr:
        if record[1] == 1.:
            pos += 1
        else:
            neg += 1

    fp, tp = 0., 0.
    xy_arr = []
    for record in arr:
        if record[1] == 1.:
            tp += 1
        else:
            fp += 1
        xy_arr.append([fp/neg, tp/pos])
    print(xy_arr)
    auc = 0.
    prev_x = 0.
    prev_y = 0.
    for x, y in xy_arr:
        if x != prev_x:
            auc += ((x - prev_x) * (y + prev_y) / 2.)
            prev_x = x
            prev_y = y
        print(auc)
    import numpy as np
    from sklearn.metrics import roc_auc_score
    y_true = [1, 1, 0, 0, 1, 1, 0]
    y_pred = [0.8, 0.7, 0.5, 0.5, 0.5, 0.5, 0.3]
    print(roc_auc_score(y_true, y_pred))
方法补充
下面是小编为大家找到的另外三个计算AUC的代码,会输出三种方法各自的auc,以及通过面积计算AUC时的ROC曲线。
在通过面积计算AUC的方法中,没有遍历数据的预测概率作为分类阈值,而是对[0,1]区间等分得到一系列阈值。
# AUC的计算
import numpy as np
import matplotlib.pyplot as plt

for e in range(3):
    print("\nRound: ", e+1)

    num = 1000
    auc1 = auc2 = auc3 = 0.

    # 准备数据
    pred_prob = list(np.random.uniform(low=0,high=1, size=[num]))
    labels = [int(prob>0.5) for prob in list(np.random.uniform(low=0,high=1, size=[num]))]

    # 检查数据
    # print("pred_prob:\n", pred_prob)
    # print("labels:\n", labels)

    # 方法一,面积加和
    roc_point = []
    for i in range(num):
        i = pred_prob[i]
        TP = 0  # 真阳样本数
        FP = 0  # 假阳样本数
        TP_rate = 0.  # 真阳率
        FP_rate = 0.  # 假阳率
        pos_num = 0   # 预测真样本数

        # 计数过程
        for ind, prob in enumerate(pred_prob):
            if prob>i:
                pos_num += 1
            if prob>i and labels[ind]>0.5:
                TP+=1
            elif prob>i and labels[ind]<0.5:
                FP+=1
        if pos_num!=0:
            TP_rate = TP / sum(labels)
            FP_rate = FP / (num-sum(labels))
        roc_point.append([FP_rate, TP_rate])  # 记录ROC中的点
    # 画出ROC曲线
    roc_point.sort(key=lambda x: x[0])
    plt.plot(np.array(roc_point)[1:, 0], np.array(roc_point)[1: ,1])
    plt.xlabel("FPR")
    plt.ylabel("TPR")
    plt.show()

    # 计算每个小长方形的面积,求和即为auc
    lastx = 0.
    for x,y in roc_point:
        auc1 += (x-lastx)*y  # 底乘高
        lastx = x

    print("方法一 auc:", auc1)

    # 方法二,利用AUC关于排列概率的定义计算
    auc2 = 0
    P_ind = []  # 正样本下标
    F_ind = []  # 负样本下标
    P_F = 0  # 正样本分数高于负样本的数量
    F_P = 0  # 负样本分数高于正样本的数量

    #  计数过程
    for ind, val in enumerate(labels):
        if val > 0.5:
            P_ind.append(ind)
        else:
            F_ind.append(ind)
    for Pi in P_ind:
        for Fi in F_ind:
            if pred_prob[Pi] > pred_prob[Fi]:
                P_F += 1
            else:
                F_P += 1
    auc2 = P_F/(len(P_ind)*len(F_ind))
    print("方法二 auc:", auc2)

    # 方法三,方法二的改进,简化了计算,降低了时间复杂度
    new_data = [[p, l] for p, l in zip(pred_prob, labels)]
    new_data.sort(key=lambda x:x[0])

    # 求正样本rank之和
    rank_sum = 0
    for ind, [prob,label] in enumerate(new_data):
        if label>0.5:
            rank_sum+=ind
    auc3 = (rank_sum - len(P_ind)*(1+len(P_ind))/2) / (len(P_ind)*len(F_ind))
    print("方法三 auc:", auc3)
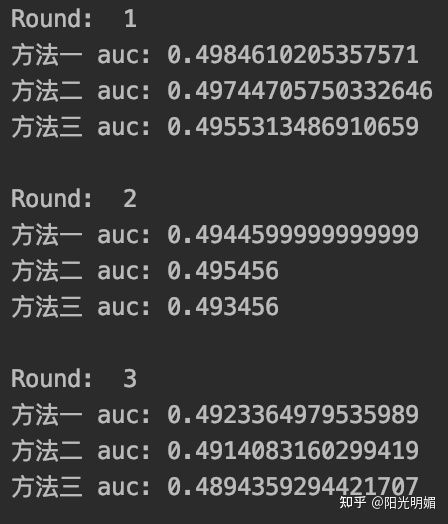
运行结果
到此这篇关于Python实现计算AUC的三种方式总结的文章就介绍到这了,更多相关Python计算AUC内容请搜索脚本之家以前的文章或继续浏览下面的相关文章希望大家以后多多支持脚本之家!

