【深度学习】从LeNet-5识别手写数字入门深度学习
活动地址:CSDN21天学习挑战赛
目录
- LeNet模型
- 搭建环境
-
- 安装需要的包
- 创建工程
- 数据集
- 相关代码
-
- 可以设置GPU训练(默认CPU)
- 通过TensorFlow下载数据集
- 对数据进行归一化处理
-
- 最值归一化(normalization)
- 均值方差归一化(standardization)
- 查看部分手写数字图片
- 将数据调整为可训练的格式
- CNN模型
-
- 模型源码
- 模型的各层参数
- 模型参数
- 设置compile
- 训练模型并保存
- 训练结果
LeNet模型
于1994年明确提出,变成推动深度学习培训发展趋势的驱动力。通过多次升级、不断,1988年Yann LeCun宣布取名为LeNet-5。LeNet-5模型如图所示。

搭建环境
这里我采用的是Pycharm + Anaconda(关于这俩的安装这里不在赘述)。
安装需要的包
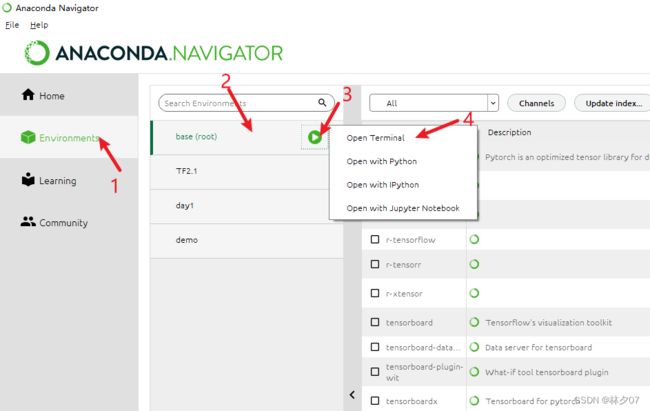
打开Anaconda软件。步骤:【environments】-》【base(root)】-》【点击三角形】-》【Open Terminal】。

创建一个虚拟环境TF2.1 输入指令:conda create -n TF2.1 python==3.7

切换工作环境

下面这个图告诉如何去下载对应的包


这里列出了所有需要安装的包以及版本号
| 包 | 版本号 |
|---|---|
| cudatoolkit | 10.1 |
| cudnn | 7.6 |
| tensorflow | 2.1 |
| matplotlib | 3.2.1 |
创建工程
数据集
MNIST数据集(Mixed National Institute of Standards and Technology database)是美国国家标准与技术研究院收集整理的大型手写数字数据库,包含60,000个示例的训练集以及10,000个示例的测试集。
下载地址:http://yann.lecun.com/exdb/mnist/ 需要解压使用
相关代码
可以设置GPU训练(默认CPU)
import: 导包与C++中的include一样。
as: 起别名
import tensorflow as tf
gpus = tf.config.list_physical_devices("GPU")

if gpus:
    gpu0 = gpus[0] #如果有多个GPU,仅使用第0个GPU
    tf.config.experimental.set_memory_growth(gpu0, True) #设置GPU显存用量按需使用
    tf.config.set_visible_devices([gpu0],"GPU")
通过TensorFlow下载数据集
import tensorflow as tf
from tensorflow.keras import datasets, layers, models
import matplotlib.pyplot as plt

(train_images, train_labels), (test_images, test_labels) = datasets.mnist.load_data()
对数据进行归一化处理
常见的归一化方式有最值归一化(normalization)和均值方差归一化(standardization)
最值归一化(normalization)
把所有数据映射到0~1之间;只适用于有明显边间的情况,比如像素点中的像素值(0-255)。公式如下面2所示:
x_scale= (x- x_min)/(x_max- x_min )
注:x为数据集中每一种特征的值;将数据集中的每一种特征都做映射;
均值方差归一化(standardization)
它的另一个叫法是标准化,不管你中间过程如何,但最终它都会把数据的均值和方差分别控制为0和1。如果我们应用的数据没有边界或边界不容易区分,或数据与数据间的差别非常大时,此方法就非常合适。比如人的工资有人可能好几百万但是有人可能只有几千。公式如下面所示:
x_scale= (x- x_mean)/x_scale
本文采用的是最值归一化。
# 将像素的值标准化至0到1的区间内。
train_images, test_images = train_images / 255.0, test_images / 255.0
查看部分手写数字图片
打印前二十张手写数字图片,显示四行五列。
plt.figure(figsize=(20,10))
for i in range(20):
    plt.subplot(4, 5, i+1)
    plt.xticks([])
    plt.yticks([])
    plt.grid(False)
    plt.imshow(train_images[i], cmap=plt.cm.binary)
    plt.xlabel(train_labels[i])
plt.show()
将数据调整为可训练的格式
#调整数据到我们需要的格式
train_images = train_images.reshape((60000, 28, 28, 1))
test_images = test_images.reshape((10000, 28, 28, 1))
CNN模型
模型源码
model = models.Sequential([
    layers.Conv2D(32, (3, 3), activation='relu', input_shape=(28, 28, 1)),#卷积层1,卷积核3*3
    layers.MaxPooling2D((2, 2)),                   #池化层1,2*2采样
    layers.Conv2D(64, (3, 3), activation='relu'),  #卷积层2,卷积核3*3
    layers.MaxPooling2D((2, 2)),                   #池化层2,2*2采样

    layers.Flatten(),                              #Flatten层,连接卷积层与全连接层
    layers.Dense(64, activation='relu'),		   #全连接层,特征进一步提取
    layers.Dense(10)                               #输出层,输出预期结果
])
# 打印网络结构
model.summary()
模型的各层参数
Model: “sequential”
| Layer (type) | Output Shape | Param # |
|---|---|---|
| conv2d (Conv2D) | (None, 26, 26, 32) | 320 |
| max_pooling2d (MaxPooling2D) | (None, 13, 13, 32) | 0 |
| conv2d_1 (Conv2D) | (None, 11, 11, 64) | 18496 |
| max_pooling2d_1 (MaxPooling2 ) | (None, 5, 5, 64) | 0 |
| flatten (Flatten) | (None, 1600) | 0 |
| dense (Dense) | (None, 64) | 102464 |
| dense_1 (Dense) | (None, 10) | 650 |
模型参数
Total params: 121,930
Trainable params: 121,930
Non-trainable params: 0
设置compile
model.compile(optimizer='adam',
              loss=tf.keras.losses.SparseCategoricalCrossentropy(from_logits=True),
              metrics=['accuracy'])
训练模型并保存
model.save("1.h5")
history = model.fit(train_images, train_labels, epochs=10,
                    validation_data=(test_images, test_labels))


