ClickHouse 实现有序漏斗分析与数据可视化
Clickhouse 实现漏斗分析与数据可视化
- 1、前言
- 2、环境准备
-
- 2.1、测试表
- 2.2、插入伪造的样例数据
-
- 2.2.1、插入伪造的登录数据
- 2.2.2、插入伪造的浏览数据
- 2.2.3、插入伪造的添加购物车数据
- 2.2.4、插入伪造的购买数据
- 3、漏斗分析实现代码
-
- 3.1、bitmap函数
- 3.2、windowFunnel函数
- 4、漏斗图的pyecharts实现
1、前言
究竟什么是漏斗分析?漏斗分析是一套流程式数据分析,它能够科学反映用户行为状态以及从起点到终点各阶段用户转化率情况的重要分析模型。
漏斗分析模型已经广泛应用于流量监控、产品目标转化等日常数据运营与数据分析的工作中。例如在一款购物app中,用户从登录app开始到付款,一般的用户购物路径为登录app、浏览商品、添加购物车、购买四个阶段,漏斗能够展现出各个阶段的转化率,通过漏斗各环节相关数据的比较,能够直观地发现和说明问题所在,从而找到优化方向。
今天顺手记录一下我关于漏斗分析的代码实现,才疏学浅,欢迎指教。
2、环境准备
2.1、测试表
在clickhouse中创建样例表:
CREATE TABLE ftabcch.behavior
(
    `uid` Int32,
    `event_type` String,
    `time` datetime
)
ENGINE = MergeTree()
PARTITION BY toYYYYMM(time)
ORDER BY uid
SETTINGS index_granularity = 8192
2.2、插入伪造的样例数据
为了方便展示,我在clickhouse上伪造一些用户从登录,到浏览,再到添加购物车,最后购买的数据。
2.2.1、插入伪造的登录数据
insert into ftabcch.behavior select tupleElement(b, 1) uid, tupleElement(b, 2) event_type,tupleElement(b, 3) time from (
with
(select groupArray(b) from (select * from generateRandom('b UInt16') limit 100000)) as uid,
(select groupArray('登录') from numbers(100000)) as event_type,
(select groupArray(a) from (select * from generateRandom('a Datetime64(0)') where a between toDateTime('2022-01-01') and toDateTime('2022-01-08') limit 100000)) as time
select arrayJoin(arrayZip(uid,event_type,time)) as b)
2.2.2、插入伪造的浏览数据
insert into ftabcch.behavior select tupleElement(b, 1) uid, tupleElement(b, 2) event_type,tupleElement(b, 3) time from (
with
(select groupArray(b) from (select * from generateRandom('b UInt16') limit 50000)) as uid,
(select groupArray('浏览') from numbers(50000)) as event_type,
(select groupArray(a) from (select * from generateRandom('a Datetime64(0)') where a between toDateTime('2022-01-09') and toDateTime('2022-01-16') limit 50000)) as time
select arrayJoin(arrayZip(uid,event_type,time)) as b)
2.2.3、插入伪造的添加购物车数据
insert into ftabcch.behavior select tupleElement(b, 1) uid, tupleElement(b, 2) event_type,tupleElement(b, 3) time from (
with
(select groupArray(b) from (select * from generateRandom('b UInt16') limit 30000)) as uid,
(select groupArray('添加购物车') from numbers(30000)) as event_type,
(select groupArray(a) from (select * from generateRandom('a Datetime64(0)') where a between toDateTime('2022-01-17') and toDateTime('2022-01-22') limit 30000)) as time
select arrayJoin(arrayZip(uid,event_type,time)) as b)
2.2.4、插入伪造的购买数据
insert into ftabcch.behavior select tupleElement(b, 1) uid, tupleElement(b, 2) event_type,tupleElement(b, 3) time from (
with
(select groupArray(b) from (select * from generateRandom('b UInt16') limit 20000)) as uid,
(select groupArray('购买') from numbers(20000)) as event_type,
(select groupArray(a) from (select * from generateRandom('a Datetime64(0)') where a between toDateTime('2022-01-23') and toDateTime('2022-01-31') limit 20000)) as time
select arrayJoin(arrayZip(uid,event_type,time)) as b)
3、漏斗分析实现代码
3.1、bitmap函数
with
(select groupBitmapState(uid) from behavior where event_type='登录' ) as login,
(select groupBitmapState(uid) from behavior where event_type='浏览') as browse,
(select groupBitmapState(uid) from behavior where event_type='添加购物车') as add_cart,
(select groupBitmapState(uid) from behavior where event_type='购买') as buy
select bitmapCardinality(login) as login_num,bitmapAndCardinality(login,browse) as browse_num,bitmapAndCardinality(bitmapAnd(login,browse),add_cart) as add_cart_num,
bitmapAndCardinality(bitmapAnd(bitmapAnd(login,browse),add_cart),buy) as buy_num
""")
bitmap函数的一些详细计算可以在这篇文章参考一下,有些函数附上了图解:
ClickHouse 集成Bitmap(2022-01-16更新)
也可以参考官网:
Bitmap Functions
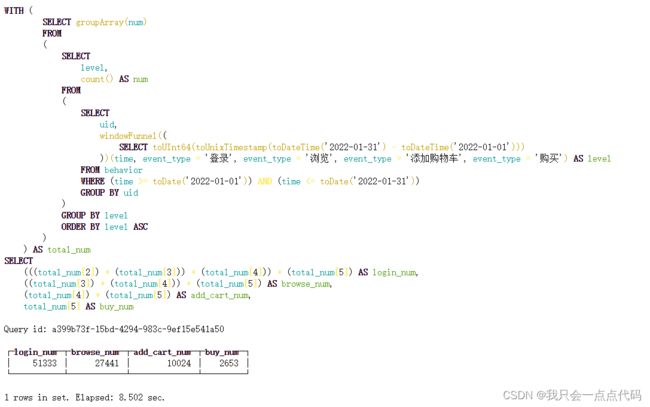
3.2、windowFunnel函数
with
(select groupArray(num) from (
    select level,count() as num from (select uid,windowFunnel((select toUInt64(toUnixTimestamp(toDateTime('2022-01-31')-toDateTime('2022-01-01')))))(time,event_type='登录',event_type='浏览',event_type='添加购物车',event_type='购买') as level from behavior
        where time between toDate('2022-01-01') and toDate('2022-01-31') group by uid)
            group by level order by level)) as total_num
select total_num[2]+total_num[3]+total_num[4]+total_num[5] as login_num,total_num[3]+total_num[4]+total_num[5] as browse_num,total_num[4]+total_num[5] as add_cart_num,total_num[5] as buy_num
关于这个windowFunnel函数,官网有着例子: windowFunnel(window, [mode, [mode, … ]])(timestamp, cond1, cond2, …, condN)
在这里:
- window — 滑动窗户的大小,表示事件链中第一个事件和最后一个事件的最大间隔。 单位取决于timestamp。用表达式来表示则是:timestamp of cond1 <= timestamp of cond2 <= … <= timestamp of condN <= timestamp of cond1 + window。
- mode - 这是一个可选的参数,可以设置一个或多个参数。
‘strict_deduplication’ - 如果事件链中出现相同的条件,则会停止进一步搜索。
‘strict_order’ - 不允许其他事件的介入。 例如:在A->B->D->C的情况下,它在D停止继续搜索A->B->C,最大事件数为2。
‘strict_increase’ - 事件链中的时间戳必须严格上升。 - timestamp — 包含时间戳的列。 数据类型支持: 日期, 日期时间 和其他无符号整数类型(请注意,即使时间戳支持 UInt64 类型,它的值也不能超过Int64最大值,即2^63-1)。
- cond — 事件链的约束条件。 UInt8 类型。
简单来说,这个函数的作用就是计算出用户在cond中的等级。在本代码中,登录的用户为1,而浏览
的用户为2,添加商品的用户为3,而购买的用户为4,所有不满足以上行为的为0。而这个函数就可以计算出所有用户所处的等级。
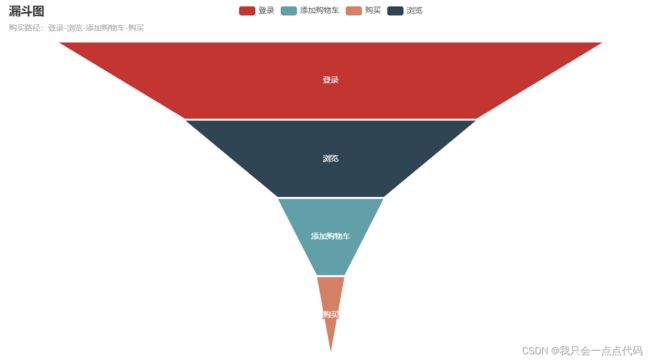
4、漏斗图的pyecharts实现
import pyecharts.options as opts
from pyecharts.charts import Funnel
from pyecharts.globals import CurrentConfig,NotebookType
CurrentConfig.NOTEBOOK_TYPE = NotebookType.JUPYTER_NOTEBOOK

x_data = ["登录", "浏览", "添加购物车", "购买"]
y_data = [51333, 27441, 10024, 2653]

data = [[x_data[i], y_data[i]] for i in range(len(x_data))]

funnel_photo = Funnel(init_opts=opts.InitOpts(width="1000px", height="600px"))
funnel_photo.add(
        series_name="",
        data_pair=data,
        gap=2,
        tooltip_opts=opts.TooltipOpts(trigger="item", formatter="{a}
{b} : {c}"),
        label_opts=opts.LabelOpts(is_show=True, position="inside"),
        itemstyle_opts=opts.ItemStyleOpts(border_color="#fff", border_width=1),
    )
funnel_photo.set_global_opts(title_opts=opts.TitleOpts(title="漏斗图", subtitle="购买路径:登录-浏览-添加购物车-购买"))
funnel_photo.render_notebook()


