matlab小波变换、离散小波变换函数使用
matlab中,连续小波变换、离散小波变换函数使用比较复杂,最近做了个总结。
参考连接
参考1:https://www.jianshu.com/p/56733f6c0a10
参考2:小波变换工具箱(7页)-原创力文档
参考3:《Matlab信号处理》 沈再阳,清华大学出版社,第8章
注意:以下所有函数均为matlab 2020a环境中测试,更早的版本未做测试。
一、连续小波变换
1.1 正变换cwt
1.1.1 语法
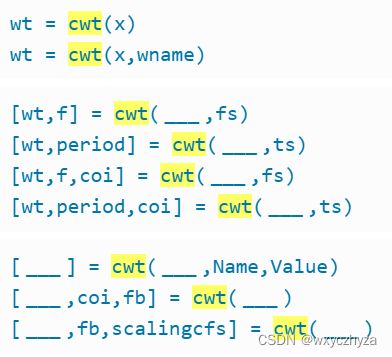
语法如下,详细用法可通过命令【doc cwt】详细了解,一般使用时只需用其中两个参数即可:
①wname:小波基的名称:分别对应为:
| wname的值 | 小波基 |
| morse | Morse |
| amor | Morlet(Gabor) |
| bump | Bump |
②fs:x的抽样频率。当给定fs时,画出的时频图的XY轴分别为实际的时间和频率;不指定时,画出的时归一化频率和采样点。
1.1.2 示例
cwt函数 用法比较简单,可以举个简单例子如下:其中锥形虚线为影响锥,影响锥范围内的值可信度较高:
clc; clear; close all;

load sumsin;
x = sumsin(1:500);
x = x + randn(1, length(x));
Fs = 10;
figure;     cwt(x, 'amor');     % 不指定Fs
figure;     cwt(x, 'amor', Fs);     % 指定Fs
1.2 反变换icwt
1.2 .1 语法
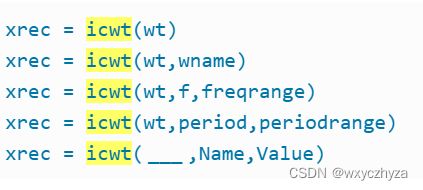
用法基本同正变换,其中参数说明如下:
wt:正变换得到的矩阵;
xrec:反变换重构的信号。注意重构的信号和原信号还是有区别的。
1.2.2 示例
clc; clear; close all;

load sumsin;
x = sumsin(1:500);
x = x + randn(1, length(x));
Fs = 10;
[wt, f] = cwt(x, 'amor', Fs);     % 指定Fs
xrec1 = icwt(wt, 'amor');       % 反变换,指定小波基
xrec2 = icwt(wt, f, [0.06, 0.31]);       % 反变换,指定频率范围可实现滤波效果。

subplot(311);   plot(x);        title('x');
subplot(312);   plot(xrec1);    title('全频率小波逆变换')
subplot(313);   plot(xrec2);    title('针对部分频率范围进行小波逆变换')
二、离散小波变换
2.1 函数总结
2.1.1 函数列表
2.1.2 小波分解图
2.1.2.1 小波分解的算法步骤
2.1.2.2 小波重构的算法步骤
其实就是上采样后分别通过低通、高通滤波器。
2.2 小波基总结
使用离散小波变换时,经常会设置错小波基函数。因为离散小波变换的小波基参数wname的格式应给为【wavelet_name】+[number]。具体总结如下:
| wname的值 | 小波基名称 | N取值 |
| morl | Morlet小波 | - |
| mexh | 墨西哥草帽小波 | - |
| meyr | Meyer小波 | - |
| haar | Haar小波 | - |
| dbN | 紧支集正交小波 | 1,2,3,... |
| symN | 近似对称的紧支集正交小波 | 通常取2~8 |
| coifN | Coiflet小波 | 1~5 |
| biorNr,Nd | 双正交样条小波。r-重构;d-分解 | 1~6 |
2.3 示例
2.3.1 dwt、idwt
clear all;
load sumsin;
x = sumsin(1:500);
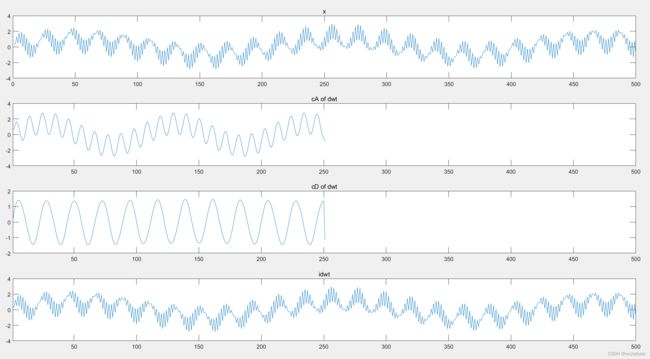
[cA, cD] = dwt(x, 'db2');
x_idwt = idwt(cA, cD, 'db2');

subplot(411);   plot(x);    title('x');
subplot(412);   plot(cA);   title('cA of dwt'); xlim([1, length(x)]);
subplot(413);   plot(cD);   title('cD of dwt'); xlim([1, length(x)]);
subplot(414);   plot(x_idwt);   title('idwt'); xlim([1, length(x)]);
2.3.2 wavedec、waverec、wrcoef
clear;

load sumsin;
x = sumsin(1:500);
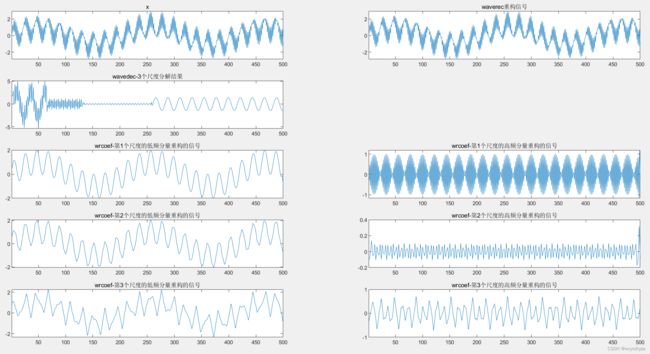
[c, l] = wavedec(x, 3, 'db3');
subplot(521);	plot(x);    title('x');   xlim([1, length(x)]);

xx = waverec(c,l,'db3');
subplot(522);	plot(x);    title('waverec重构信号');   xlim([1, length(x)]);

subplot(523);   plot(c);    title('wavedec-3个尺度分解结果');   xlim([1, length(x)]);

for i=1:3
    a1 = wrcoef('a', c, l, 'db3', i);      % a-低频重构,d-高频重构
    subplot(5,2, 2*i + 3);   plot(a1);
    title(['wrcoef-从第', num2str(i),'个尺度的低频分量重构到0级']);   xlim([1, length(x)]);
end

for i=1:3
    a1 = wrcoef('d', c, l, 'db3', i);      % a-低频重构,d-高频重构
    subplot(5,2, 2*i + 4);   plot(a1);
    title(['wrcoef-从第', num2str(i),'个尺度的高频分量重构到0级']);   xlim([1, length(x)]);
end
2.2.3 upwlev、upcoef


