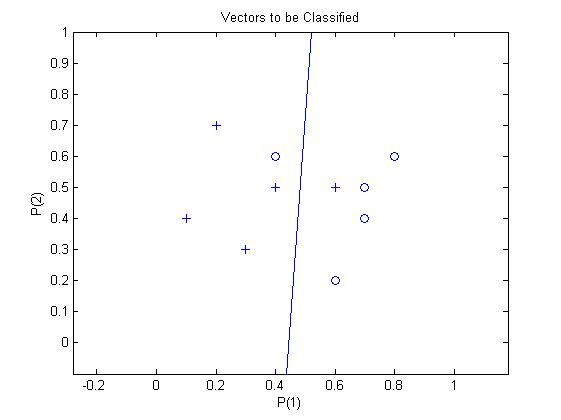
MATLAB R2007a plotpv函数存在一个BUG,Classify using the least-squares algorithm
MATLAB R2007a plotpv函数存在一个BUG,导致做模式分类绘制决策线的时候出现错误
以 Classify using the least-squares algorithm 为例介绍修正后的实例
1
function
plotpv(p,t,v)
2 % PLOTPV Plot perceptron input / target vectors.
3 %
4 % Syntax
5 %
6 % plotpv(p,t)
7 % plotpv(p,t,v)
8 %
9 % Description
10 %
11 % PLOTPV(P,T) take these inputs,
12 % P - RxQ matrix of input vectors (R must be 3 or less).
13 % T - SxQ matrix of binary target vectors (S must be 3 or less).
14 % and plots column vectors in P with markers based on T.
15 %
16 % PLOTPV(P,T,V) takes an additional input,
17 % V - Graph limits = [x_min x_max y_min y_max]
18 % and plots the column vectors with limits set by V.
19 %
20 % Example
21 %
22 % The code below defines and plots the inputs and targets
23 % for a perceptron:
24 %
25 % p = [ 0 0 1 1 ; 0 1 0 1 ];
26 % t = [ 0 0 0 1 ];
27 % plotpv(p,t)
28 %
29 % The following code creates a perceptron with inputs ranging
30 % over the values in P, assigns values to its weights
31 % and biases, and plots the resulting classification line.
32 %
33 % net = newp(minmax(p), 1 );
34 % net.iw{ 1 , 1 } = [ - 1.2 - 0.5 ];
35 % net.b{ 1 } = 1 ;
36 % plotpc(net.iw{ 1 , 1 },net.b{ 1 })
37 %
38 % See also PLOTPC.
39
40 % Mark Beale, 1 - 31 - 92
41 % Revised 12 - 15 - 93 , MB
42 % Copyright 1992 - 2005 The MathWorks, Inc.
43 % $Revision : 1.1 . 6.2 $ $Date : 2005 / 12 / 22 18 : 20 : 31 $
44
45 % ERROR CHECKING
46 % ==============
47
48 if nargin < 2 , error('Not enough arguments.'), end
49
50 [pr,pc] = size(p);
51 [tr,tc] = size(t);
52
53 if (pr > 3 ), error('P must 1 , 2 , or 3 rows.'), end
54 if tr > 3 , error('T must have 1 , 2 , or 3 rows.'), end
55
56 % DEFAULTS
57 % ========
58
59 if max(pr,tr) < = 2
60 plotdim = 2 ;
61 else
62 plotdim = 3 ;
63 end
64
65 p = [p; zeros( 3 - pr,pc)];
66 t = [t; zeros( 3 - tr,tc)];
67
68 if nargin == 2
69 minx = min(p( 1 ,:));
70 maxx = max(p( 1 ,:));
71 miny = min(p( 2 ,:));
72 maxy = max(p( 2 ,:));
73 edgx = (maxx - minx) * 0.4 + 0.1 ;
74 edgy = (maxy - miny) * 0.4 + 0.1 ;
75 minz = min(p( 3 ,:));
76 maxz = max(p( 3 ,:));
77 edgz = (maxz - minz) * 0.4 ;
78 if plotdim == 2
79 v = [minx - edgx maxx + edgx miny - edgy maxy + edgy];
80 else
81 v = [minx - edgx maxx + edgx miny - edgy maxy + edgy minz - edgz maxz + edgz];
82 end
83 end
84
85 % MARKERS
86 % =======
87
88 marker = ['ob';'or';' * b';' * r';' + b';' + r';'xb';'xr'];
89
90 % PLOTTING
91 % ========
92
93 for i = 1 :pc
94 x = [ 4 2 1 ] * t(:,i) + 1 ;
95 if (x< 1 )
96 x = 1 ;
97 end
98
99 if (x > size(marker, 1 ))
100 x = size(marker, 1 );
101 end
102
103 m = marker(x,:);
104 plot3(p( 1 ,i),p( 2 ,i),p( 3 ,i),m)
105 hold on
106 end
107
108 % PLOT SET UP
109 % ===========
110
111 set(gca,'box','on')
112 title('Vectors to be Classified')
113 xlabel('P( 1 )');
114 ylabel('P( 2 )');
115
116 if plotdim < = 2
117 view( 2 )
118 else
119 view( 3 )
120 zlabel('P( 3 )')
121 end
122 axis(v)
123 hold off
124
125

1
%
function
[test_targets, w]
=
LS(train_patterns, train_targets, test_patterns, weights)
2
3 train_patterns = [ 0.2 0.3 0.4 0.6 0.1 0.4 0.6 0.7 0.8 0.7 ;
4 0.7 0.3 0.5 0.5 0.4 0.6 0.2 0.4 0.6 0.5 ]
5 % train_targets = [ 0 0 0 0 0 1 1 1 1 1 ]
6 train_targets = [ 1 1 1 1 1 - 1 - 1 - 1 - 1 - 1 ]
7 test_patterns = [ 0.7 0.7 ]'
8 weights = []; % [ 0.1 0.1 0.1 0.1 0.1 0.1 0.1 0.1 0.1 0.1 ]
9 [test_targets, a] = LS(train_patterns, train_targets, test_patterns, weights)
10
11 plotpv2(train_patterns,train_targets); % 绘点,绘制分类模式
12 plotpc(a( 1 : end - 1 ),a( end : end )); % 绘分割线;绘制决策面
13
14
15