RNA 27 SCI文章中转录因子结合motif富集到调控网络 (RcisTarget)
点击关注,桓峰基因
桓峰基因公众号推出转录组分析和临床预测模型教程,有需要生信的老师可以联系我们!首选看下转录分析教程整理如下:
RNA 1. 基因表达那些事–基于 GEO
RNA 2. SCI文章中基于GEO的差异表达基因之 limma
RNA 3. SCI 文章中基于T CGA 差异表达基因之 DESeq2
RNA 4. SCI 文章中基于TCGA 差异表达之 edgeR
RNA 5. SCI 文章中差异基因表达之 MA 图
RNA 6. 差异基因表达之-- 火山图 (volcano)
RNA 7. SCI 文章中的基因表达——主成分分析 (PCA)
RNA 8. SCI文章中差异基因表达–热图 (heatmap)
RNA 9. SCI 文章中基因表达之 GO 注释
RNA 10. SCI 文章中基因表达富集之–KEGG
RNA 11. SCI 文章中基因表达富集之 GSEA
RNA 12. SCI 文章中肿瘤免疫浸润计算方法之 CIBERSORT
RNA 13. SCI 文章中差异表达基因之 WGCNA
RNA 14. SCI 文章中差异表达基因之 蛋白互作网络 (PPI)
RNA 15. SCI 文章中的融合基因之 FusionGDB2
RNA 16. SCI 文章中的融合基因之可视化
RNA 17. SCI 文章中的筛选 Hub 基因 (Hub genes)
RNA 18. SCI 文章中基因集变异分析 GSVA
RNA 19. SCI 文章中无监督聚类法 (ConsensusClusterPlus)
RNA 20. SCI 文章中单样本免疫浸润分析 (ssGSEA)
RNA 21. SCI 文章中单基因富集分析
RNA 22. SCI 文章中基于表达估计恶性肿瘤组织的基质细胞和免疫细胞
RNA 23. SCI文章中表达基因模型的风险因子关联图(ggrisk)
RNA 24. SCI文章中基于TCGA的免疫浸润细胞分析 (TIMER)
RNA 25. SCI文章中估计组织浸润免疫细胞和基质细胞群的群体丰度(MCP-counter)
RNA 26. SCI文章中基于转录组数据的基因调控网络推断 (GENIE3)
RNA 27 SCI文章中转录因子结合motif富集到调控网络 (RcisTarget)
临床预测模型整理如下:
Topic 1. 临床标志物生信分析常规思路
Topic 2. 生存分析之 Kaplan-Meier
Topic 3. SCI文章第一张表格–基线表格
Topic 4. 临床预测模型构建 Logistic 回归
Topic 5. 样本量确定及分割
Topic 6 计数变量泊松回归
Topic 7. 临床预测模型–Cox回归
Topic 8. 临床预测模型-Lasso回归
Topic 9. SCI 文章第二张表—单因素回归分析表
Topic 10. 单因素 Logistic 回归分析—单因素分析表格
Topic 11. SCI中多元变量筛选—单/多因素表
Topic 12 临床预测模型—列线表 (Nomogram)
Topic 13. 临床预测模型—一致性指数 (C-index)
Topic 14. 临床预测模型之校准曲线 (Calibration curve)
Topic 15. 临床预测模型之决策曲线 (DCA)
Topic 16. 临床预测模型之接收者操作特征曲线 (ROC)
Topic 17. 临床预测模型之缺失值识别及可视化
Topic 18. 临床预测模型之缺失值插补方法
本期教程展示了如何使用 RcisTarget 获取基因列表上富集的转录因子结合 motif?
前言
RcisTarget是用于识别在基因表中过度表现的转录因子(TF)结合 motif。
软件安装
RcisTarget基于之前在i-cisTarget (web界面,基于区域)和iRegulon (Cytoscape插件,基于基因)中实现的方法。软件包安装如下:
if (!require("BiocManager", quietly = TRUE))
  install.packages("BiocManager")

BiocManager::install("RcisTarget")
数据库下载
每对基因基序的得分可以用不同的参数来进行。因此,我们提供多个数据库(motif-rankings),根据以下几种可能性:
Species: Species of the input gene set. Available values: Human (Homo sapiens), mouse (Mus musculus) or fly (Drosophila melanogaster) Scoring/search space: determine the search space around the transcription start site (TSS). Available values: 500 bp uptream the TSS, 5kbp or 10kbp around the TSS (e.g. 10kbp upstream and 10kbp downstream of the TSS). Number of orthologous species taken into account to score the motifs (e.g. conservation of regions). Available values: 7 or 10 species
具体的数据库在:
https://resources.aertslab.org/cistarget/
我们这里选择 human 可以直接找到下载链接下载,也可以通过以下方式下载:
featherURL <- "https://resources.aertslab.org/cistarget/databases/homo_sapiens/hg19/refseq_r45/mc9nr/gene_based/hg19-tss-centered-10kb-7species.mc9nr.feather"
download.file(featherURL, destfile=basename(featherURL)) # saved in current dir
数据库读取
我们读取数据,因为数据挺大的,我这小电脑承受不起,后续没有利用这个下载的数据库,而是例子中的截取的来分析的。
library(RcisTarget)

# Load gene sets to analyze. e.g.:
geneList1 <- read.table(file.path(system.file('examples', package='RcisTarget'), "hypoxiaGeneSet.txt"), stringsAsFactors=FALSE)[,1]
geneLists <- list(geneListName=geneList1)
# geneLists <- GSEABase::GeneSet(genes, setName="geneListName") # alternative

# Select motif database to use (i.e. organism and distance around TSS)
data(motifAnnotations_hgnc)
motifRankings <- importRankings("~/databases/hg19-tss-centered-10kb-7species.mc9nr.feather")

# Motif enrichment analysis:
motifEnrichmentTable_wGenes <- cisTarget(geneLists, motifRankings,
                               motifAnnot=motifAnnotations_hgnc)
数据库实例(子集)
除了数据库的完整版本(20k motif)之外,软件包还提供了一个子集,其中只包含来自cisbp的4.6k motif(仅针对人类:rcistarget .hg19. motifdbs . cisbponly500bp)。这些子集在Bioconductor中可用于演示目的。将为现有的图案提供相同的AUC分数。然而,当然在实际分析数据时强烈建议使用完整版本(~20k motifs)以获得更准确的结果,因为motif的归一化富集评分(NES)取决于数据库中motif的总数。
library(RcisTarget)
library(RcisTarget.hg19.motifDBs.cisbpOnly.500bp)
# Select motif database to use (i.e. organism and distance around TSS)
data(hg19_500bpUpstream_motifRanking_cispbOnly)
motifRankings <- hg19_500bpUpstream_motifRanking_cispbOnly

motifRankings
## Rankings for RcisTarget.
##   Organism: human (hg19)
##   Number of genes: 22284 (22285 available in the full DB)
##   Number of MOTIF: 4687
## ** This database includes rankings up to 5050
##
## Subset (4.6k cisbp motifs) of the Human database scoring motifs 500bp upstream the TSS (hg19-500bp-upstream-7species.mc9nr)
数据读取
函数cisTarget()允许在基因列表上执行基序富集分析。主要的输入参数是基因列表和基序数据库,应根据生物和基因TSS周围的搜索空间选择。
### Load your gene sets As example, the package includes an Hypoxia gene set:
txtFile <- paste(file.path(system.file("examples", package = "RcisTarget")), "hypoxiaGeneSet.txt",
sep = "/")
geneLists <- list(hypoxia = read.table(txtFile, stringsAsFactors = FALSE)[, 1])
### Load databases Motif rankings: Select according to organism and distance
### around TSS (See the vignette for URLs to download) motifRankings <-
### importRankings('./cisTarget_databases/hg19-tss-centered-10kb-7species.mc9nr.feather')
# Motif - TF annotation:
data(motifAnnotations_hgnc) # human TFs (for motif collection 9)
motifAnnotation <- motifAnnotations_hgnc
motifAnnotation
## motif TF directAnnotation inferred_Orthology
## 1: bergman__Abd-B HOXA9 FALSE TRUE
## 2: bergman__Aef1 ZNF8 FALSE TRUE
## 3: bergman__Cf2 ZNF853 FALSE TRUE
## 4: bergman__EcR_usp NR1H2 FALSE TRUE
## 5: bergman__EcR_usp NR1H3 FALSE TRUE
## ---
## 163188: yetfasco__YPR104C_2203 FOXN4 FALSE TRUE
## 163189: yetfasco__YPR104C_2203 FOXR1 FALSE TRUE
## 163190: yetfasco__YPR104C_2203 FOXR2 FALSE TRUE
## 163191: yetfasco__YPR186C_1321 ZNF366 FALSE TRUE
## 163192: yetfasco__YPR186C_1321 ZNF710 FALSE TRUE
## inferred_MotifSimil annotationSource
## 1: TRUE inferredBy_MotifSimilarity_n_Orthology
## 2: FALSE inferredBy_Orthology
## 3: FALSE inferredBy_Orthology
## 4: FALSE inferredBy_Orthology
## 5: FALSE inferredBy_Orthology
## ---
## 163188: FALSE inferredBy_Orthology
## 163189: FALSE inferredBy_Orthology
## 163190: FALSE inferredBy_Orthology
## 163191: FALSE inferredBy_Orthology
## 163192: FALSE inferredBy_Orthology
## description
## 1: gene is orthologous to ENSMUSG00000038227 in M. musculus (identity = 98%) which is annotated for similar motif cisbp__M1008 ('HOXA6[gene ID: "ENSG00000106006" species: "Homo sapiens" TF status: "inferred" TF family: "Homeodomain" DBDs: "Homeobox"]; HOXB9[gene ID: "ENSG00000170689" species: "Homo sapiens" TF status: "inferred" TF family: "Homeodomain" DBDs: "Homeobox"]; HOXC9[gene ID: "ENSG00000180806" species: "Homo sapiens" TF status: "inferred" TF family: "Homeodomain" DBDs: "Homeobox"]; Hoxa9[gene ID: "ENSMUSG00000038227" species: "Mus musculus" TF status: "direct" TF family: "Homeodomain" DBDs: "Homeobox"]; Hoxb9[gene ID: "ENSMUSG00000020875" species: "Mus musculus" TF status: "inferred" TF family: "Homeodomain" DBDs: "Homeobox"]; NP_032296.2[gene ID: "NP_032296.2" species: "Mus musculus" TF status: "inferred" TF family: "Homeodomain" DBDs: "Homeobox"]'; q-value = 0.0006)
## 2: motif is annotated for orthologous gene FBgn0005694 in D. melanogaster (identity = 21%)
## 3: motif is annotated for orthologous gene FBgn0000286 in D. melanogaster (identity = 15%)
## 4: gene is orthologous to FBgn0000546 in D. melanogaster (identity = 37%) which is directly annotated for motif
## 5: gene is orthologous to FBgn0000546 in D. melanogaster (identity = 40%) which is directly annotated for motif
## ---
## 163188: gene is orthologous to YPR104C in S. cerevisiae (identity = 20%) which is directly annotated for motif
## 163189: gene is orthologous to YPR104C in S. cerevisiae (identity = 20%) which is directly annotated for motif
## 163190: gene is orthologous to YPR104C in S. cerevisiae (identity = 20%) which is directly annotated for motif
## 163191: motif is annotated for orthologous gene YPR186C in S. cerevisiae (identity = 25%)
## 163192: motif is annotated for orthologous gene YPR186C in S. cerevisiae (identity = 24%)
实例操作
一旦加载了基因列表和数据库,就可以由 cisTarget() 按顺序运行三个步骤:
(1)motif富集分析;
(2)motif-TF注释;
(3)重要基因的选择。
也可以将这些步骤作为单独的命令运行。例如,对于用户对某个输出感兴趣的分析,可以跳过步骤,或者优化工作流以在多个基因列表上运行。
motifEnrichmentTable_wGenes <- cisTarget(geneLists, motifRankings, nesThreshold = 3.5,
    geneErnMethod = "aprox", nCores = 2)
## [1] 5050
计算富集程度
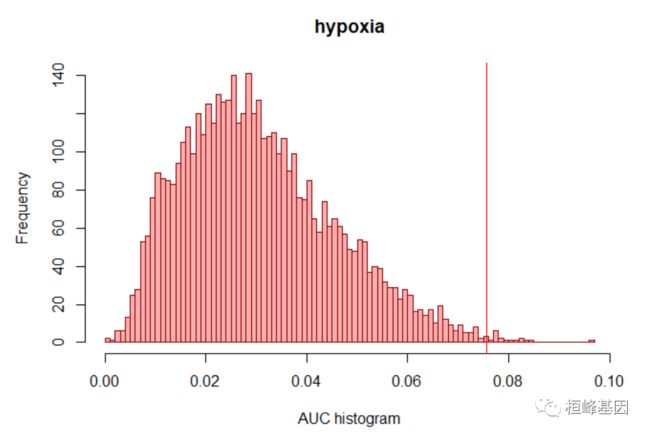
估计基因集上每个基序的过度表示的第一步是计算每对基序-基因集的曲线下面积(AUC)。这是根据基序排序的基因集曲线计算的(基因的排序根据基序在其邻近性中的得分递减,如motifRanking数据库所提供的)。AUC是由基因集提供的基序矩阵。原则上,AUC主要是作为下一步的输入。然而,也有可能探索分数的分布,例如在感兴趣的基因集中:
motifs_AUC <- calcAUC(geneLists, motifRankings, nCores = 1)
auc <- getAUC(motifs_AUC)["hypoxia", ]
hist(auc, main = "hypoxia", xlab = "AUC histogram", breaks = 100, col = "#ff000050",
    border = "darkred")
nes3 <- (3 * sd(auc)) + mean(auc)
abline(v = nes3, col = "red")
选择重要的motif和/或注释到TF
重要motif的选择是基于标准化富集评分(NES)。根据基因集所有基序的AUC分布[(x-mean)/sd]计算每个基序的网元。通过给定阈值(默认为3.0)的 motif 被认为是重要的。
此外,这一步还允许添加注释到 motif 的TF。
motifEnrichmentTable <- addMotifAnnotation(motifs_AUC, nesThreshold = 3, motifAnnot = motifAnnotations_hgnc,
    highlightTFs = list(hypoxia = "HIF1A"))
class(motifEnrichmentTable)
## [1] "data.table" "data.frame"
dim(motifEnrichmentTable)
## [1] 17  8
head(motifEnrichmentTable[, -"TF_lowConf", with = FALSE])
##    geneSet        motif  NES    AUC highlightedTFs TFinDB
## 1: hypoxia cisbp__M6275 4.41 0.0966          HIF1A     **
## 2: hypoxia cisbp__M0062 3.57 0.0841          HIF1A
## 3: hypoxia cisbp__M6279 3.56 0.0840          HIF1A
## 4: hypoxia cisbp__M6212 3.49 0.0829          HIF1A
## 5: hypoxia cisbp__M2332 3.48 0.0828          HIF1A
## 6: hypoxia cisbp__M0387 3.41 0.0817          HIF1A
##                   TF_highConf
## 1: HIF1A (directAnnotation).
## 2:
## 3: HMGA1 (directAnnotation).
## 4: EPAS1 (directAnnotation).
## 5:
## 6:
找出每个Motif的最优富集基因
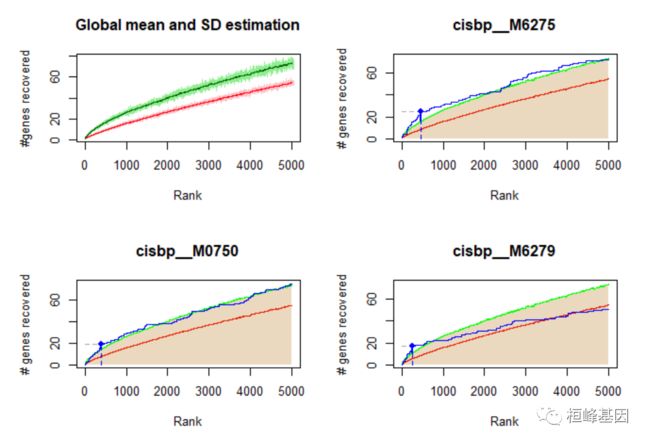
由于RcisTarget搜索的是基因列表中一个motif的富集,所以找到一个motif“富集”并不意味着基因列表中的所有基因都对该motif有很高的评价。这样,工作流程的第三步是确定(基因集中的)哪些基因对每个重要基序的排序较高。
有两种方法可以识别这些基因:
(1)等同于iRegulon和i-cisTarget中使用的方法(method=“iCisTarget”,如果运行时间不存在问题,建议使用);
(2)基于使用每个秩的平均值的近似分布的更快实现(method=“aprox”,用于扫描多个基因集)。
重要提示:确保motifRankings 是相同的步骤1。
motifEnrichmentTable_wGenes <- addSignificantGenes(motifEnrichmentTable, rankings = motifRankings,
    geneSets = geneLists)
## [1] 5050
dim(motifEnrichmentTable_wGenes)
## [1] 17 11
geneSetName <- "hypoxia"
selectedMotifs <- c("cisbp__M6275", sample(motifEnrichmentTable$motif, 2))
par(mfrow = c(2, 2))
getSignificantGenes(geneLists[[geneSetName]], motifRankings, signifRankingNames = selectedMotifs,
    plotCurve = TRUE, maxRank = 5000, genesFormat = "none", method = "aprox")
## [1] 5050
结果输出
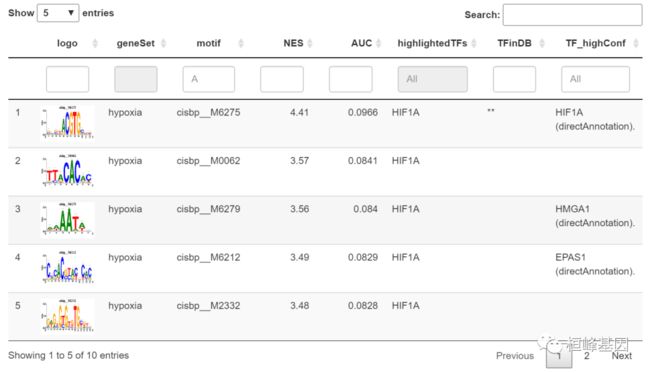
RcisTarget的最终输出的data.table包含有关motif 富集的以下信息:
geneSet:基因集的名称
motif:motif的ID
NES:基因集中基序的标准化富集得分
AUC:曲线下的面积(用于计算NES)
TFinDB:指示突出显示的TF是包含在高置信度注释(两个星号)还是低置信度注释(一个星号)中;
TF_highConf:根据’motifAnnot_highConfCat’注释到基序的转录因子;
TF_lowConf:根据’motifAnnot_lowConfCat’注释到主题的转录因子;
erichedGenes:在给定motif上排名较高的基因;
nErnGenes:高度排名的基因数量;
rankAtMax:在最大富集时的排名,用于确定富集的基因数。
motifEnrichmentTable_wGenes_wLogo <- addLogo(motifEnrichmentTable)

resultsSubset <- motifEnrichmentTable_wGenes_wLogo[1:10,]

library(DT)
datatable(resultsSubset[,-c("enrichedGenes", "TF_lowConf"), with=FALSE],
          escape = FALSE, # To show the logo
          filter="top", options=list(pageLength=5))
TF注释到已经富集的motif
注意,TF是基于motif注释提供可以作为选择相关基序或对某些转录因子进行优先级排序的指标,但基序注释并不意味着表中出现的所有转录因子都调节着基因列表。
anotatedTfs <- lapply(split(motifEnrichmentTable_wGenes$TF_highConf, motifEnrichmentTable$geneSet),
    function(x) {
        genes <- gsub(" \\(.*\\). ", "; ", x, fixed = FALSE)
        genesSplit <- unique(unlist(strsplit(genes, "; ")))
        return(genesSplit)
    })

anotatedTfs$hypoxia
## [1] "HIF1A" "HMGA1" "EPAS1" "HES6"  "FOXP1" "FOXP2" "FOXP3" "FOXP4" "FOXG1"
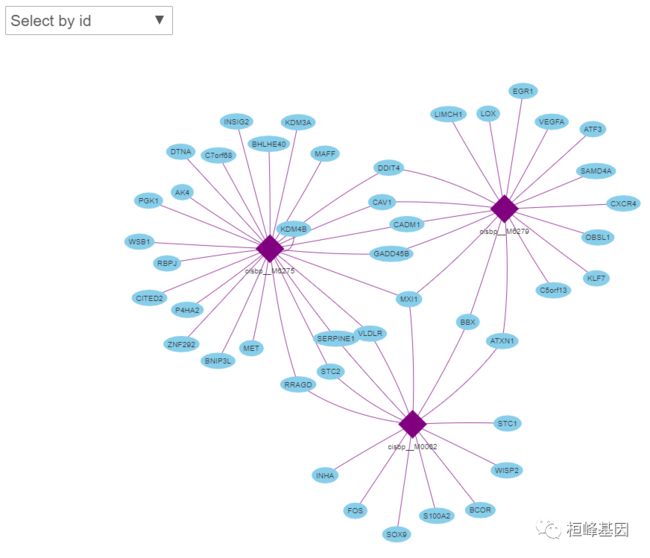
构建网络图
signifMotifNames <- motifEnrichmentTable$motif[1:3]

incidenceMatrix <- getSignificantGenes(geneLists$hypoxia, motifRankings, signifRankingNames = signifMotifNames,
    plotCurve = TRUE, maxRank = 5000, genesFormat = "incidMatrix", method = "aprox")$incidMatrix
## [1] 5050


library(reshape2)
edges <- melt(incidenceMatrix)
edges <- edges[which(edges[, 3] == 1), 1:2]
colnames(edges) <- c("from", "to")
igraph
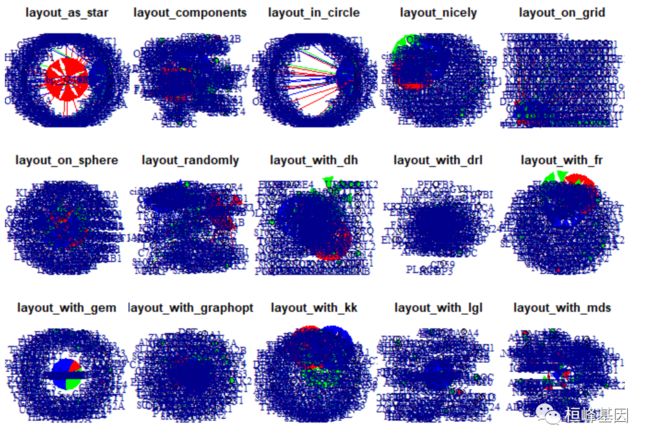
画出各种布局的 调控网络
library(igraph)
载入程辑包:‘igraph’
## The following objects are masked from 'package:stats':
##
##     decompose, spectrum


## The following object is masked from 'package:base':
##
##     union


mugh<- graph_from_incidence_matrix(incidenceMatrix, directed = F)
mugh


## IGRAPH c8e0192 UN-B 174 56 --
## + attr: type (v/l), name (v/c)
## + edges from c8e0192 (vertex names):
##  [1] cisbp__M6275--AK4      cisbp__M6275--BHLHE40  cisbp__M6275--BNIP3L
##  [4] cisbp__M6275--C7orf68  cisbp__M6275--CADM1    cisbp__M6275--CAV1
##  [7] cisbp__M6275--CITED2   cisbp__M6275--DDIT4    cisbp__M6275--DTNA
## [10] cisbp__M6275--GADD45B  cisbp__M6275--INSIG2   cisbp__M6275--KDM3A
## [13] cisbp__M6275--KDM4B    cisbp__M6275--MAFF     cisbp__M6275--MET
## [16] cisbp__M6275--MXI1     cisbp__M6275--P4HA2    cisbp__M6275--PGK1
## [19] cisbp__M6275--RBPJ     cisbp__M6275--RRAGD    cisbp__M6275--SERPINE1
## [22] cisbp__M6275--STC2     cisbp__M6275--VLDLR    cisbp__M6275--WSB1
## + ... omitted several edges


V(mugh)[c(1:5)]$color  = 'red'
V(mugh)[c(6:20)]$color ='green'

E(mugh)[grep("cisbp__M6275",as_ids(E(mugh)))]$color <- "red"
E(mugh)[grep("cisbp__M6279",as_ids(E(mugh)))]$color <- "blue"
E(mugh)[grep("cisbp__M0062",as_ids(E(mugh)))]$color <- "green"
E(mugh)[grep("cisbp__M4575",as_ids(E(mugh)))]$color <- "yellow"
E(mugh)[grep("cisbp__M4476",as_ids(E(mugh)))]$color <- "pink"
layouts <- grep("^layout_", ls("package:igraph"), value=TRUE)[-1]
# Remove layouts that do not apply to our graph.
layouts <- layouts[!grepl("bipartite|merge|norm|sugiyama|tree", layouts)]

length(layouts)


## [1] 15


par(mfrow=c(3,5), mar=c(1,1,1,1))
for (layout in layouts) {
    print(layout)
    l <- do.call(layout, list(mugh))
    plot(mugh, edge.arrow.mode=1, layout=l, main=layout) }
visNetwork
我们看到有些基因与所有的motif都没有链接,把它们去掉。
library(visNetwork)
motifs <- unique(as.character(edges[,1]))
genes <- unique(as.character(edges[,2]))
nodes <- data.frame(id=c(motifs, genes),
      label=c(motifs, genes),
      title=c(motifs, genes), # tooltip
      shape=c(rep("diamond", length(motifs)), rep("elypse", length(genes))),
      color=c(rep("purple", length(motifs)), rep("skyblue", length(genes))))
visNetwork(nodes, edges) %>% visOptions(highlightNearest = TRUE,
                                        nodesIdSelection = TRUE)
我们这期主要介绍转录因子结合motif富集到调控网络 (RcisTarget)。当然这种方法也可以应用于单细胞的数据,目前单细胞测序的费用也在降低,单细胞系列可算是目前的测序神器,有这方面需求的老师,联系桓峰基因,提供最高端的科研服务!
桓峰基因,铸造成功的您!
未来桓峰基因公众号将不间断的推出单细胞系列生信分析教程,
敬请期待!!
有想进生信交流群的老师可以扫最后一个二维码加微信,备注“单位+姓名+目的”,有些想发广告的就免打扰吧,还得费力气把你踢出去!
References:
-
Aibar. et al. (2016) RcisTarget: Identify transcription factor binding motifs enriched on a gene list. R/Bioconductor package.
-
Aibar et al. (2017) SCENIC: single-cell regulatory network inference and clustering. Nature Methods. doi: 10.1038/nmeth.4463

