Kaggle——海星目标检测比赛
文章目录
-
- 一、赛事简介
- 二、数据描述
- 三 、数据预处理
-
- 3.1 导入相关库,设置超参数
- 3.2 数据清洗
- 3.3 ✏️写入标注图片
- 3.4 获取bbox,生成标注文件
- 3.5 创建Folds字段,划分训练集和验证集
- 四、数据分析,可视化展示
-
- 4.1 ⭕BBox分布
- 4.2 可视化展示
- 五、 [YOLOv5](https://github.com/ultralytics/yolov5/)训练
-
- 5.1 ⭐ WandB跟踪训练
- 5.2 ⚙️配置参数
- 5.3 设定参数,开始训练
- 5.4 ✨查看训练结果
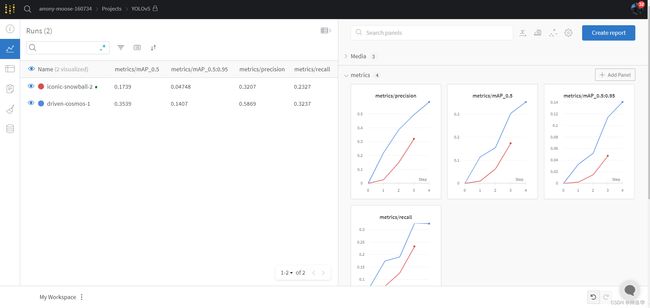
- 5.5 Result
- 六、推理
-
- 6.1 加载训练结果为数据集
- 6.2 定义加载模型和预测函数
- 6.3 推理
- 七、 PyTorch Hub yolov5
-
- 7.1 推理示例
- 7.2 训练
参考《Kaggle-海底海星目标检测Baseline》、《Great-Barrier-Reef: YOLOv5 [train]》
一、赛事简介
-
赛事地址:https://www.kaggle.com/c/tensorflow-great-barrier-reef
-
赛题目标:建立一个根据珊瑚礁水下视频训练的目标检测模型,实时准确地识别海星。
-
赛题背景:
- 澳大利亚美丽无比的大堡礁是世界上最大的珊瑚礁,有1500种鱼类、400种珊瑚、130种鲨鱼、鳐鱼和大量其他海洋生物。
- 不幸的是,珊瑚礁正面临威胁,部分原因是一种特殊海星的数量过多,这种海星是吃珊瑚的刺海星冠(简称
COTS)。科学家、旅游经营者和珊瑚礁管理者制定了一项大规模干预计划,将COTS疫情控制在生态可持续的水平。 - 在这次比赛中,你将在大堡礁周围不同时间和地点拍摄的水下图像中(其实是拍摄视频中抽取的图像),预测刺海星冠的存在和位置。预测采用边界框的形式,并对每一个确定的海星进行置信度评分。
-
注意事项:本次比赛是Code Competition,CPU/GPU笔记本<=9小时运行时间,提交文件必须命名为Submission.csv。
二、数据描述
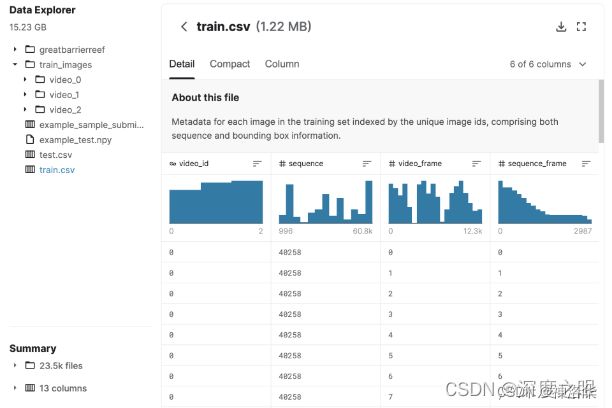
本次比赛使用了一个隐藏的测试集,该测试集将由一个API提供,以确保您以每个视频中记录的相同顺序评估图像。当你提交的笔记本被打分时,你的笔记本上会有实际的测试数据(包括提交的样本)。
-
训练集:
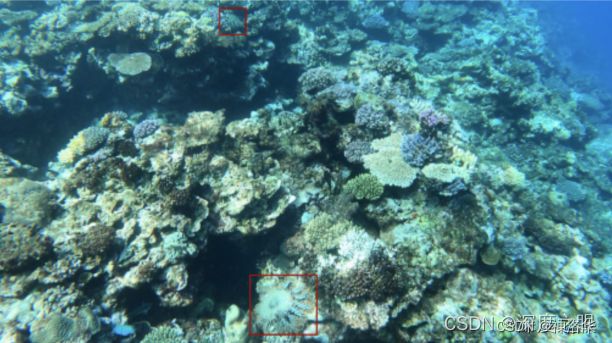
video_{video_id}/{video_frame_number}.jpg.格式的图片。一共有23501张图片,其中只有4917张有标注信息(有CTOS)。查看一张标注图片,如下图所示:
-
train.csv中包含了三个视频抽帧后的图片信息标注,其中几个重要参数:
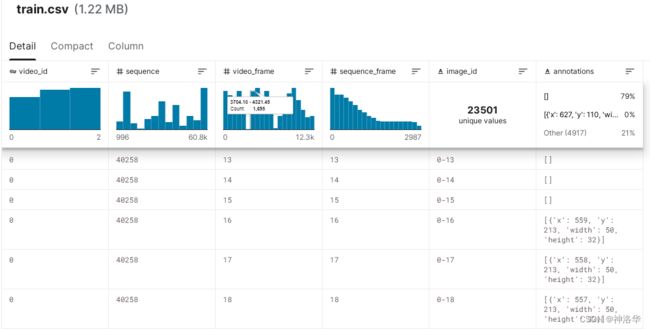
video_id:图像所属视频的 ID 号。video_frame:视频中图像的帧数。当潜水员浮出水面时,预计会偶尔看到帧数的差距。sequence:给定视频的无间隙子集的 ID。序列 id 没有有意义的排序。sequence_frame:给定序列中的帧号。image_id:图像的 ID 代码,格式为“{video_id}-{video_frame}”annotations:边界框,由其在图像内左上角的像素坐标 (x_min, y_min) 及其宽度和高度(以像素为单位)来表示。
-
其它文件/文件夹:
greatbarrierreef:用于生成测试集图片的API,API按照视频和帧编号的顺序,将图像一个接一个地作为pixel arrays提供。测试集图片大约13000张。初始化后运行API需要消耗很多内存,建议运行此API后再加载模型 。example_sample_submission.csv:提交示例,每个预测行都需要包含图像的所有边界框。提交格式似乎也是COCO,即[x_min,y_min,width,height]。
三 、数据预处理
注意:3-6章代码是《Great-Barrier-Reef: YOLOv5 [train]》的代码,建议fork后运行。
3.1 导入相关库,设置超参数
安装需要的包
# !pip install -qU wandb kaggle现在依旧默认安装了wandb
!pip install -qU bbox-utility # check https://github.com/awsaf49/bbox for source code
import numpy as np
from tqdm.notebook import tqdm
tqdm.pandas() # 可以显示pandas操作的进度条
import pandas as pd
import os
import cv2
import matplotlib.pyplot as plt
import glob

import shutil
import sys
sys.path.append('../input/tensorflow-great-barrier-reef')

from joblib import Parallel, delayed
from IPython.display import display
设置超参数
FOLD      = 1 # which fold to train
REMOVE_NOBBOX = True # remove images with no bbox
ROOT_DIR  = '../input/tensorflow-great-barrier-reef/' # 原始数据集的路径
IMAGE_DIR = './kaggle/images' # 新的训练集图片路径
LABEL_DIR = './kaggle/labels' # 新的训练集图片标签路径
新建两个文件夹,用于存放标注图片和其标注信息
!mkdir -p {IMAGE_DIR}
!mkdir -p {LABEL_DIR}
3.2 数据清洗
先读取train.csv,如下图所示,原始图片位置是"数据集地址/train_images/video_id/video_frame.jpg"

# Train Data
df = pd.read_csv(f'{ROOT_DIR}/train.csv')
df['old_image_path'] = f'{ROOT_DIR}/train_images/video_'+df.video_id.astype(str)+'/'+df.video_frame.astype(str)+'.jpg'
# image_id 已经包含了video_id和video_frame,直接以此作为图片样本编号
df['image_path']  = f'{IMAGE_DIR}/'+df.image_id+'.jpg'
df['label_path']  = f'{LABEL_DIR}/'+df.image_id+'.txt'
df['annotations'] = df['annotations'].progress_apply(eval) # progress_apply可以监视运行进度
display(df.head(2))
	video_id	sequence	video_frame	sequence_frame	image_id	annotations				old_image_path							image_path				label_path
0		0		40258		  0				0				0-0			[]	/kaggle/input/tensorflow-great-barrier-reef//t...	/kaggle/images/0-0.jpg	/kaggle/labels/0-0.txt
1		0		40258		  1				1				0-1			[]	/kaggle/input/tensorflow-great-barrier-reef//t...	/kaggle/images/0-1.jpg	/kaggle/labels/0-1.txt
将近80%的图片没有标注框
df['num_bbox'] = df['annotations'].progress_apply(lambda x: len(x))
data = (df.num_bbox>0).value_counts(normalize=True)*100
print(f"No BBox: {data[0]:0.2f}% | With BBox: {data[1]:0.2f}%")
No BBox: 79.07% | With BBox: 20.93%
选取有标注框的图片信息
df = df.query("num_bbox>0")
3.3 ✏️写入标注图片
我们需要将有标注的图像复制到当前目录(/kaggle/working)中作为训练集,因 为/kagglet/input没有YOLOv5所需的写入权限。使用joblib进行并行计算可加快此过程。
def make_copy(row):
    shutil.copyfile(row.old_image_path, row.image_path)
    return
image_paths = df.old_image_path.tolist()
_ = Parallel(n_jobs=-1, backend='threading')(delayed(make_copy)(row) for _, row in tqdm(df.iterrows(), total=len(df)))
- 针对日常的文件和目录管理任务,shutil 模块提供了一个易于使用的高级接口。简单用法也可参考帖子《shutil 用法》。
- Joblib就是一个可以简单地将Python代码转换为并行计算模式的软件包,它提供了一个简单地程序并行方案,主要有Parallel函数实现,并涉及了一个技巧性的函数delayed。可参考帖子《python并行库------joblib》
3.4 获取bbox,生成标注文件
- 获取bbox信息
from bbox.utils import coco2yolo, coco2voc, voc2yolo
from bbox.utils import draw_bboxes, load_image
from bbox.utils import clip_bbox, str2annot, annot2str

def get_bbox(annots):
    bboxes = [list(annot.values()) for annot in annots]
    return bboxes

def get_imgsize(row):
    row['width'], row['height'] = imagesize.get(row['image_path'])
    return row

np.random.seed(32)
colors = [(np.random.randint(255), np.random.randint(255), np.random.randint(255))\
          for idx in range(1)]

df['bboxes'] = df.annotations.progress_apply(get_bbox) # 直接得到标注框的[xmin,ymin,w,h]信息
colors
[(215, 43, 133)]
获取图片尺寸
df['width']  = 1280
df['height'] = 720
df
- 生成yolo格式标注文件
- yolo格式标注文件是*.txt,每个对象一行,每行都是
class [x_center, y_center, width, height]的格式。 - 标注框坐标必须为标准化xywh格式(从0到1)。如果框以像素为单位,要将x_center和width除以图像宽度,将y_center与height除以图像高度。
- 比赛的bbox格式为COCO,即
[x_min,y_min,width,height],要将其转为yolo格式。
cnt = 0
all_bboxes = []
bboxes_info = []
for row_idx in tqdm(range(df.shape[0])):
    row = df.iloc[row_idx] # 读取df的一行数据
    image_height = row.height
    image_width  = row.width
    # 读取coco格式的标注框信息,比如array([[559., 213.,  50.,  32.]], dtype=float32)
    bboxes_coco  = np.array(row.bboxes).astype(np.float32).copy()
    num_bbox     = len(bboxes_coco) # 标注框个数
    names        = ['cots']*num_bbox # 每个标注框名字都是cots(刺海星冠)
    labels       = np.array([0]*num_bbox)[..., None].astype(str) #  array([['0'],['0']],[..., None]表示增加一个维度
    ## Create Annotation(YOLO)
    with open(row.label_path, 'w') as f:
    	# 这一步表示如果读取的行没有标注框,标注信息就填'',且表示'Missing:'的cnt+1
        if num_bbox<1:
            annot = ''
            f.write(annot)
            cnt+=1
            continue
        # 将coco格式标注框[xmin,ymin,w,h]转为voc格式标注框[xmin,ymin,xmax,ymax]比如array([[559., 213., 609., 245.]])
        bboxes_voc  = coco2voc(bboxes_coco, image_height, image_width)
        bboxes_voc  = clip_bbox(bboxes_voc, image_height, image_width)
        # 将voc格式标注框[xmin,ymin,w,h]转为yolo格式标注框[xcenter,ycenter,w,h]
        # 比如array([['0.5407407', '0.31805557', '0.0462963', '0.04444447']]),标准格式
        bboxes_yolo = voc2yolo(bboxes_voc, image_height, image_width).astype(str)

        all_bboxes.extend(bboxes_yolo.astype(float))
        bboxes_info.extend([[row.image_id, row.video_id, row.sequence]]*len(bboxes_yolo))
        # 将标签信息连上标注框信息
        annots = np.concatenate([labels, bboxes_yolo], axis=1)
        string = annot2str(annots) # 转为字符格式,比如'0 0.5407407 0.31805557 0.0462963 0.04444447'
        f.write(string) # 将转换完的标签和yolo格式标注框信息写入label文件夹下对应名字的txt文件,每行为一个目标样本
print('Missing:',cnt)
我们读取一个txt文件看看:
!cat ./kaggle/labels/0-100.txt

0 0.2609375 0.9375 0.090625 0.122222185
3.5 创建Folds字段,划分训练集和验证集
每个fold中的样本数不相同,这可能会在交叉验证(Cross-Validation中产生较大差异。所以使用GroupKFold。GroupKFold 会保证同一个group的数据不会同时出现在训练集和测试集上。因为如果训练集中包含了每个group的几个样例,可能训练得到的模型能够足够灵活地从这些样例中学习到特征,在测试集上也会表现很好,但是来了一个新的group就会表现很差。
简单说一会就是用video1的所有图片做验证集,video0和video2的图片做训练集,划分时不会跨group的范围
from sklearn.model_selection import GroupKFold
kf = GroupKFold(n_splits = 3)
df = df.reset_index(drop=True) # 重设索引,之前索引是原始train.csv中的索引,不连续
df['fold'] = -1
# 根据video_id给df每一行添加fold字段,其值等于video_id
for fold, (train_idx, val_idx) in enumerate(kf.split(df, groups=df.video_id.tolist())):
    df.loc[val_idx, 'fold'] = fold
display(df.fold.value_counts()) # # 三段视频分别有2143、2099和677张有标注的图片
0    2143
1    2099
2     677
Name: fold, dtype: int64
# 前面设定了FOLD = 1,query引用外部变量,前面要加@
train_files = []
val_files   = []
train_df = df.query("fold!=@FOLD")
valid_df = df.query("fold==@FOLD")
train_files += list(train_df.image_path.unique())
val_files += list(valid_df.image_path.unique())
len(train_files), len(val_files)

(2820, 2099)
四、数据分析,可视化展示
4.1 ⭕BBox分布
bbox_df = pd.DataFrame(np.concatenate([bboxes_info, all_bboxes], axis=1),
             columns=['image_id','video_id','sequence',
                     'xmid','ymid','w','h'])
bbox_df[['xmid','ymid','w','h']] = bbox_df[['xmid','ymid','w','h']].astype(float)
bbox_df['area'] = bbox_df.w * bbox_df.h * 1280 * 720
bbox_df = bbox_df.merge(df[['image_id','fold']], on='image_id', how='left')
bbox_df.head(2)
- Area
import matplotlib as mpl
import seaborn as sns

f, ax = plt.subplots(figsize=(12, 6))
sns.despine(f)

sns.histplot(
    bbox_df,
    x="area", hue="fold",
    multiple="stack",
    palette="viridis",
    edgecolor=".3",
    linewidth=.5,
    log_scale=True,
)
ax.xaxis.set_major_formatter(mpl.ticker.ScalarFormatter())
ax.set_xticks([500, 1000, 2000, 5000, 10000]);
x_val = all_bboxes[...,2]
y_val = all_bboxes[...,3]

# Calculate the point density
xy = np.vstack([x_val,y_val])
z = gaussian_kde(xy)(xy)

fig, ax = plt.subplots(figsize = (10, 10))
# ax.axis('off')
ax.scatter(x_val, y_val, c=z, s=100, cmap='viridis')
# ax.set_xlabel('bbox_width')
# ax.set_ylabel('bbox_height')
plt.show()
4.2 可视化展示
df2 = df[(df.num_bbox>0)].sample(100) # takes samples with bbox
y = 3; x = 2
plt.figure(figsize=(12.8*x, 7.2*y))
for idx in range(x*y):
    row = df2.iloc[idx]
    img           = load_image(row.image_path)
    image_height  = row.height
    image_width   = row.width
    with open(row.label_path) as f:
        annot = str2annot(f.read())
    bboxes_yolo = annot[...,1:]
    labels      = annot[..., 0].astype(int).tolist()
    names         = ['cots']*len(bboxes_yolo)
    plt.subplot(y, x, idx+1)
    plt.imshow(draw_bboxes(img = img,
                           bboxes = bboxes_yolo,
                           classes = names,
                           class_ids = labels,
                           class_name = True,
                           colors = colors,
                           bbox_format = 'yolo',
                           line_thickness = 2))
    plt.axis('OFF')
plt.tight_layout()
plt.show()
五、 YOLOv5训练
5.1 ⭐ WandB跟踪训练

Weights&Biases(W&B)是MLOps平台用于跟踪我们的试验,W&B的一些功能:
- 跟踪、比较和可视化ML实验
- 获取实时指标、终端日志和系统统计数据流式传输到集中式仪表板。
- 解释您的模型是如何工作的,显示模型版本如何改进的图表,讨论bug,并演示里程碑的进展。
import wandb

try:
    from kaggle_secrets import UserSecretsClient
    user_secrets = UserSecretsClient()
    api_key = user_secrets.get_secret("WANDB")
    wandb.login(key=api_key)
    anonymous = None
except:
    wandb.login(anonymous='must')
    print('To use your W&B account,\nGo to Add-ons -> Secrets and provide your W&B access token. Use the Label name as WANDB. \nGet your W&B access token from here: https://wandb.ai/authorize')
5.2 ⚙️配置参数
关于yolov5的原理和配置参数的解释(比如数据增强策略),可以参考我的帖子《YOLOv1——YOLOX系列及FCOS目标检测算法详解》第六章YOLOV5,好评点赞啊。
dataset config需要:
- 数据集根目录相对于train / val / test image目录或txt文件目录的相对路径
- 类别数nc
- 类别名列表
- 将以上信息处理完毕写入
gbr.yaml
import yaml

cwd = '/kaggle/working/'

# 创建train.txt和val.txt,每一行都是一个图片名,比如'./kaggle/images/1-461.jpg'
with open(os.path.join( cwd , 'train.txt'), 'w') as f:
    for path in train_df.image_path.tolist():
        f.write(path+'\n')

with open(os.path.join(cwd , 'val.txt'), 'w') as f:
    for path in valid_df.image_path.tolist():
        f.write(path+'\n')

data = dict(
    path  = '/kaggle/working',
    train =  os.path.join( cwd , 'train.txt') ,
    val   =  os.path.join( cwd , 'val.txt' ),
    nc    = 1,
    names = ['cots'],
    )

with open(os.path.join( cwd , 'gbr.yaml'), 'w') as outfile:
    yaml.dump(data, outfile, default_flow_style=False)

f = open(os.path.join( cwd , 'gbr.yaml'), 'r')
print('\nyaml:')
print(f.read())
yaml:
names:
- cots
nc: 1
path: /kaggle/working
train: /kaggle/working/train.txt
val: /kaggle/working/val.txt
- 将训练参数设定完,写入
hyp.yaml
%%writefile /kaggle/working/hyp.yaml
lr0: 0.01  # 初始学习率 (SGD=1E-2, Adam=1E-3)
lrf: 0.1  # 最终OneCycleLR学习率 (lr0 * lrf)
momentum: 0.937  # SGD momentum/Adam beta1
weight_decay: 0.0005  # optimizer weight decay 5e-4
warmup_epochs: 3.0  # warmup epochs (fractions ok)
warmup_momentum: 0.8  # warmup initial momentum
warmup_bias_lr: 0.1  # warmup initial bias lr
box: 0.05  # box loss gain
cls: 0.5  # cls loss gain
cls_pw: 1.0  # cls BCELoss positive_weight
obj: 1.0  # obj loss gain (scale with pixels)
obj_pw: 1.0  # obj BCELoss positive_weight
iou_t: 0.20  # IoU training threshold
anchor_t: 4.0  # anchor-multiple threshold
# anchors: 3  # anchors per output layer (0 to ignore)
fl_gamma: 0.0  # focal loss gamma (efficientDet default gamma=1.5)
hsv_h: 0.015  # image HSV-Hue augmentation (fraction)
hsv_s: 0.7  # image HSV-Saturation augmentation (fraction)
hsv_v: 0.4  # image HSV-Value augmentation (fraction)
# 下面是数据增强策略
degrees: 0.0  # image rotation (+/- deg)
translate: 0.10  # image translation (+/- fraction)
scale: 0.5  # image scale (+/- gain)
shear: 0.0  # image shear (+/- deg)
perspective: 0.0  # image perspective (+/- fraction), range 0-0.001
flipud: 0.5  # image flip up-down (probability)
fliplr: 0.5  # image flip left-right (probability)
mosaic: 0.5  # image mosaic (probability)
mixup: 0.5 # image mixup (probability)
copy_paste: 0.0  # segment copy-paste (probability)
%cd /kaggle/working
!rm -r /kaggle/working/yolov5
# !git clone https://github.com/ultralytics/yolov5 # clone
!cp -r /kaggle/input/yolov5-lib-ds /kaggle/working/yolov5 #
%cd yolov5
%pip install -qr requirements.txt  # install

from yolov5 import utils
display = utils.notebook_init()  # check
5.3 设定参数,开始训练
上面都跑通没有问题的时候,点击notebook右上角save version,弹出窗口选Run&Save All。真正开始跑的时候,下面弹出窗口会有一个查看log选项(我这是跑完了,没有log选项),可以实时查看训练日志。
我这么做是因为kaggle notebook的output文件夹不能保存结果,每次重新打开都会清理掉。保存版本,输出会保存。
DIM       = 3000
MODEL     = 'yolov5s6'
BATCH     = 4
EPOCHS    = 7
OPTMIZER  = 'Adam'

PROJECT   = 'great-barrier-reef-public' # w&b in yolov5
NAME      = f'{MODEL}-dim{DIM}-fold{FOLD}' # w&b for yolov5
!python train.py --img {DIM}\
--batch {BATCH}\
--epochs {EPOCHS}\
--optimizer {OPTMIZER}\
--data /kaggle/working/gbr.yaml\
--hyp /kaggle/working/hyp.yaml\
--weights {MODEL}.pt\
--project {PROJECT} --name {NAME}\
--exist-ok
运行日志:Successfully ran in 18086.5s
18006.6s	293	[34m[1mwandb[0m:           best/epoch 6
18006.6s	294	[34m[1mwandb[0m:         best/mAP_0.5 0.87645
18006.6s	295	[34m[1mwandb[0m:    best/mAP_0.5:0.95 0.39294
18006.6s	296	[34m[1mwandb[0m:       best/precision 0.91159
18006.6s	297	[34m[1mwandb[0m:          best/recall 0.78313
18006.6s	298	[34m[1mwandb[0m:      metrics/mAP_0.5 0.87644
18006.6s	299	[34m[1mwandb[0m: metrics/mAP_0.5:0.95 0.39324
18006.6s	300	[34m[1mwandb[0m:    metrics/precision 0.9094
18006.6s	301	[34m[1mwandb[0m:       metrics/recall 0.78359
18006.6s	302	[34m[1mwandb[0m:       train/box_loss 0.03609
18006.6s	303	[34m[1mwandb[0m:       train/cls_loss 0.0
18006.6s	304	[34m[1mwandb[0m:       train/obj_loss 0.03753
18006.6s	305	[34m[1mwandb[0m:         val/box_loss 0.02665
18006.6s	306	[34m[1mwandb[0m:         val/cls_loss 0.0
18006.6s	307	[34m[1mwandb[0m:         val/obj_loss 0.04279
18006.6s	308	[34m[1mwandb[0m:                x/lr0 0.00135
18006.6s	309	[34m[1mwandb[0m:                x/lr1 0.00135
18006.6s	310	[34m[1mwandb[0m:                x/lr2 0.00135
5.4 ✨查看训练结果
设定输出文件夹
OUTPUT_DIR = '{}/{}'.format(PROJECT, NAME)
!ls {OUTPUT_DIR}
F1_curve.png				   results.png
PR_curve.png				   train_batch0.jpg
P_curve.png					   train_batch1.jpg
R_curve.png					   train_batch2.jpg
confusion_matrix.png		   val_batch0_labels.jpg
hyp.yaml					   val_batch1_labels.jpg
labels.jpg					   val_batch2_labels.jpg
labels_correlogram.jpg		   val_batch1_pred.jpg
opt.yaml					   val_batch2_pred.jpg
results.csv					   val_batch0_pred.jpg
weights
events.out.tfevents.1642514935.08fbaec58f7c.146.0
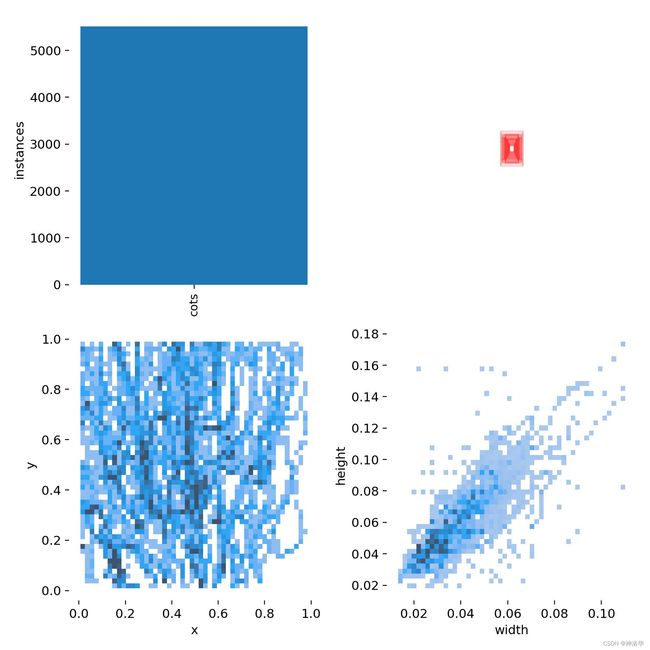
- 查看类别分布:
# 也就是刚打开的Wandb界面的Labels(index=0)

plt.figure(figsize = (10,10))
plt.axis('off')
plt.imshow(plt.imread(f'{OUTPUT_DIR}/labels_correlogram.jpg'));
# Wandb界面的Labels(index=1)

plt.figure(figsize = (10,10))
plt.axis('off')
plt.imshow(plt.imread(f'{OUTPUT_DIR}/labels.jpg'));
- 查看一个bacth的图片
# Wandb界面的Mosaics(yolov5s6-dim3000-fold1)

import matplotlib.pyplot as plt
plt.figure(figsize = (10, 10))
plt.imshow(plt.imread(f'{OUTPUT_DIR}/train_batch0.jpg'))

plt.figure(figsize = (10, 10))
plt.imshow(plt.imread(f'{OUTPUT_DIR}/train_batch1.jpg'))

plt.figure(figsize = (10, 10))
plt.imshow(plt.imread(f'{OUTPUT_DIR}/train_batch2.jpg'))
- 真实框和预测框对比:
fig, ax = plt.subplots(3, 2, figsize = (2*9,3*5), constrained_layout = True)
for row in range(3):
    ax[row][0].imshow(plt.imread(f'{OUTPUT_DIR}/val_batch{row}_labels.jpg'))
    ax[row][0].set_xticks([])
    ax[row][0].set_yticks([])
    ax[row][0].set_title(f'{OUTPUT_DIR}/val_batch{row}_labels.jpg', fontsize = 12)

    ax[row][1].imshow(plt.imread(f'{OUTPUT_DIR}/val_batch{row}_pred.jpg'))
    ax[row][1].set_xticks([])
    ax[row][1].set_yticks([])
    ax[row][1].set_title(f'{OUTPUT_DIR}/val_batch{row}_pred.jpg', fontsize = 12)
plt.show()
5.5 Result
六、推理
- 我醉了,做完才发现,比赛截止,greatbarrierreef API不再生成测试集了,现在没法提交比赛结果。
- 本节加载模型和预测部分,使用的是pytorch hub的模式,不懂的可以看第七章。
6.1 加载训练结果为数据集
跑完之后,在刚刚的notebook的Data标签页可以看到输出结果,这个会一直保存。

重新打开notebook,将刚刚的output作为数据集添加进来。
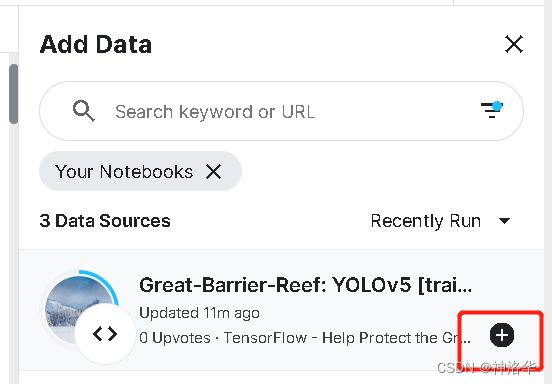
添加成功:

如果你打开看,会发现只有图片。这是因为output的kaggle文件夹下,图片太多导致显示不全。用ls打印就知道啦:
# 训练完当前路径可能在output/working/yolov5,要先切回working目录
!ls ../input/great-barrier-reef-yolov5-train
__notebook__.ipynb  __results___files  hyp.yaml     train.txt  yolov5
__output__.json     custom.css	       kaggle	    val.cache
__results__.html    gbr.yaml	       train.cache  val.txt
6.2 定义加载模型和预测函数
def load_model(ckpt_path, conf=0.25, iou=0.50):
    model = torch.hub.load('/kaggle/input/yolov5-lib-ds',
                           'custom',
                           path=ckpt_path,
                           source='local',
                           force_reload=True)  # local repo
    model.conf = conf  # NMS confidence threshold
    model.iou  = iou  # NMS IoU threshold
    model.classes = None   # (optional list) filter by class, i.e. = [0, 15, 16] for persons, cats and dogs
    model.multi_label = False  # NMS multiple labels per box
    model.max_det = 1000  # maximum number of detections per image
    return model
模型预测结果results.pandas().xyxy[0]打印出来就是:
        xmin        ymin        xmax        ymax  confidence  class  name
0  886.161499  466.744629  957.082031  530.237793    0.601243    0  cots
1  743.790710  616.339294  813.644897  683.003784    0.433469    0  cots
# 预测模型结果,bboxes是voc格式,将其转为coco格式
def predict(model, img, size=768, augment=False):
    height, width = img.shape[:2]
    results = model(img, size=size, augment=augment)  # custom inference size
    preds   = results.pandas().xyxy[0] # 预测结果的tensor格式
    bboxes  = preds[['xmin','ymin','xmax','ymax']].values
    if len(bboxes):
        bboxes  = voc2coco(bboxes,height,width).astype(int)
        confs   = preds.confidence.values
        return bboxes, confs
    else:
        return [],[]

# 将刚刚预测结果进行比赛结果的标准化,即  {conf} {xmin} {ymin} {w} {h}  的格式
def format_prediction(bboxes, confs):
    annot = ''
    if len(bboxes)>0:
        for idx in range(len(bboxes)):
            xmin, ymin, w, h = bboxes[idx]
            conf             = confs[idx]
            annot += f'{conf} {xmin} {ymin} {w} {h}'
            annot +=' '
        annot = annot.strip(' ')
    return annot

def show_img(img, bboxes, bbox_format='yolo'):
    names  = ['starfish']*len(bboxes)
    labels = [0]*len(bboxes)
    img    = draw_bboxes(img = img,
                           bboxes = bboxes,
                           classes = names,
                           class_ids = labels,
                           class_name = True,
                           colors = colors,
                           bbox_format = bbox_format,
                           line_thickness = 2)
    return Image.fromarray(img).resize((800, 400))
ROOT_DIR  = '/kaggle/input/tensorflow-great-barrier-reef/'
# CKPT_DIR  = '/kaggle/input/greatbarrierreef-yolov5-train-ds'
CKPT_PATH = '../input/great-barrier-reef-yolov5-train/yolov5/great-barrier-reef-public/yolov5s6-dim3000-fold2/weights/best.pt' # 这是刚刚加载output为数据集后的模型最优参数
IMG_SIZE  = 9000
CONF      = 0.25
IOU       = 0.40
AUGMENT   = True
6.3 推理
- 在训练集上进行推理
import torch
from PIL import Image
from bbox.utils import  voc2coco

model = load_model(CKPT_PATH, conf=CONF, iou=IOU)
image_paths = df[df.num_bbox>1].sample(100).image_path.tolist()
for idx, path in enumerate(image_paths):
    img = cv2.imread(path)[...,::-1]
    bboxes, confis = predict(model, img, size=IMG_SIZE, augment=AUGMENT)
    #display(show_img(img, bboxes, bbox_format='coco'))
    print(bboxes)
    if idx>5:
        break
- 在测试集上进行推理
import greatbarrierreef
env = greatbarrierreef.make_env()# initialize the environment
iter_test = env.iter_test()
model = load_model(CKPT_PATH, conf=CONF, iou=IOU)
for idx, (img, pred_df) in enumerate(tqdm(iter_test)):
    bboxes, confs  = predict(model, img, size=IMG_SIZE, augment=AUGMENT)
    annot          = format_prediction(bboxes, confs) # 比赛要的结果格式
    pred_df['annotations'] = annot
    env.predict(pred_df)
sub_df = pd.read_csv('submission.csv')
sub_df
七、 PyTorch Hub yolov5
本节介绍如何从 PyTorch Hub下载yolov5进行训练。首先安装:
不需要再克隆
https://github.com/ultralytics/yolov5仓库了
$ pip install -r https://raw.githubusercontent.com/ultralytics/yolov5/master/requirements.txt
7.1 推理示例
- 下面是用yolov5进行推理的简单示例,yolov5s是最轻量级和最快的yolov5模型。
import torch

# Model
model = torch.hub.load('ultralytics/yolov5', 'yolov5s')

# Image
img = 'https://ultralytics.com/images/zidane.jpg'

# Inference
results = model(img)
- 详细示例
下面示例是进行一个batch的图片推理,result可以在控制台打印,或者保存到runs/hub。也可以在屏幕上打印显示,或者转换为tensors 或者pandas dataframes。
import cv2
import torch
from PIL import Image

# Model
model = torch.hub.load('ultralytics/yolov5', 'yolov5s')

# Images
for f in ['zidane.jpg', 'bus.jpg']:
    torch.hub.download_url_to_file('https://ultralytics.com/images/' + f, f)  # download 2 images
img1 = Image.open('zidane.jpg')  # PIL image
img2 = cv2.imread('bus.jpg')[:, :, ::-1]  # OpenCV image (BGR to RGB)
imgs = [img1, img2]  # batch of images

# Inference
results = model(imgs, size=640)  # includes NMS

# Results
results.print()
results.save()  # or .show()

results.xyxy[0]  # img1 predictions (tensor)
results.pandas().xyxy[0]  # img1 predictions (pandas)
#      xmin    ymin    xmax   ymax  confidence  class    name
# 0  749.50   43.50  1148.0  704.5    0.874023      0  person
# 1  433.50  433.50   517.5  714.5    0.687988     27     tie
# 2  114.75  195.75  1095.0  708.0    0.624512      0  person
# 3  986.00  304.00  1028.0  420.0    0.286865     27     tie
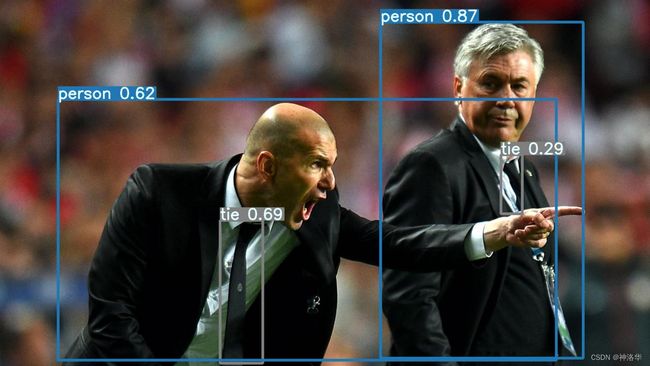
推理设置选项可以查看 YOLOv5 autoShape() 前向传播方法:
def forward(self, imgs, size=640, augment=False, profile=False):
     # Inference from various sources. For height=640, width=1280, RGB images example inputs are:
     #   filename:   imgs = 'data/images/zidane.jpg'
     #   URI:             = 'https://github.com/ultralytics/yolov5/releases/download/v1.0/zidane.jpg'
     #   OpenCV:          = cv2.imread('image.jpg')[:,:,::-1]  # HWC BGR to RGB x(640,1280,3)
     #   PIL:             = Image.open('image.jpg')  # HWC x(640,1280,3)
     #   numpy:           = np.zeros((640,1280,3))  # HWC
     #   torch:           = torch.zeros(16,3,320,640)  # BCHW (scaled to size=640, 0-1 values)
     #   multiple:        = [Image.open('image1.jpg'), Image.open('image2.jpg'), ...]  # list of images
推理settings还包括一些其它属性,如置信阈值、IoU阈值等,可通过以下方式设置:
model.conf = 0.25  # NMS confidence threshold
      iou = 0.45  # NMS IoU threshold
      agnostic = False  # NMS class-agnostic
      multi_label = False  # NMS multiple labels per box
      classes = None  # (optional list) filter by class, i.e. = [0, 15, 16] for COCO persons, cats and dogs
      max_det = 1000  # maximum number of detections per image
      amp = False  # Automatic Mixed Precision (AMP) inference

results = model(im, size=320)  # custom inference size
推理设置:
model.conf = 0.25  # confidence threshold (0-1)
model.iou = 0.45  # NMS IoU threshold (0-1)
model.classes = None  # (optional list) filter by class, i.e. = [0, 15, 16] for persons, cats and dogs

results = model(imgs, size=320)  # custom inference size
7.2 训练
- 加载yolov5s预训练权重,类别数为10.
force_reload=True表示如果加载出了问题,将清除缓存,强制下载最新版的yolov5
model = torch.hub.load('ultralytics/yolov5', 'yolov5s', classes=10,force_reload=True,device='cuda')
下载yolov5模型用来训练而不是推理,要设置autoshape=False,如果要从头训练而不是加载预训练模型,要设置pretrained=False。
model = torch.hub.load('ultralytics/yolov5', 'yolov5s', autoshape=False)  # load pretrained
model = torch.hub.load('ultralytics/yolov5', 'yolov5s', autoshape=False, pretrained=False)  # load scratch
Base64 Results
results = model(imgs)  # inference

results.imgs # array of original images (as np array) passed to model for inference
results.render()  # updates results.imgs with boxes and labels
for img in results.imgs:
    buffered = BytesIO()
    img_base64 = Image.fromarray(img)
    img_base64.save(buffered, format="JPEG")
    print(base64.b64encode(buffered.getvalue()).decode('utf-8'))  # base64 encoded image with results
使用PyTorch Hub加载自己在voc数据集上训练好的YOLOv5s 模型(20个类别,模型权重best.pt)
model = torch.hub.load('ultralytics/yolov5', 'custom', path='path/to/best.pt')  # default
model = torch.hub.load('path/to/yolov5', 'custom', path='path/to/best.pt', source='local')  # 本地加载


