机器学习实战案例:使用随机森林/XGBoosting等模型进行分类预测,提高银行营销活动效率
1. 项目背景介绍
在这篇文章中,我们将使用 Python 搭建逻辑回归(Logistic Regression),随机森林(Random Forest),XGBoosting,Bagging,KNN (K-Nearest Neighbors) ,神经网络(Neural Network)等6种机器学习/深度学习模型,对某个银行的营销活动数据集进行分类预测,尝试找出那些潜在客户。
银行通常会打电话给一些潜在客户来销售一些存款/投资产品,这些投资产品会使银行获得更多利润以及资金的灵活性,因此银行希望能定位那些会购买产品的客户,来进行精准营销提高利润。同时,如果银行能预测哪些客户不会购买产品,那么银行则可以不对这部分客户进行电话营销,从而减少营销成本。本文将使用 UCI Machine Learning Repository 提供的一家葡萄牙银行针对定期存款开展的营销活动数据集进行分类预测。
2. 数据集介绍 & 数据处理
该数据集包含 41,188 个观测值和 21 列(20 个输入变量和 1 个输出变量)。 输入变量有4类:
- (i) 银行客户数据:年龄、工作、学历、学历、信用违约、住房贷款、个人贷款;
- (ii) 与客户联系相关的数据:联系类型、联系的月份、联系的工作日、联系时长;
- (iii) 客户的其他数据:联系次数、距离上一次营销活动的天数、上一次营销活动的结果;
- (iv) 社会和经济数据:就业变化率、消费者价格指数、消费者信心指数、欧元银行同业拆借利率、就业人数。
输出变量 y 则是“客户是否购买了定期存款”。
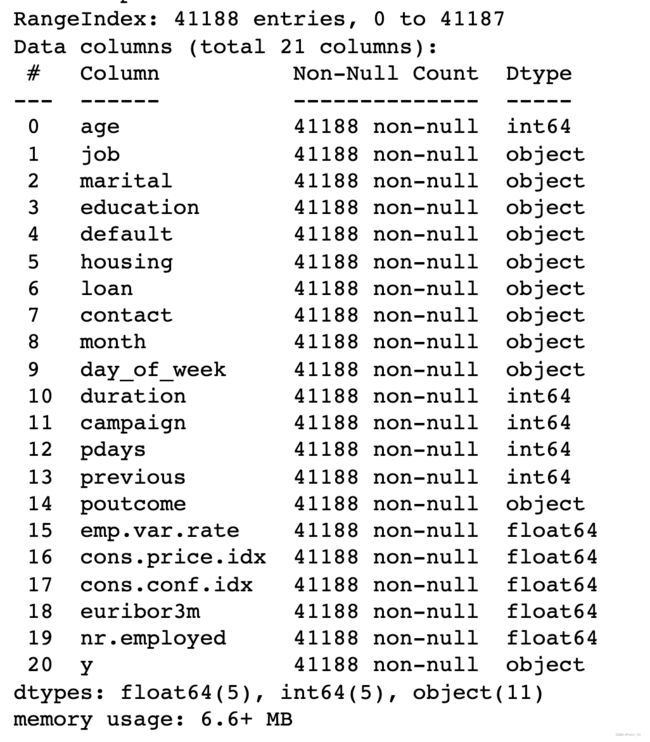
该数据集不包含任何缺失值或空值,因此我们能够直接对数据进行初步分析。
通过检查,我们发现“工作”、“婚姻”、“教育”、“住房”和“贷款”中有一部分“未知”值,由于每个变量的“未知”数据比例不到5%,我们将“未知”值删除。
for col in return_categorical(df):
    if 'unknown'in df[col].unique():
        print("Proportion of'unknown'in " +"'"+ col+"':",df[col].value_counts()["unknown"]/41188*100)
此外,我们删除了“联系时长”(通话时长)和“联系次数”(在此活动期间执行的联系次数)这两个变量,因为如果我们试图对未来某一次营销活动进行预测,那么在活动开始之前这两个变量都是未知的。
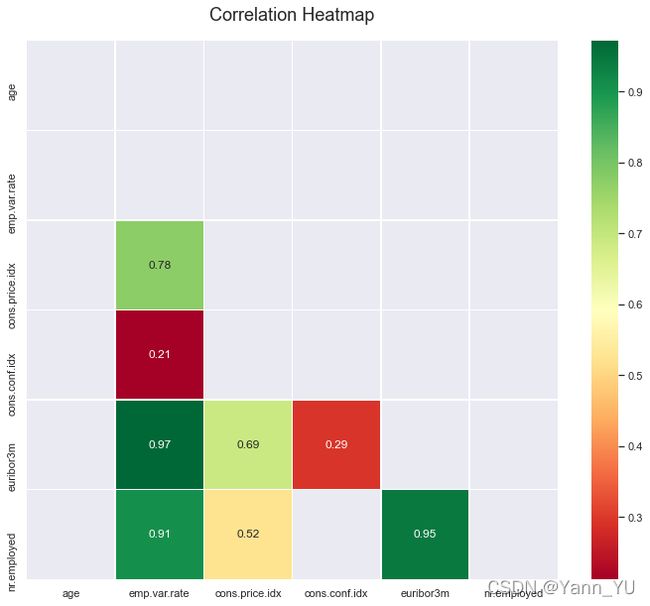
接下来,我们计算变量之间的相关性。我们发现“previous”和“poutcome”变量之高度相关,由于前一个变量中的“0”其实就等于“poutcome”中的“不存在”,因此我们将其中一个变量删除。
plt.figure(figsize=(12,10))
corr= df.corr()
corr = corr[~(np.abs(corr) < 0.2)]
mask = np.triu(np.ones_like(corr, dtype=bool))

heatmap=sns.heatmap(corr,mask=mask, annot=True,cmap ='RdYlGn',linewidths=.5)
heatmap.set_title('Correlation Heatmap', fontdict={'fontsize':18}, pad=20)
并且,我们将“教育水平”变量进行重新归类(因为原本的分类过多且过于细分)
最后,因为“pdays”变量(距离上一次联系客户的天数)的分布极其倾斜,我们将其删除。
def data_prepose(df):
    df.drop(["duration","campaign","pdays","previous"],axis=1,inplace = True)
    df = df[(df["job"]!= "unknown")&(df["marital"]!= "unknown")&(df["education"]!= "unknown")&(df["housing"]!= "unknown")&(df["loan"]!= "unknown")&(df["education"]!="illiterate")]
    df["education"].replace({"basic.4y":"primary","basic.6y":"primary","basic.9y":"primary",
                        "high.school":"secondary",
                         "professional.course":"tertiary","university.degree":"tertiary"},inplace = True)
    return df
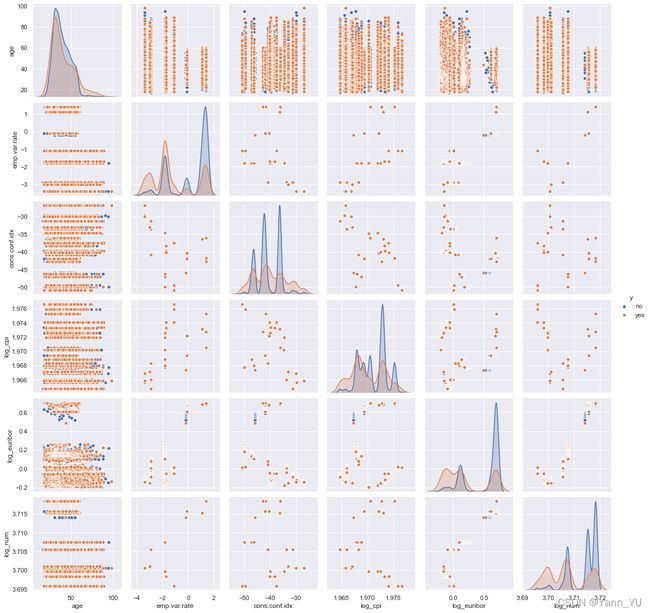
df['log_cpi'] = np.log10(df['cons.price.idx'])
df['log_euribor'] = np.log10(df['euribor3m'])
df['log_num'] = np.log10(df['nr.employed'])

df = df.drop(columns = ['cons.price.idx','euribor3m','nr.employed'])
# df = df.drop(["duration","campaign","pdays","previous"],axis=1,inplace = False)
p=sns.pairplot(df, hue = 'y')
初步检查处理完数据后,我们发现预测变量 y 中,“yes” 和 “no” 数据之间的比例非常不平衡(约为1:8)。 为了解决这个问题,我们使用 SMOTE 算法来平衡训练数据集。 在训练数据集-测试数据集的拆分过程中,我们选取25%的数据作为测试集。
from sklearn.model_selection import train_test_split
train, test = train_test_split(df, test_size = 0.25)
x_train_notsmote = train.iloc[0:,0:50]
y_train_notsmote = train.iloc[0:,50:51]
x_test = test.iloc[0:,0:50]
y_test = test.iloc[0:,50:51]

from imblearn.over_sampling import SMOTE
x_train, y_train = SMOTE().fit_resample(x_train_notsmote, y_train_notsmote)
当然,我们会通过 One Hot Encoding 对 categorical 类型的变量进行处理。最终,我们的数据集有 38227 行,51 列。
3. 模型评估方法
为了评估每个模型的表现,我们使用 5 折交叉验证来拆分数据集并计算测试 AUC、准确度、精确度、召回率和 F1 。 然而在实际生活中,银行更看重如何正确预测 “1”(会购买产品的客户)而不是正确预测 “0” ,因为错过一个目标客户而损失的利润远大于一次无效电话的成本。换句话说,false positive 的成本远低于 false negative的成本。并且,在现实中,负面和正面案例的分布极不平衡。

因此,我们主要根据 F1 分数和召回率(Recall)评估每个模型的性能。召回率(Recall)是模型正确预测的购买客户数量除以实际购买产品的总人数。 Precision 是模型正确预测的购买客户数量除以模型预测的购买客户总数。 F1 分数是Recall和Precision的加权平均值。
4.1 逻辑回归(Logistic Regression)
搭建 Logistic 回归模型时,我们分三步来训练和测试模型:
- 通过递归特征消除 (RFE) 隔离重要变量
- 运行 Logistic 回归来了解重要变量的beta
- 找到最佳参数和阈值
首先,载入需要的第三方库
import pandas as pd
import numpy as np
import pylab as pl
import scipy.stats as stats
import matplotlib
import matplotlib.pyplot as plt
from sklearn import linear_model, metrics
from sklearn.metrics import confusion_matrix
import statsmodels.api as sm
from sklearn.model_selection import GridSearchCV, RandomizedSearchCV
import warnings
from sklearn.feature_selection import RFE
from sklearn.metrics import roc_auc_score
from sklearn.metrics import roc_curve
from sklearn.ensemble import RandomForestClassifier
from sklearn.metrics import confusion_matrix
import seaborn as sns

matplotlib.style.use('seaborn')
%matplotlib inline
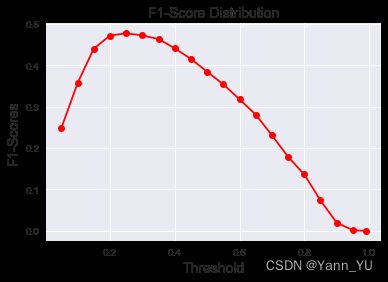
然后,计算不同阈值下模型的表现,来判断应该使用什么阈值
model = linear_model.LogisticRegression(max_iter=10000,random_state=101)

model.fit(x_smote_df, y_smote_df.values.ravel())

y_pred_prob_lr_1 = model.predict_proba(x_test)[:,1]

y_pred_prob_lr_1


def get_classification(predictions,threshold):
    classes = np.zeros_like(predictions)

    for i in range(len(classes)):
        if predictions[i] > threshold:

            classes[i] = 1
    return classes

f1_scores = list()
threshold_list = [0.05,0.1,0.15,0.2,0.25,0.3,0.35,0.4,0.45,0.5,0.55,0.6,0.65,.7,.75,.8,.85,.9,.95,.99]
for i in threshold_list:
    f1_score = metrics.f1_score(y_test,get_classification(y_pred_prob_lr_1,i))
    f1_scores.append(f1_score)

plt.plot(threshold_list, f1_scores, color='red', marker='o')
plt.title('F1-Score Distribution', fontsize=14)
plt.xlabel('Threshold', fontsize=14)
plt.ylabel('F1-Scores', fontsize=14)
plt.grid(True)
plt.show()
df_vars = bank_test_df.columns.values.tolist()
y = ['y_yes']
x = [i for i in df_vars if i not in y]

logreg = linear_model.LogisticRegression(max_iter=10000)

rfe = RFE(logreg)
rfe = rfe.fit(x_smote_df, y_smote_df.values.ravel())
bool_ = rfe.support_

rank = list(rfe.ranking_)
bool_ = list(rfe.support_)
del df_vars[-1]

significant_vars = pd.DataFrame(df_vars)
significant_vars['rank'] = rank
significant_vars['bool'] = bool_
significant_vars.sort_values('rank')

cols = ['输入选择的变量']
x = x_smote_df[cols]
y = y_smote_df['y_yes']

logit_model=sm.Logit(y,x)
result=logit_model.fit(max_iter=1000)
print(result.summary2())
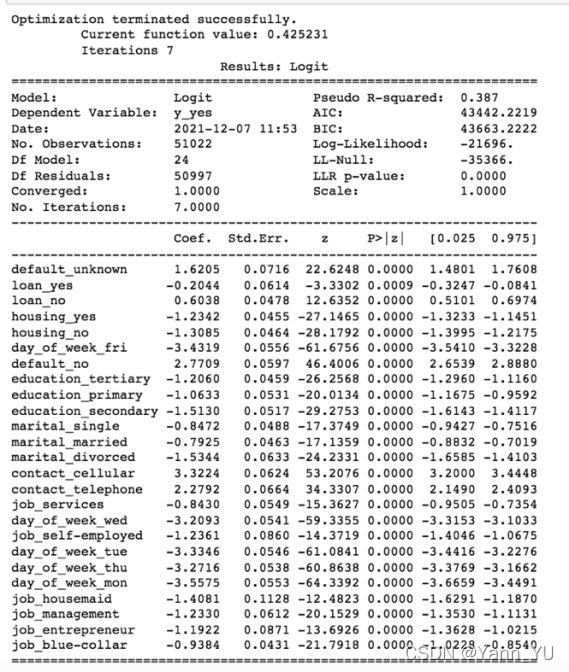
递归特征消除通过考虑较小的特征集来选择最佳特征。我们用这种方法来获取排名靠前的变量,并丢弃不太重要的变量后再进行逻辑回归,回归结果也验证了所有剩余变量都是显著的。
不过这种方法有一个潜在的限制,即逻辑回归模型可能会无法捕捉某些重要的变量,例如年龄、Euribor 利率和员工人数(这些变量在其他模型中是非常重要的)。
逻辑回归中的系数表示因变量变化的结果对数几率的预期变化。比如,我们可以将contact_cellular 和 contact_telephone 系数之间的差异解释为,当我们通过移动电话而不是家庭电话联系客户时,(即logit§ 增加 3.32),那么客户购买产品的几率会增加 27.66%
逻辑回归模型的相关代码如下:
lr_model=linear_model.LogisticRegression(max_iter=10000,random_state=42,
                                         multi_class='auto',solver='liblinear',
                                         class_weight='balanced',C=10)

lr_model.fit(x_smote_df, y_smote_df.values.ravel())

y_pred_prob_lr_2 = lr_model.predict_proba(x_test)[:,1]
y_pred_lr_2 = get_classification(y_pred_prob_lr_2,0.25)


print('AUC: %.4f' % metrics.roc_auc_score(y_test, y_pred_lr_2))
print('Accuracy: %.4f' % metrics.accuracy_score(y_test, y_pred_lr_2))
print('Recall: %.4f' % metrics.recall_score(y_test, y_pred_lr_2))
print('F1-score: %.4f' %metrics.f1_score(y_test, y_pred_lr_2))
print('Precision: %.4f' %metrics.precision_score(y_test, y_pred_lr_2))

metrics.confusion_matrix(y_test, y_pred_lr_2)
4.2 XGBoosting
我们先导入需要用到的第三方库
from xgboost import XGBRegressor as XGBR
import xgboost as xgb

from sklearn.model_selection import KFold, cross_val_score as CVS, train_test_split as TTS
from sklearn.metrics import mean_squared_error as MSE

import pandas as pd
import numpy as np
import matplotlib.pyplot as plt
from time import time
import datetime
读入数据集并且将数据转成 XGBoosting 模型专属的数据格式
### load the train & test data ###
X_train = pd.read_csv('x_train_smote.csv')
y_train = pd.read_csv('y_train_smote.csv')
dtrain = xgb.DMatrix(X_train, label=y_train)

test_raw = pd.read_csv('data_w_dummies_test.csv')
X_test = test_raw.iloc[:,:50]
y_test = test_raw['y_yes']
dtest = xgb.DMatrix(X_test)
使用 GridSearchCV 找到最佳参数,scoring 标准改为 f1-score
### Tuning Parameters ###
from sklearn.model_selection import GridSearchCV
from sklearn.metrics import roc_auc_score

parameters = {
              'max_depth': [3, 5, 10, 15],
              'learning_rate': [0.05, 0.15, 0.25],
              'n_estimators': [500, 1000, 2000],
              'min_child_weight': [0, 2, 5, 10, 20],
              'max_delta_step': [0, 0.2, 0.6, 1, 2],
              'subsample': [0.6, 0.85],
              'colsample_bytree': [0.5, 0.6, 0.7, 0.8, 0.9],
              'reg_alpha': [0, 0.25, 0.5, 0.75, 1],
              'reg_lambda': [0.2, 0.4, 0.6, 0.8, 1],
}

xlf = xgb.XGBClassifier(max_depth=10,
            learning_rate=0.05,
            n_estimators=500,
            objective='binary:hinge',
            gamma=0,
            min_child_weight=1,
            max_delta_step=0,
            subsample=0.85,
            colsample_bytree=0.7,
            colsample_bylevel=1,
            reg_alpha=0,
            reg_lambda=1,
            seed=0,
            use_label_encoder=False)

gs = GridSearchCV(xlf, param_grid=parameters, scoring='f1', cv=5)
gs.fit(X_train, y_train)

print("Best score: %0.3f" % gs.best_score_)
print("Best parameters set: %s" % gs.best_params_ )
找到最佳参数后训练最终的模型(这里就不列出找到的最佳参数了,因为这个结果取决于实际使用的数据集以及设定参数的范围),然后进行预测,并绘制重要性,顺便画一颗 sample tree 感受一下
### Prediction ###
dtest = xgb.DMatrix(X_test)
y_pred = best_xgb.predict(dtest)

# 绘制重要性
xgb.plot_importance(best_xgb,
                    height=0.5,
                    max_num_features=20)

import graphviz
xgb.to_graphviz(best_xgb, num_trees=0)
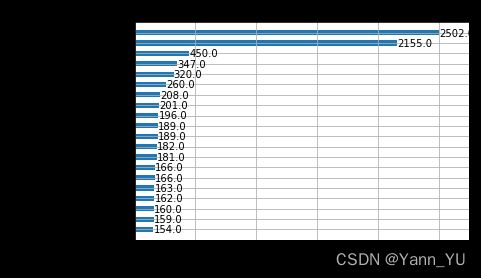
通过检查特征重要性,我们发现大多数变量的特征重要性低于 25(还不到最重要变量的 1%)。我一开始试着删除这些不太重要的变量,但发现删完以后模型表现反而降低了,所以我们决定不删除变量。
总的来说,与简单的树模型和 Bagging 相比,XGBoosting 模型可以防止过拟合问题。然而,XGBoosting 对异常值很敏感,因为 XGBoosting 中的每个模型都会修复前辈中的错误。因此,异常值将显着影响整个模型。另一个缺点是我们无法扩展这种方法,因为每个估计器的正确性都基于先前的预测器。
下面是 sample tree 的样子

最后,我们通过下面的代码查看一下模型的表现情况
from sklearn import metrics
print('AUC: %.4f' % metrics.roc_auc_score(y_test, y_pred))
print('Accuracy: %.4f' % metrics.accuracy_score(y_test, y_pred))
print('Recall: %.4f' % metrics.recall_score(y_test, y_pred))
print('F1-score: %.4f' %metrics.f1_score(y_test, y_pred))
print('Precision: %.4f' %metrics.precision_score(y_test, y_pred))
metrics.confusion_matrix(y_test, y_pred)
4.3 Bagging
Bagging 的搭建思路类似于 XGBoosting,首先我们导入需要用到的第三方库,然后使用GridSearchCV 找最佳参数
from sklearn.ensemble import BaggingClassifier
bag = BaggingClassifier()
bag.fit(X_train, y_train.values.ravel())

from sklearn.model_selection import GridSearchCV
# RUNTIME: 30min
parameters = {
     'n_estimators':(50, 200, 500, 1000),
     'max_samples':(0.6, 0.7, 0.85),
     'max_features':(25, 35, 45),
     #'oob_score':np.ravel(y_test)
}

model = GridSearchCV(BaggingClassifier(), parameters, scoring='f1', cv=5,iid=False)
model.fit(X_train, y_train.values.ravel())
model.best_score_, model.best_params_
找到最佳参数后,训练最终的模型(这里就不列出找到的最佳参数了),然后进行预测,并输出模型表现
final_bag = BaggingClassifier(max_features=25,max_samples=0.85,n_estimators=1000)
final_bag.fit(X_train, y_train.values.ravel())
# final_bag.score(X_test, y_test)
y_pred = final_bag.predict(X_test)
print('AUC: %.4f' % metrics.roc_auc_score(y_test, y_pred))
print('Accuracy: %.4f' % metrics.accuracy_score(y_test, y_pred))
print('Recall: %.4f' % metrics.recall_score(y_test, y_pred))
print('F1-score: %.4f' %metrics.f1_score(y_test, y_pred))
print('Precision: %.4f' %metrics.precision_score(y_test, y_pred))
metrics.confusion_matrix(y_test, y_pred)
因为最终使用的 Bagging 模型中 ‘max_features’ 参数为25,意思是每个小的分类器只用了25个(总量的一半)变量来训练模型,因此这里我们就没有计算特征重要性,如果大家想看 sample tree 的话可以通过下面的代码来画图
from sklearn import tree

fig = plt.figure(figsize=(25,20))
_ = tree.plot_tree(final_bag.estimators_[0],
                   filled=True)
4.4 KNN
由于 KNN 不支持计算 Feature Importance ,我们通过计算不同 K 值对应的 F1 分数来决定最后使用的 K 值,具体代码如下
from sklearn.neighbors import KNeighborsClassifier
from sklearn.metrics import confusion_matrix, accuracy_score
from sklearn import metrics
import numpy as np
from sklearn.metrics import roc_curve,auc
import pylab as pl

f1 = []
for i in range(1,40):
    knn = KNeighborsClassifier(n_neighbors = i).fit(x_smote, y_smote)
    ypred = knn.predict(x_test)
    f1.append(metrics.f1_score(y_test, ypred))

plt.figure(figsize=(10,6))
plt.plot(range(1,40),f1,color='blue', linestyle='dashed',
         marker='o',markerfacecolor='red', markersize=10)
plt.title('F1-score vs. K Value')
plt.xlabel('K')
plt.ylabel('F1-score')
print("F1 Maximum:",max(f1),"at K =",f1.index(max(f1))+1)
plt.show()
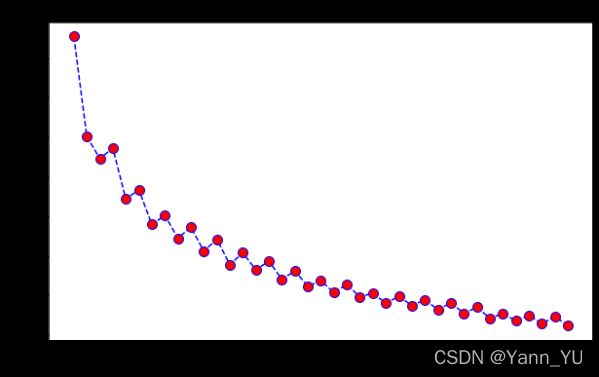
我们也可以计算不同 K 值对应的 Recall 来辅助决定最后使用的 K 值,具体代码如下
recall = []
for i in range(1,40):
    knn = KNeighborsClassifier(n_neighbors = i).fit(x_smote, y_smote)
    ypred = knn.predict(x_test)
    recall.append(metrics.recall_score(y_test, ypred))

import matplotlib.pyplot as plt
plt.figure(figsize=(10,6))
plt.plot(range(1,40),recall,color='blue', linestyle='dashed',
         marker='o',markerfacecolor='red', markersize=10)
plt.title('Recall-score vs. K Value')
plt.xlabel('K')
plt.ylabel('Recall-score')
print("Recall Maximum:",max(recall),"at K =",recall.index(max(recall))+1)
plt.show()
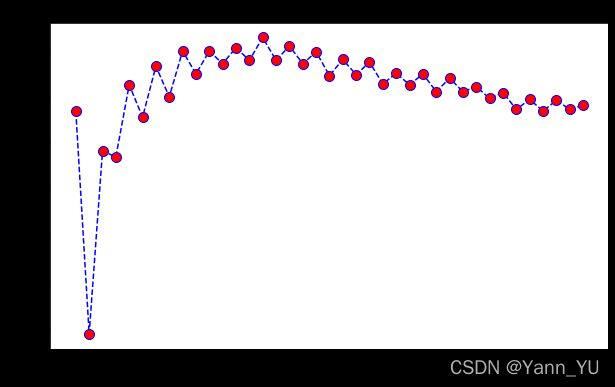
这里由于ROC 并不能很好地帮助我们评估模型,因此我们可以不计算ROC
5. 模型选择与结论
(由于篇幅问题,使用随机森林、神经网络模型对该数据集进行预测的部分将放到下一篇文章中具体演示。)
基于6种机器学习模型的表现,我们可以得出几个结论。
- 回归模型难以精准捕捉年龄等数值变量中蕴含的全部信息,但总体来说表现不错,可以用来分析每个变量对预测具体的影响方向和影响程度,并且可以作用基准模型。
- 神经网络模型容易过拟合,需要系统性地调参。
- 另一方面,决策树模型能够更好地利用这些数值变量来解决分类问题。例如,年龄是预测客户是否购买存款产品的重要特征。这证实了我们最初的观察,即 17-24 岁和 50 岁以上年龄段的订阅率更高。这也是相对比较符合现实的,因为外国的中年人大部分有孩子需要抚养、抵押贷款等需要支付,所以他们可能手头上的现金较少。
- 如果使用 F1-score 以及 Recall 作为评估标准,我们将使用随机森林和逻辑回归进行预测,
通过使用合适的机器学习模型,我们可以在营销活动开始前就瞄准锁定合适的客户,这有助于节省银行的时间和人力成本,并且提高利润。

