python信用卡欺诈检(数据清洗,数据分析,数学建模, 模型预测和比较)
导入工具包
# Numpy,Pandas
import numpy as np
import pandas as pd
import datetime as datetime

# matplotlib
import matplotlib.pyplot as plt
import matplotlib.gridspec as gridspec
import seaborn as sns
import missingno as msno
%matplotlib inline
plt.rcParams['font.sans-serif'] = ['SimHei']
导入数据,查看数据
data = pd.read_csv(r'creditcard.csv')
print(data.shape)
print(data.dtypes)
data.head()
查看是否有缺失值或异常值
print(data.isnull().sum())
print(data .describe())
msno.matrix(data)
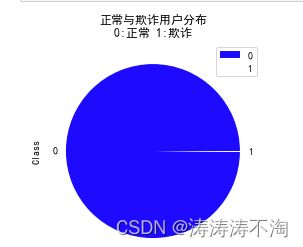
看看欺诈交易与正常交易的数据量对比
label_distr=pd.value_counts(data['Class'],sort=True).sort_index()
# 统计欺诈与正常交易的总数
label_distr.value_counts()
#绘制饼图
label_distr.plot.pie(legend='True',colors=['b','w'],
                 title='正常与欺诈用户分布\n0:正常 1:欺诈')
# plt.savefig('ch17_01.png',dpi=300,bbox_inches='tight')
plt.show()
对欺诈交易金额进行分析,查看欺诈交易金额呈现什么规律
print('Fraud')
print(data.Amount[data.Class ==1].describe())
print('-------')
print('Normal')
print(data.Amount[data.Class ==0].describe())
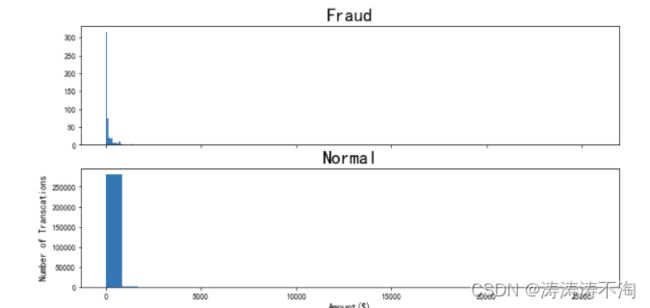
查看信用卡交易金额的分布情况
f,(ax3,ax4) = plt.subplots(2,1,sharex=True,figsize=(12,6))
bins = 30

ax3.hist(data.Amount[data.Class==1], bins=bins)
ax3.set_title("Fraud",fontsize = 23)

ax4.hist(data.Amount[data.Class==0], bins=bins)
ax4.set_title("Normal",fontsize = 23)

plt.xlabel("Amount($)",fontsize = 12)
plt.ylabel("Number of Transcations",fontsize = 12)

plt.show()
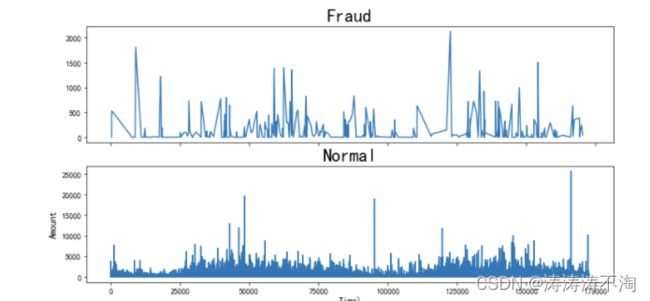
查看信用卡交易金额随之间变化如何分布
f,(ax5,ax6) = plt.subplots(2,1,sharex=True,figsize=(12,6))


ax5.plot(data.Time[data.Class==1],data.Amount[data.Class == 1])
ax5.set_title("Fraud",fontsize = 23)

ax6.plot(data.Time[data.Class==0],data.Amount[data.Class == 0])
ax6.set_title("Normal",fontsize = 23)

plt.xlabel("Time)",fontsize = 12)
plt.ylabel("Amount",fontsize = 12)

plt.show()
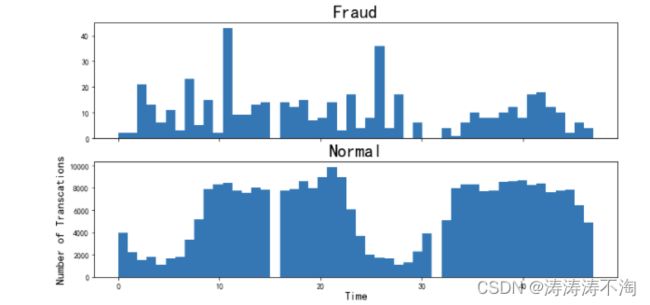
将时间转换为小时,并查看信用卡交易的时间分布情况
data['Time'] = data['Time'].apply(lambda x:divmod(x,3600)[0])
f,(ax3,ax4) = plt.subplots(2,1,sharex=True,figsize=(12,6))
bins = 50

ax3.hist(data.Time[data.Class==1], bins=bins)
ax3.set_title("Fraud",fontsize = 23)

ax4.hist(data.Time[data.Class==0], bins=bins)
ax4.set_title("Normal",fontsize = 23)

plt.xlabel("Time",fontsize = 15)
plt.ylabel("Number of Transcations",fontsize = 15)

plt.show()
查看各变量之间的相关性
corr = data.corr()
print(corr)
print(corr['Class'])
data_V = data.iloc[:,1:29]
Correlation = data_V.corr()
sns.heatmap(Correlation,cmap='coolwarm',square=True,center=0)
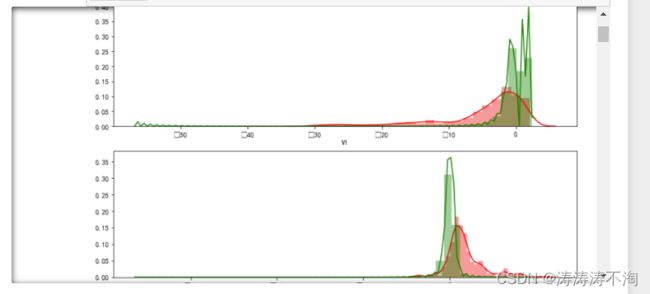
分别对各个特征进行可视化,筛选贡献率相对较高的特征。
v_features = data.iloc[:,1:29].columns #选择V1-V28所有变量字段
#print(,v_features,data[v_features])
gs = gridspec.GridSpec(28,1) #设置子图的布局
#print(gs)
plt.figure(figsize=(12,4*28))
for i,j in enumerate(data[v_features]): #在同时需要index和value值的时候可以使用 enumerate
    ax = plt.subplot(gs[i])
    sns.distplot(data[j][data.Class == 1],color='red')
    sns.distplot(data[j][data.Class == 0],color='green')

plt.show()
V6,V8,V13,V20,V22,V23,V24,V25,V26在两种类别中的分布非常相似,而相似的分布形状,则意味着该特征对于最后的预测结果的影响不大,故将其删去
数据标准化
from sklearn.preprocessing import StandardScaler #标准化模块

data['normAmount'] = StandardScaler().fit_transform(data.Amount.values.reshape(-1, 1))
data = data.drop(['Time','Amount'],axis=1)  #删除不需要的列
# 删除关系不大的'V6','V8','V13','V20','V22','V23','V24','V25','V26'
data = data.drop(['V6','V8','V13','V20','V22','V23','V24','V25','V26'],axis=1)
data.head()
下采样
X = data.iloc[:, data.columns != 'Class'] #特征数据
y = data.iloc[:, data.columns == 'Class'] #标签数据

number_records_fraud = len(data[data.Class == 1])     #异常样本数量
fraud_indices = data[data.Class == 1].index           #得到所有异常样本的索引
normal_indices = data[data.Class == 0].index          #得到所有正常样本的索引

# 在正常样本中随机采样
random_normal_indices = np.random.choice(normal_indices, number_records_fraud, replace = False)

# 根据索引得到下采样所有样本
under_sample_data = data.iloc[np.concatenate([fraud_indices,random_normal_indices]),:]
X_undersample = under_sample_data.iloc[:, under_sample_data.columns != 'Class']  #特征数据
y_undersample = under_sample_data.iloc[:, under_sample_data.columns == 'Class']  #标签数据

pd.value_counts(under_sample_data['Class'], sort = True) #观察数据
划分数据集
from sklearn.model_selection import train_test_split

# 对原始数据集进行划分
X_train, X_test, y_train, y_test = train_test_split(X,y,test_size = 0.3, random_state = 0)
print(len(X_train))  #原始训练集包含样本数量
print(len(X_test))   #原始测试集包含样本数量


# 对下采样数据集进行划分
X_train_undersample, X_test_undersample, y_train_undersample, y_test_undersample = train_test_split(X_undersample,y_undersample,test_size = 0.3,random_state = 0)
print(len(X_train_undersample))  #下采样训练集包含样本数量
print(len(X_test_undersample))   #下采样测试集包含样本数量
建立模型
from sklearn.linear_model import LogisticRegression
from sklearn.model_selection import KFold
from sklearn.metrics import confusion_matrix,recall_score

def printing_Kfold_scores(x_train_data,y_train_data):
    # k-fold表示K折的交叉验证,会得到两个索引集合: 训练集 = indices[0], 验证集 = indices[1]
    fold = KFold(5,shuffle=False)

    recall_accs = []
    for iteration, indices in enumerate(fold.split(x_train_data)):

        # 实例化算法模型,指定l1正则化
        lr = LogisticRegression(C = 0.01, penalty = 'l1',solver='liblinear')

        # 训练模型,传入的是训练集,所以X和Y的索引都是0
        lr.fit(x_train_data.iloc[indices[0],:],y_train_data.iloc[indices[0],:].values.ravel())

        # 建模后,预测模型结果,这里用的是验证集,索引为1
        y_pred_undersample = lr.predict(x_train_data.iloc[indices[1],:].values)

        # 评估召回率,需要传入真实值和预测值
        recall_acc = round(recall_score(y_train_data.iloc[indices[1],:].values,y_pred_undersample),4)
        recall_accs.append(recall_acc)
        print('第', iteration+1,'次迭代:召回率 = ', recall_acc)

    # 当执行完交叉验证后,计算平均结果
    print('平均召回率 ', round(np.mean(recall_accs),4))

    return None
原始训练集的测试效果
printing_Kfold_scores(X_train,y_train)
经过下采样后的数据集的训练效果
printing_Kfold_scores(X_train_undersample,y_train_undersample)
绘制混淆矩阵
import itertools

def plot_confusion_matrix(cm, classes,title='Confusion matrix',cmap=plt.cm.Blues):
    plt.imshow(cm, interpolation='nearest', cmap=cmap)
    plt.title(title)
    plt.colorbar()
    tick_marks = np.arange(len(classes))
    plt.xticks(tick_marks, classes, rotation=0)
    plt.yticks(tick_marks, classes)

    thresh = cm.max() / 2.
    for i, j in itertools.product(range(cm.shape[0]), range(cm.shape[1])):
        plt.text(j, i, cm[i, j],
                 horizontalalignment="center",
                 color="white" if cm[i, j] > thresh else "black")
    plt.tight_layout()
    plt.ylabel('True label')
    plt.xlabel('Predicted label')

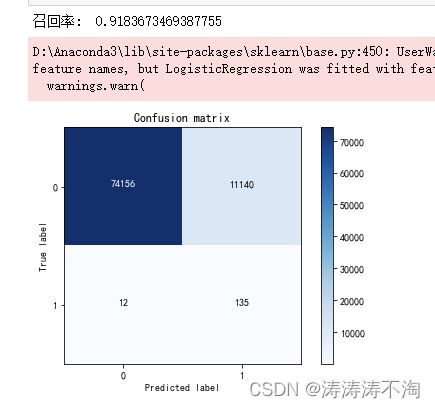
#下采样训练集训练之后,预测原始测试集
lr = LogisticRegression(C = 0.01, penalty = 'l1',solver='liblinear')
lr.fit(X_train_undersample,y_train_undersample.values.ravel())
y_pred = lr.predict(X_test.values)
print("召回率: ", recall_score(y_test.values, y_pred))

# 绘制混淆矩阵
plot_confusion_matrix(confusion_matrix(y_test,y_pred) ,[0,1])
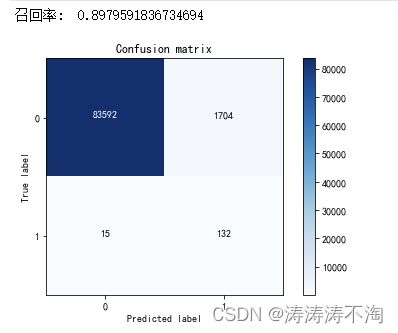
predict_proba自定义阈值
y_pred_proba = lr.predict_proba(X_test.values)
y_classify = y_pred_proba[:,1] > 0.6

print("召回率: ", recall_score(y_test.values, y_classify))
plot_confusion_matrix(confusion_matrix(y_test,y_classify), [0,1])
使用SMOTE算法将训练集中异常数据生成到与正常数据一样多,从345变为199019条,从而解决样本数据不均衡问题
from imblearn.over_sampling import SMOTE
from sklearn.ensemble import RandomForestClassifier

oversampler=SMOTE(random_state=0)
os_data,os_labels=oversampler.fit_resample(X_train,y_train)
pd.value_counts(os_labels.Class)

lr = LogisticRegression(C = 0.01, penalty = 'l1',solver='liblinear')
lr.fit(os_data,os_labels.values.ravel())
os_pred = lr.predict(X_test.values)

print("召回率: ", recall_score(y_test.values, os_pred))
plot_confusion_matrix(confusion_matrix(y_test,os_pred) ,[0,1])
使用SVM分类
from sklearn import svm
s=svm.SVC(kernel='linear')
s.fit(X_train_undersample,y_train_undersample.values.ravel())
y_pred_svm=s.predict(X_test.values)
print("召回率: ", recall_score(y_test.values, y_pred_svm))
plot_confusion_matrix(confusion_matrix(y_test,y_pred_svm) ,[0,1])

