点云分割模型的训练, 基于ROS和Caffe的推理
三维点云目标检测
深度学习三维点云模型推理,
为啥需要学习三维点云, 因为可用很好探测三维空间,特别是自动驾驶领域越来越多,
为啥又需要深度学习三维点云,可以更好的分类,基于SVM等点云分类方法,也许只能达到80%的准确率, 深度学习只会高些;
三维点云目标检测思路之一:
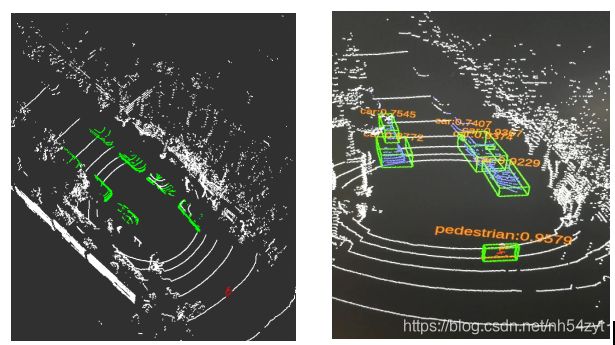
如下图所示,先分割,再聚类,最后进行目标定位

1: apollo分割模型简介
根据apllo3.0的代码 , 分成4步对 Lidar 核心逻辑流程进行叙述。
1.1 坐标及格式转换
Apollo 使用了开源库 Eigen ,使用了 PCL 点云库对点云进行处理,Apollo 首先计算转换矩阵
velodyne_trans,用于将 Velodyne 坐标转化为世界坐标。之后将 Velodyne 点云转为
PCL点云库格式,便于之后的计算。
1.2 获取ROI区域
核心函数位置: obstacle/onboard/hdmap_input.cc
根据 Velodyne 的世界坐标以及预设的半径来获取 ROI
区域。 首先获取指定范围内的道路以及道路交叉点的边界,将两者进行融合后的结果存入 ROI 多边形中。该区域中所有的点都位于世界坐标系。
1.3 调用ROI过滤器
核心函数:
obstacle/lidar/roi_filter/hdmap_roi_filter/hdmap_roi_filter.cc
高精地图 ROI 过滤器处理在ROI之外的激光雷达点,去除背景对象,如路边建筑物和树木等,剩余的点云留待后续处理。
一般来说,Apollo 高精地图 ROI过滤器有以下三步:
1.4 调用分割器 (segmentor)
函数所在文件cnn_segmentation.cc
分割器采用了 caffe 框架的深度完全卷积神经网络(FCNN) 对障碍物进行分割, 简单来说有以下四步:
a. 点云前处理, 通道特征提取
计算以 Lidar 传感器某一范围内的各个单元格 (grid) 中与点有关的8个统计量,将其作为通道特征输入到模型
- 单元格中点的最大高度
- 单元格中最高点的强度
- 单元格中点的平均高度
- 单元格中点的平均强度
- 单元格中的点数
- 单元格中心相对于原点的角度
- 单元格中心与原点之间的距离
- 二进制值标示单元格是空还是被占用
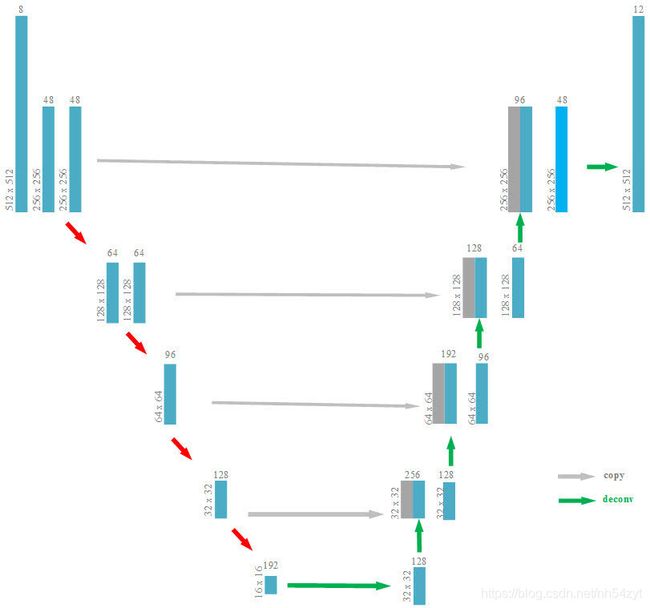
b. 分割模型的结构
c. 障碍聚类及后期处理
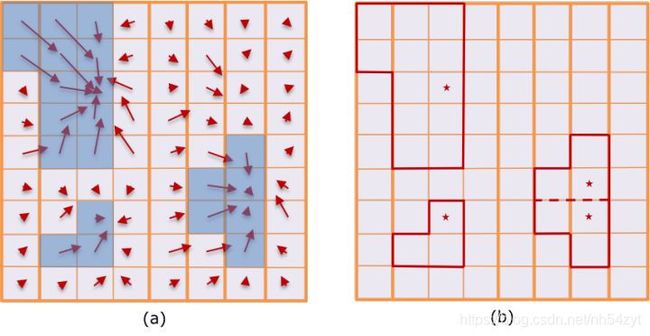
聚类后,Apollo基于单元格中心偏移预测构建有向图,采用压缩的联合查找算法(Union Find algorithm )基于对象性预测有效查找连接组件,构建障碍物集群。根据每个候选群体的检测置信度分数和物体高度,来确定最终输出的障碍物集/分段。
2: apollo分割模型 ROS环境移植
可将代码迁移到ROS环境, 实现和视觉图像的简单融合算法,
同时订阅topic, 进行推理即可
#include
caffe::Blob<float>* output_layer = caffe_net_->output_blobs()[0];
const float* begin = output_layer->cpu_data();
const float* end = begin + output_layer->channels();
std::vector<float> output = std::vector<float>(begin, end);
**************
}
}
int main(int argc, char **argv)
{
ros::init(argc, argv, "rs_localization");
nh = new ros::NodeHandle;
std::string proto_file = "/home/fcn_deploy.prototxt";
std::string weight_file = "/home/lidar_iter_50000.caffemodel";
caffe::Caffe::set_mode(caffe::Caffe::GPU);
caffe::Caffe::SetDevice(gpu_id);
caffe::Caffe::DeviceQuery();
caffe_net_.reset(new caffe::Net<float>(proto_file, caffe::TEST));
caffe_net_->CopyTrainedLayersFrom(weight_file);
feature_blob_ = caffe_net_->blob_by_name("lidar_data");
feature_map_ = new feature_generate(feature_blob_.get());
prob_blob_ = caffe_net_->blob_by_name("prob");
/* Load labels */
std::string label_file = "/home/lidar_perception/src/label.txt";
std::ifstream labels(label_file.c_str());
CHECK(labels) << "Unable to open labels file " << label_file;
std::string line;
while (std::getline(labels, line))
labels_.push_back(string(line));
points_pub = nh->advertise<sensor_msgs::PointCloud2>(pub_points_topic, 1, true);
points_ground_pub = nh->advertise<sensor_msgs::PointCloud2>(pub_ground_points_topic, 1, true);
raw_points_pub = nh->advertise<sensor_msgs::PointCloud2>(pub_raw_points_topic, 1, true);
pub_marker = nh->advertise<visualization_msgs::MarkerArray>(pub_array_topic, 1, true);
ros::Subscriber points_sub;
points_sub = nh->subscribe(sub_points_topic, 10, Callback);
ros::spin();
return 0;
}
3: apollo分割模型 Python环境移植
为了能够契合KITTI数据集,
Python代码读取bin文件进行推理
import caffe
import numpy as np
import os
import sys
import glob
import math
import struct
import time
import cv2
root=root='/home/caffe/seg_models/'
deploy=root + 'test/seg_deploy.prototxt'
caffe_model=root + 'test/weight_iter_4000.caffemodel'
bin_test= '/home/seg_data/points_label/2_label.bin'
net = caffe.Net(deploy,caffe_model,caffe.TEST)
height = 640
width = 320
height_range = 60
width_range = 30
out_blob = np.zeros((8, height, width))
mask_point = np.zeros((height,width))
label = np.zeros((height,width))
def bin2feature(name,height,width,mask_point,label):
		raw_lidar = []
raw_lidar.append(np.fromfile(name,dtype=np.float32).reshape((-1,5)))
		point_cloud = raw_lidar[-1]
		#print 'point_cloud',point_cloud
		#print 'point_cloud.shape',point_cloud.shape
   		siz = height * width;
   		out_blob = np.zeros((8, height, width))
		label_data = np.zeros(height*width)
		for h in range(height*width):
			label_data[h] = int(0.0)
		#print  'point_cloud', point_cloud
		direction_data = np.zeros(height*width)
		distance_data = np.zeros(height*width)
		for row in range(height):
   			 for col in range(width):

				*******
				*******
				*******

		out_blob[0,:,:] = max_height_data
		out_blob[1,:,:] = mean_height_data
		out_blob[2,:,:] = count_data
		out_blob[3,:,:] = direction_data
		out_blob[4,:,:] = top_intensity_data
		out_blob[5,:,:] = mean_intensity_data
		#print 'out_blob 6',out_blob
		out_blob[6,:,:] = distance_data
		out_blob[7,:,:] = nonempty_data
		return out_blob,mask_point,label

out_blob,mask_point,label = bin2feature(bin_test,height,width,mask_point,label)

print 'out_blob',out_blob

net.blobs['data'].data[...] = out_blob
out = net.forward()
prob= net.blobs['prob'].data
print 'prob',prob

elapsed = (time.clock()-start)

label_colours = cv2.imread('/home/caffe/seg_models/test/point8.png', 1).astype(np.uint8)

prediction = net.blobs['deconv0'].data[0].argmax(axis=0)
prob_mask = prediction*36*mask_point
prediction_result = prob_mask.reshape(1,640*320)
a=prediction_result[0]
cv2.imwrite("prediction.png", prob_mask)
prediction = np.squeeze(prediction)
prediction = np.resize(prediction, (3, height, width))
prediction = prediction.transpose(1, 2, 0).astype(np.uint8)
******
prob = net.blobs['deconv0'].data[0]
order=prob.argsort()[::-1][:3]
print "top 3: ",prob[order[0]],prob[order[1]],prob[order[2]]
测试prototxt如下:
name: "test"
layer {
  name: "input"
  type: "Input"
  top: "lidar_data"
  input_param {
    shape {
      dim: 1
      dim: 6
      dim: 64
      dim: 32
    }
  }
}
layer {
  name: "conv0_1_6"
  type: "Convolution"
  bottom: "lidar_data"
  top: "conv0_1"
  convolution_param {
    num_output: 24
    bias_term: true
    pad: 0
    kernel_size: 1
    stride: 1
    weight_filler {
      type: "xavier"
    }
    bias_filler {
      type: "constant"
      value: 0.0
    }
  }
}
layer {
  name: "relu_conv0_1"
  type: "ReLU"
  bottom: "conv0_1"
  top: "conv0_1"
}
layer {
  name: "conv0"
  type: "Convolution"
以上已经对apollo模型的推理进行了解读, 可用无缝衔接到ROS环境, C++环境.Python环境
4: apollo分割模型的Caffe环境训练
a.数据集准备
可用按照kitti数据集,将每帧数据转换为bin文件
每个bin文件格式,存放点云数据个数如下
例如:x,y,z,intensity,label,x,y,z,intensity,label,x,y…
栅格化处理几乎不耗时,能够快速的将三维点云信息降维二维的信息。因此,如图所示,可以统计每个栅格内的最小高度值,最大高度值,最大反射强度,平均反射强度,点云个数等栅格内的点云统计信息。
思路如上,
那么Caffe如何实现,直接自定义一个特征输入层,
为了操作方便,可用将label转换为分割模型的图片,
这样可用完整的一一对应,完美利用图像语义分割领域的转换
import numpy as np
import os
import sys
import glob
import math
import struct
import cv2
#import pcl
from PIL import Image
import time
from collections import defaultdict

data = open('/home/train_seg.txt').read().strip().split("\n")
raw_lidar,point_cloud = [],[]
height_ = 640
width_ = 640
height_range_ = 60
width_range_= 60
siz = height_ * width_;
out_blob = np.zeros((8, height_, width_))
******
******
label_data = np.zeros(height_*width_)
for h in range(height_*width_):
	label_data[h] = int(8.0)
siz = height_ * width_

for i in range(len(data)):
   print 'i=',i
   line_bin=data[i]
   print 'line_bin',line_bin
   raw_lidar.append(np.fromfile(line_bin,dtype=np.float32).reshape((-1,5)))
   point_cloud = raw_lidar[-1]
   label_data = np.zeros(height_*width_)
   for h in range(height_*width_):
	   label_data[h] = int(8.0)
   inv_res_x = float(0.5 * width_ / width_range_)
   inv_res_y = float(0.5 * height_ / height_range_)
   map_idx = np.zeros(len(point_cloud))

   start = time.clock()
   label_num_data = defaultdict(list)

   for j in range(len(point_cloud)):
		if (point_cloud[j,2] <= -3.0 or point_cloud[j,2] >= 3.0):
			map_idx[j] =-1
			continue
		pos_x = int(math.floor((width_range_ -  point_cloud[j,1]) * inv_res_x))
		pos_y = int(math.floor((height_range_ -  point_cloud[j,0]) * inv_res_y))
		if (pos_x >= width_ or pos_x<0 or pos_y >= height_ or pos_y < 0):
			map_idx[j] = -1
            *******
		    *******
			label_data [k] = int(max(set(num_max_label),key=num_max_label.count))

   filename = '/home/fcnn_labels/'+str(i)+'_aug.png'
   print 'filename',filename
   label_data = label_data.reshape(height_,width_)
   cv2.imwrite(filename, label_data)
如下图, 简单展示了,对应三维点云俯视图,以及对应的三维点云label俯视图
b. 分割模型的设计
类似如下的网络格式, Caffe网络配置文件很容易实现
如下所示, 实现一个训练的 prototxt文件:
name: "lidar_kitti"
layer {
  name: "lidar"
  type: "Python"
  top: "lidar_data"
  top: "label_data"
  include {
    phase: TRAIN
  }
  python_param {
    module: "lidar_data_layer"
    layer: "LidarDataLayer"
    param_str: "{}"
  }
}
layer {
  name: "lidar"
  type: "Python"
  top: "lidar_data"
  top: "label_data"
  include {
    phase: TEST
  }
  python_param {
    module: "lidar_data_layer"
    layer: "LidarDataLayer"
    param_str: "{}"
  }
}

layer {
  name: "conv0_1_6"
  type: "Convolution"
  bottom: "lidar_data"
  top: "conv0_1"
  convolution_param {
其中自定义层的代码如下:
import caffe
import numpy as np
from random import shuffle
import cPickle as cp
from skimage import io, transform
import cv2
import math
import sys
import time

class LidarDataLayer(caffe.Layer):

	"""
	training a LidarDataLayer
	"""

	def setup(self, bottom, top):

		self.top_names = ['data' , 'label_data']
		self.phase = params['phase']
		self.batch_size = params['batch_size']
		# Create a batch loader to load the images.
		self.batch_loader = BatchLoader(params, None)
		top[0].reshape(
			self.batch_size, 6, params['height'], params['width'])
		top[1].reshape(self.batch_size, 1)
		print "PythonDataLayer init success", params

	def forward(self, bottom, top):
		"""
		Load data.
		"""

	def reshape(self, bottom, top):
		pass

	def backward(self, top, propagate_down, bottom):
		pass

class BatchLoader(object):
	def __init__(self, params, result):
		self.result = result
		self.batch_size = params['batch_size']
		self.height = params['height']
		self.width = params['width']
		self.is_train = (params['phase']=='TRAIN')
除去非点云的栅格,还是存在大量的背景点云的栅格,较多的轿车点云的栅格以及其他类别点云的栅格,单帧点云数据中类别不平衡以及数据集中类别不平衡性非常严重。因此,必须针对类别的不平衡性进行损失函数的优化。
因此,可以直接使用一些数据平衡的方法;
自训练分割模型及聚类效果
本次方法是基于Apollo3.0 分割模型进行复现,
如需要完整python模型训练代码,
可留言沟通,一起交流学习,
谢谢!
后续分析点云检测模型,
可查看Apollo6.0, 如何训练,
及TensorRT,和ROS环境的部署.
https://blog.csdn.net/nh54zyt/article/details/110674472


