机器学习极简入门笔记-3-有监督学习进阶-SVM、SVR直观理解
目录
14.1 SVM实例
14.1.1 线性可分SVM
14.1.2 线性SVM
14.1.3 完全线性不可分的数据
14.2 SVR实例
14.1 SVM实例
14.1.1 线性可分SVM
import numpy as np
import matplotlib.pyplot as plt
from sklearn.svm import SVC # "Support vector classifier"

# 定义函数plot_svc_decision_function用于绘制分割超平面和其两侧的辅助超平面
def plot_svc_decision_function(model, ax=None, plot_support=True):
    """Plot the decision function for a 2D SVC"""
    if ax is None:
        ax = plt.gca()
    xlim = ax.get_xlim()
    ylim = ax.get_ylim()

    # 创建网格用于评价模型
    x = np.linspace(xlim[0], xlim[1], 30)
    y = np.linspace(ylim[0], ylim[1], 30)
    Y, X = np.meshgrid(y, x)
    xy = np.vstack([X.ravel(), Y.ravel()]).T
    P = model.decision_function(xy).reshape(X.shape)

    # 绘制超平面
    ax.contour(X, Y, P, colors='k',
                   levels=[-1, 0, 1], alpha=0.5,
                   linestyles=['--', '-', '--'])

    # 标识出支持向量
    if plot_support:
        ax.scatter(model.support_vectors_[:, 0],
                       model.support_vectors_[:, 1],
                       s=300, linewidth=1,  edgecolors='blue', facecolors='none');
    ax.set_xlim(xlim)
    ax.set_ylim(ylim)

# 用make_blobs生成样本数据
from sklearn.datasets import make_blobs
X, y = make_blobs(n_samples=50, centers=2,
                      random_state=0, cluster_std=0.60)

# 将样本数据绘制在直角坐标中
plt.scatter(X[:, 0], X[:, 1], c=y, s=50, cmap='autumn');
plt.show()

# 用线性核函数的SVM来对样本进行分类
model = SVC(kernel='linear')
model.fit(X, y)

# 在直角坐标中绘制出分割超平面、辅助超平面和支持向量
plt.scatter(X[:, 0], X[:, 1], c=y, s=50, cmap='autumn')
plot_svc_decision_function(model);
plt.show()
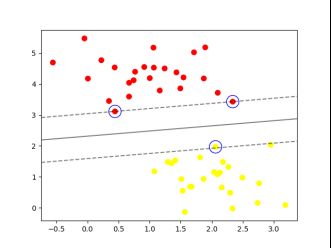
运行结果如下图所示
14.1.2 线性SVM
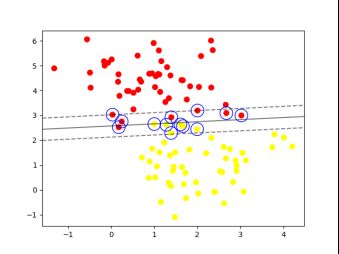
对线性可分的代码进行一点改动,生成一些需要软间隔处理的数据
将原代码中的
# 用make_blobs生成样本数据

X, y = make_blobs(n_samples=50, centers=2, random_state=0, cluster_std=0.60)
改为
X, y = make_blobs(n_samples=100,centers=2, random_state=0, cluster_std=0.9)我们加大惩罚系数C试试
在原代码此处
# 用线性核函数的SVM来对样本进行分类

model = SVC(kernel='linear')
改为
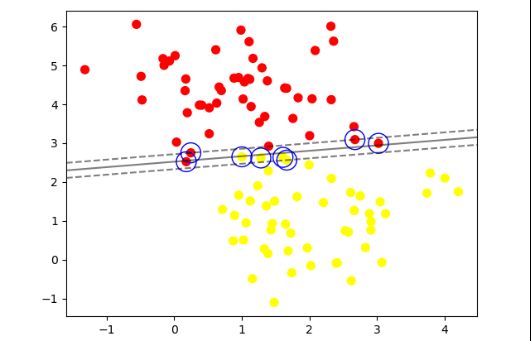
model = SVC(kernel='linear', C=10.0)运行结果变为
14.1.3 完全线性不可分的数据
我们这样生成数据
rom sklearn.datasets.samples_generator import make_circles
X,y=make_circles(100,factor=.1, noise=.1)
如果强行试图线性分隔会怎样?
我们使用RBF核试试
model = SVC(kernel='rbf')运行结果如下
我们尝试调高一点惩罚系数
14.2 SVR实例
import numpy as np
from sklearn.svm import SVR
import matplotlib.pyplot as plt

# 生成样本数据
X = np.sort(5 * np.random.rand(40, 1), axis=0)
y = np.ravel(2*X + 3)

# 加入部分噪声
y[::5] += 3 * (0.5 - np.random.rand(8))

# 调用模型
svr_rbf = SVR(kernel='rbf', C=1e3, gamma=0.1)
svr_lin = SVR(kernel='linear', C=1e3)
svr_poly = SVR(kernel='poly', C=1e3, degree=2)
y_rbf = svr_rbf.fit(X, y).predict(X)
y_lin = svr_lin.fit(X, y).predict(X)
y_poly = svr_poly.fit(X, y).predict(X)

# 可视化结果
lw = 2
plt.scatter(X, y, color='darkorange', label='data')
plt.plot(X, y_rbf, color='navy', lw=lw, label='RBF model')
plt.plot(X, y_lin, color='c', lw=lw, label='Linear model')
plt.plot(X, y_poly, color='cornflowerblue', lw=lw, label='Polynomial model')
plt.xlabel('data')
plt.ylabel('target')
plt.title('Support Vector Regression')
plt.legend()
plt.show()
运行结果如下


