江南大学《机器学习》大作业-人脸图像性别分类-Python代码实现
大报告见:https://blog.csdn.net/jty123456/article/details/109733826
代码开源库见:https://github.com/0Kirby/GenderRecognition
人脸图像性别分类
本实验将训练一个神经网络模型,对男女人脸图像进行性别分类。
本实验使用了 tf.keras,它是 TensorFlow 中用来构建和训练模型的高级 API。
导入需要用到的库
| 名称 | 版本 | 用途 |
|---|---|---|
| Tensorflow | 2.3.1 | 深度学习框架 |
| Keras | 2.4.3 | 基于Tensorflow的实现 |
| scikit-learn | 0.32.2 | 机器学习库 |
| matplotlib | 3.3.2 | 绘图库 |
| pandas | 1.1.3 | 数据处理库 |
| numpy | 1.19.2 | 矩阵库 |
| opencv-Python | 4.4.0.44 | 读取图片 |
# TensorFlow
import tensorflow as tf
from tensorflow import keras
from sklearn.model_selection import train_test_split
import matplotlib.pyplot as plt

# Helper libraries
from pandas import read_csv
import numpy as np
import pandas as pd
import cv2
import random

print(tf.__version__)
2.3.1
导入训练集和预处理数据
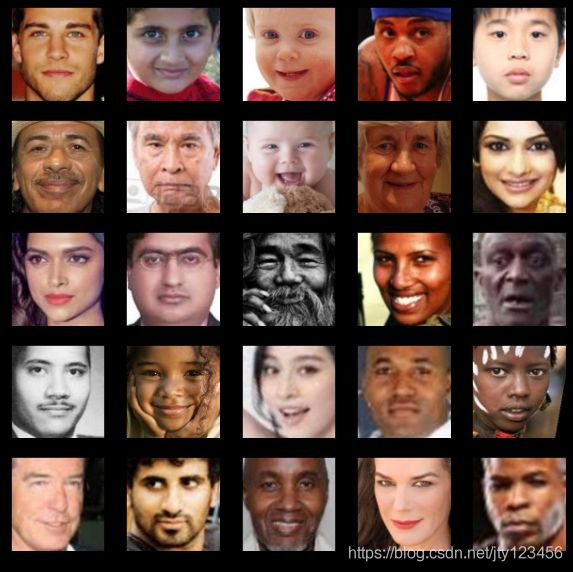
本实验使用 UTKFace 中的部分数据作为数据集,包括18000张包含标签的图片作为训练集,剩余5708张图片作为测试集。
我们首先使用一个空白的列表用于存储图片,设定图片压缩后的长宽为100,指定训练集图片的路径。
注: Windows下遍历文件名的方式并不是按照 “1.jpg、2.jpg、3.jpg、4.jpg、5.jpg…” 从小到大的自然顺序,而是按照 “1.jpg、10.jpg、100.jpg、1000.jpg、10000.jpg、10001.jpg” 的顺序。因此如果直接使用os库中遍历文件夹下所有文件路径的方法,会导致图片与标签对应错误。所以我们最好的方式是使用循环,再通过拼接字符串的方式 (.jpg) 得到完整的文件名。
由于opencv读取图片是按照BGR通道进行读取的,我们需要转换成RGB才能得到正常的图片。再将每张图片除以255.0进行归一化处理。然后将图片压缩到指定的大小,并把所有图片放进一个列表中。
为了检验我们的操作结果,需要进行数据可视化。使用matplotlib库,创建一个图框,随机显示读取到的一张图片。
dataframe = read_csv('train.csv')
array_of_img = []  # this if for store all of the image data
image_size = 100
directory_name = "train/train/"
for i in dataframe.values[:, 0]:
    # print(filename) #just for test
    # img is used to store the image data
    # img = cv2.imread(directory_name + str(i) + ".jpg", cv2.IMREAD_GRAYSCALE)
    img = cv2.imread(directory_name + str(i) + ".jpg")
    # img = cv2.cvtColor(img, cv2.COLOR_BGR2RGB) #change channels from BGR to RGB
    img = img / 255.0
    img = cv2.resize(img, (image_size, image_size))
    array_of_img.append(img)
train_images = np.array(array_of_img)
array_of_img = []

# train_images = train_images.reshape(train_images.shape[0], image_size, image_size, 1)
# train_images = train_images.astype('float32')
sample = random.randint(0, 17992)
plt.figure()
plt.imshow(train_images[sample][:,:,::-1])
plt.colorbar()
plt.grid(False)
plt.show()
读取csv
使用pandas库中的read_csv方法读取train.csv文件,并显示出其中前10行数据。其中标签0表示男,1表示女。
dataframe.head(10)
| id | label | |
|---|---|---|
| 0 | 1 | 0 |
| 1 | 2 | 0 |
| 2 | 3 | 1 |
| 3 | 4 | 1 |
| 4 | 5 | 1 |
| 5 | 6 | 1 |
| 6 | 7 | 1 |
| 7 | 8 | 1 |
| 8 | 9 | 1 |
| 9 | 10 | 0 |
在这里我们仅需要标识男女的0、1标签,因此取数据的第一列。
为了压缩空间,将默认保存的int64类型转换为int8类型进行保存。最后释放掉不需要的dataframe和array变量。
array = dataframe.values
train_labels = np.array(array[:, 1], dtype='int8')
del dataframe
del array
数据增强
创建一个数据增强层,使用keras中的顺序模型来创建,其中包括五层,分别是:
- 高斯噪声
- 随机翻转(水平)
- 随机变形
- 随机旋转
- 随机缩放
data_augmentation = keras.Sequential(
    [
        keras.layers.GaussianNoise(0.1, input_shape=(image_size, image_size, 3)),
        keras.layers.experimental.preprocessing.RandomFlip("horizontal"),
        keras.layers.experimental.preprocessing.RandomTranslation(0.1, 0.1),
        keras.layers.experimental.preprocessing.RandomRotation(0.1),
        keras.layers.experimental.preprocessing.RandomZoom(0.1),
    ]
)
现在我们显示经过数据增强后的刚才那张图片:
plt.figure(figsize=(10, 10))
for i in range(9):
    temp = train_images[sample:sample+1]
    augmented_images = data_augmentation(temp)
    ax = plt.subplot(3, 3, i + 1)
    plt.grid(False)
    plt.xticks([])
    plt.yticks([])
    plt.imshow(augmented_images[0][:,:,::-1])
train_images和train_labels数组是训练集,即模型用于学习的数据。test_images和test_labels数组是测试集、会被用来对模型进行测试。
图像是 100x100 的 NumPy 数组,像素值介于 0 到 1 之间。标签是整数数组,介于 0 到 1 之间。这些标签对应于图像所代表的性别类:
| 标签 | 类别 |
|---|---|
| 0 | 男性 |
| 1 | 女性 |
每个图像都会被映射到一个标签。由于数据集不包括类名称,所以将它们存储在下方,供稍后绘制图像时使用:
class_names = ['male', 'female']
浏览数据
在训练模型之前,我们先浏览一下数据集的格式。以下代码显示训练集中有 17993(去除7张非人脸图片) 个图像,每个图像由 100 x 100 的像素表示,包含3个通道:
train_images.shape
(17993, 100, 100, 3)
同样,训练集中有 17993 个标签:
len(train_labels)
17993
每个标签都是一个 0或1 的整数:
train_labels
array([0, 0, 1, …, 1, 1, 1], dtype=int8)
为了验证数据的格式是否正确,以及您是否已准备好构建和训练网络,让我们显示训练集中的随机 25 个图像,并在每个图像下方显示类名称。
plt.figure(figsize=(10,10))
for i in range(25):
    plt.subplot(5,5,i+1)
    plt.xticks([])
    plt.yticks([])
    plt.grid(False)
    sample = random.randint(0, 17992)
    plt.imshow(train_images[sample][:,:,::-1])
    plt.xlabel(class_names[train_labels[sample]])
plt.show()
构建模型
构建神经网络需要先配置模型的层,然后再编译模型。
设置层
神经网络的基本组成部分是层。层会从向其馈送的数据中提取表示形式。希望这些表示形式有助于解决手头上的问题。
大多数深度学习都包括将简单的层链接在一起。大多数层(如 tf.keras.layers.Dense)都具有在训练期间才会学习的参数。
model = keras.Sequential([
    data_augmentation,
    keras.layers.Conv2D(25, kernel_size=(3, 3), padding='same', activation='relu'),
    keras.layers.Conv2D(50, kernel_size=(3, 3), padding='same', activation='relu'),
    keras.layers.BatchNormalization(),
    keras.layers.MaxPooling2D(),
    keras.layers.Dropout(0.2),
    keras.layers.Conv2D(50, kernel_size=(3, 3), padding='same', activation='relu'),
    keras.layers.Conv2D(100, kernel_size=(3, 3), padding='same', activation='relu'),
    keras.layers.BatchNormalization(),
    keras.layers.MaxPooling2D(),
    keras.layers.Dropout(0.2),
    keras.layers.Conv2D(100, kernel_size=(3, 3), padding='same', activation='relu'),
    keras.layers.Conv2D(200, kernel_size=(3, 3), padding='same', activation='relu'),
    keras.layers.BatchNormalization(),
    keras.layers.MaxPooling2D(),
    keras.layers.Dropout(0.2),
    keras.layers.Flatten(),
    keras.layers.Dense(50, activation='relu'),
    keras.layers.BatchNormalization(),
    keras.layers.Dropout(0.2),
    keras.layers.Dense(100, activation='relu'),
    keras.layers.BatchNormalization(),
    keras.layers.Dense(200, activation='relu'),
    keras.layers.BatchNormalization(),
    keras.layers.Dropout(0.2),
    keras.layers.Dense(2, activation='softmax')
])
首先是我们刚才定义的 数据增强层 ,然后是两个的相连的 卷积层 ,神经元分别为25和50,卷积核大小均为3x3;
再加上 批次标准化层 、 最大池化层 和失活率为0.2的 Dropout层 ;
以同样的方式再添加两遍和上述相同的层,只不过卷积层的神经元个数分别为50、100、100和200;
完成所有的卷积操作后,便来到了 展平层 ,将最后一个卷积层的输出12x12x200展平成28800x1;
随后我们添加3个 全连接层 ,神经元个数分别为50、100和200,并在它们之间插入 批次标准化层 和失活率为0.2的 Dropout层;
最后的 输出层 不变仍为两个神经元,用Softmax函数优化,而 卷积层 均用ReLu函数优化。
编译模型
在准备对模型进行训练之前,还需要再对其进行一些设置。以下内容是在模型的编译步骤中添加的:
- 损失函数 - 用于测量模型在训练期间的准确率。希望最小化此函数,以便将模型“引导”到正确的方向上。
- 优化器 - 决定模型如何根据其看到的数据和自身的损失函数进行更新。
- 指标 - 用于监控训练和测试步骤。以下示例使用了准确率,即被正确分类的图像的比率。
model.compile(optimizer='adam',
              loss=tf.keras.losses.SparseCategoricalCrossentropy(),
              metrics=['accuracy']
              )
model.summary()
Model: "sequential_1"
_________________________________________________________________
Layer (type)                 Output Shape              Param #
=================================================================
sequential (Sequential)      (None, 100, 100, 3)       0
_________________________________________________________________
conv2d (Conv2D)              (None, 100, 100, 25)      700
_________________________________________________________________
conv2d_1 (Conv2D)            (None, 100, 100, 50)      11300
_________________________________________________________________
batch_normalization (BatchNo (None, 100, 100, 50)      200
_________________________________________________________________
max_pooling2d (MaxPooling2D) (None, 50, 50, 50)        0
_________________________________________________________________
dropout (Dropout)            (None, 50, 50, 50)        0
_________________________________________________________________
conv2d_2 (Conv2D)            (None, 50, 50, 50)        22550
_________________________________________________________________
conv2d_3 (Conv2D)            (None, 50, 50, 100)       45100
_________________________________________________________________
batch_normalization_1 (Batch (None, 50, 50, 100)       400
_________________________________________________________________
max_pooling2d_1 (MaxPooling2 (None, 25, 25, 100)       0
_________________________________________________________________
dropout_1 (Dropout)          (None, 25, 25, 100)       0
_________________________________________________________________
conv2d_4 (Conv2D)            (None, 25, 25, 100)       90100
_________________________________________________________________
conv2d_5 (Conv2D)            (None, 25, 25, 200)       180200
_________________________________________________________________
batch_normalization_2 (Batch (None, 25, 25, 200)       800
_________________________________________________________________
max_pooling2d_2 (MaxPooling2 (None, 12, 12, 200)       0
_________________________________________________________________
dropout_2 (Dropout)          (None, 12, 12, 200)       0
_________________________________________________________________
flatten (Flatten)            (None, 28800)             0
_________________________________________________________________
dense (Dense)                (None, 50)                1440050
_________________________________________________________________
batch_normalization_3 (Batch (None, 50)                200
_________________________________________________________________
dropout_3 (Dropout)          (None, 50)                0
_________________________________________________________________
dense_1 (Dense)              (None, 100)               5100
_________________________________________________________________
batch_normalization_4 (Batch (None, 100)               400
_________________________________________________________________
dense_2 (Dense)              (None, 200)               20200
_________________________________________________________________
batch_normalization_5 (Batch (None, 200)               800
_________________________________________________________________
dropout_4 (Dropout)          (None, 200)               0
_________________________________________________________________
dense_3 (Dense)              (None, 2)                 402
=================================================================
Total params: 1,818,502
Trainable params: 1,817,102
Non-trainable params: 1,400
_________________________________________________________________
训练模型
训练神经网络模型需要执行以下步骤:
- 将训练数据馈送给模型。在本例中,训练数据位于
train_images和train_labels数组中。 - 模型学习将图像和标签关联起来。
- 要求模型对测试集(在本例中为
test_images数组)进行预测。
准备工作
使用scikit-learn库中的train_test_split从训练集中划分出*90%的图片训练,而剩余10%*的图片作为验证集实时跟踪训练的效果。
我们添加3个回调:
- ModelCheckpoint:使用val_accuracy(验证集精度)是否提升作为指标,一旦有提升则立刻保存当前训练的权重,从而能在所有训练轮数中保存与验证集最贴切的模型;
- ReduceLROnPlateau:使用val_loss(验证集误差)是否降低作为指标,如果在3个训练轮数后没有降低,则降低学习率0.0001,可以让模型更加容易接近局部最优减少震荡;
- EarlyStopping:使用val_loss(验证集误差)是否降低作为指标,如果在50个训练轮数后没有降低,则立即停止训练,从而避免因模型拟合而造成不必要的资源浪费。
X_train, X_val, Y_train, Y_val = train_test_split(train_images, train_labels, test_size=0.1, random_state=3)
del train_images
del train_labels

save_weights = 'save_weights.h5'
last_weights = 'last_weights.h5'
best_weights = 'best_weights.h5'
# model.load_weights(best_weights)

checkpoint = keras.callbacks.ModelCheckpoint(best_weights, monitor='val_accuracy', save_best_only=True, mode='max',
                                             verbose=1)
reduce = keras.callbacks.ReduceLROnPlateau(monitor='val_loss', factor=0.1, patience=3, verbose=0, mode='auto',
                                           min_delta=0.0001, cooldown=0, min_lr=0)
earlyStopping = keras.callbacks.EarlyStopping(monitor='val_loss', patience=50, verbose=1, mode='auto')
callbacks = [checkpoint]
向模型馈送数据
要开始训练,调用 model.fit 方法,这样命名是因为该方法会将模型与训练数据进行“拟合”,并将训练中的信息保存在 hist 中。
训练集为 X_train 、标签为 Y_train 、轮数为2000、验证集为 X_val 、标签为 Y_val。
将最后一轮训练好的权重保存到 last_weights 中。
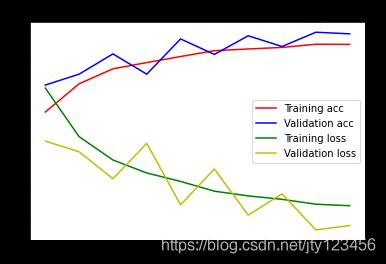
利用训练历史数据中的 训练集精度 、验证集精度 、 训练集损失 、 验证集损失 进行绘图。
由于篇幅的限制,这里只显示训练前10轮的结果。
# hist = model.fit(train_images, train_labels, epochs=2000)
hist = model.fit(X_train, Y_train, epochs=10, validation_data=(X_val, Y_val), use_multiprocessing=True,
                 callbacks=callbacks, workers=3)

model.save_weights(last_weights)
plt.figure()

acc = hist.history['accuracy']
val_acc = hist.history['val_accuracy']
loss = hist.history['loss']
val_loss = hist.history['val_loss']

epochs = range(len(acc))

plt.plot(epochs, acc, 'r', label='Training acc')  # 'bo'为画蓝色圆点,不连线
plt.plot(epochs, val_acc, 'b', label='Validation acc')
plt.plot(epochs, loss, 'g', label='Training loss')
plt.plot(epochs, val_loss, 'y', label='Validation loss')
plt.title('Training and validation accuracy,Training and validation loss')
plt.legend()  # 绘制图例,默认在右上角

plt.show()
Epoch 1/10
507/507 [==============================] - ETA: 0s - loss: 0.7083 - accuracy: 0.6326
Epoch 00001: val_accuracy improved from -inf to 0.71778, saving model to best_weights.h5
507/507 [==============================] - 27s 52ms/step - loss: 0.7083 - accuracy: 0.6326 - val_loss: 0.5411 - val_accuracy: 0.7178
Epoch 2/10
506/507 [============================>.] - ETA: 0s - loss: 0.5550 - accuracy: 0.7220
Epoch 00002: val_accuracy improved from 0.71778 to 0.75222, saving model to best_weights.h5
507/507 [==============================] - 24s 48ms/step - loss: 0.5550 - accuracy: 0.7219 - val_loss: 0.5073 - val_accuracy: 0.7522
Epoch 3/10
505/507 [============================>.] - ETA: 0s - loss: 0.4814 - accuracy: 0.7689
Epoch 00003: val_accuracy improved from 0.75222 to 0.81611, saving model to best_weights.h5
507/507 [==============================] - 22s 43ms/step - loss: 0.4814 - accuracy: 0.7690 - val_loss: 0.4222 - val_accuracy: 0.8161
Epoch 4/10
505/507 [============================>.] - ETA: 0s - loss: 0.4405 - accuracy: 0.7889  - ETA: 20s - loss: 0.4878 - accuracy: 0.7679
Epoch 00004: val_accuracy did not improve from 0.81611
507/507 [==============================] - 22s 43ms/step - loss: 0.4405 - accuracy: 0.7888 - val_loss: 0.5340 - val_accuracy: 0.7522
Epoch 5/10
505/507 [============================>.] - ETA: 0s - loss: 0.4138 - accuracy: 0.8080
Epoch 00005: val_accuracy improved from 0.81611 to 0.86333, saving model to best_weights.h5
507/507 [==============================] - 22s 43ms/step - loss: 0.4139 - accuracy: 0.8079 - val_loss: 0.3400 - val_accuracy: 0.8633
Epoch 6/10
507/507 [==============================] - ETA: 0s - loss: 0.3830 - accuracy: 0.8263
Epoch 00006: val_accuracy did not improve from 0.86333
507/507 [==============================] - 22s 44ms/step - loss: 0.3830 - accuracy: 0.8263 - val_loss: 0.4532 - val_accuracy: 0.8144
Epoch 7/10
505/507 [============================>.] - ETA: 0s - loss: 0.3678 - accuracy: 0.8317
Epoch 00007: val_accuracy improved from 0.86333 to 0.87333, saving model to best_weights.h5
507/507 [==============================] - 22s 44ms/step - loss: 0.3683 - accuracy: 0.8316 - val_loss: 0.3075 - val_accuracy: 0.8733
Epoch 8/10
505/507 [============================>.] - ETA: 0s - loss: 0.3574 - accuracy: 0.8366
Epoch 00008: val_accuracy did not improve from 0.87333
507/507 [==============================] - 22s 44ms/step - loss: 0.3573 - accuracy: 0.8366 - val_loss: 0.3748 - val_accuracy: 0.8394
Epoch 9/10
505/507 [============================>.] - ETA: 0s - loss: 0.3417 - accuracy: 0.8466
Epoch 00009: val_accuracy improved from 0.87333 to 0.88444, saving model to best_weights.h5
507/507 [==============================] - 22s 44ms/step - loss: 0.3420 - accuracy: 0.8466 - val_loss: 0.2609 - val_accuracy: 0.8844
Epoch 10/10
506/507 [============================>.] - ETA: 0s - loss: 0.3371 - accuracy: 0.8463
Epoch 00010: val_accuracy did not improve from 0.88444
507/507 [==============================] - 23s 45ms/step - loss: 0.3371 - accuracy: 0.8462 - val_loss: 0.2748 - val_accuracy: 0.8794
评估准确率
接下来,比较模型在测试数据集上的表现:
在模型训练期间,会显示损失和准确率指标。
经过10轮的训练后,此模型在训练数据上的准确率达到了 0.8462(或 84.62%)左右。
结果表明,模型在测试数据集上的准确率略低于训练数据集。训练准确率和测试准确率之间的差距代表过拟合。
过拟合是指机器学习模型在新的、以前未曾见过的输入上的表现不如在训练数据上的表现。
过拟合的模型会“记住”训练数据集中的噪声和细节,从而对模型在新数据上的表现产生负面影响。
使用训练好的模型
最后,使用训练好2000轮的模型对测试集中的图像进行预测,并输出结果到csv文件。
读取测试集
方法同 读取训练集
model.load_weights(save_weights)

directory_name = "test/test/"
for i in range(18001, 23709):
    # print(filename) #just for test
    # img is used to store the image data
    # img = cv2.imread(directory_name + str(i) + ".jpg", cv2.IMREAD_GRAYSCALE)
    img = cv2.imread(directory_name + str(i) + ".jpg")
    img = img / 255.0
    img = cv2.resize(img, (image_size, image_size))
    array_of_img.append(img)
test_images = np.array(array_of_img)
del array_of_img
# test_images = test_images.reshape(test_images.shape[0], image_size, image_size, 1)
# test_images = test_images.astype('float32')
# probability_model = tf.keras.Sequential([model,tf.keras.layers.Softmax()])
# predictions = probability_model.predict(test_images)
测试集中有 5708 个图像。同样,每个图像都由 100x100 个像素表示,包含3个通道:
test_images.shape
(5708, 100, 100, 3)
predictions = model.predict(test_images)
results = np.argmax(predictions, axis=1)
submissions = pd.read_csv('test.csv')
submissions['label'] = results
submissions.to_csv('submission.csv', index=False)
检验预测结果
在上例中,模型预测了测试集中每个图像的标签。我们来看看第一个预测结果:
np.set_printoptions(suppress=True)
predictions[0]
array([0.00002822, 0.99997175], dtype=float32)
预测结果是一个包含 2 个数字的数组。它们代表模型对 2 种不同性别中每种性别的“置信度”。您可以看到哪个标签的置信度值最大:
gender = np.argmax(predictions[0])
因此,该模型非常确信这个图像是女性,或 class_names[1]。
class_names[gender]
‘female’
最后,我们随机显示对25张图片的预测。
即使模型最终的精度达到了0.92887,也会有预测错误的情况。
plt.figure(figsize=(10,10))
for i in range(25):
    plt.subplot(5,5,i+1)
    plt.xticks([])
    plt.yticks([])
    plt.grid(False)
    sample = random.randint(0, 5707)
    plt.imshow(test_images[sample][:,:,::-1])
    plt.xlabel(class_names[results[sample]])
plt.show()


