李宏毅《机器学习》笔记 DAY2 回归
回归定义
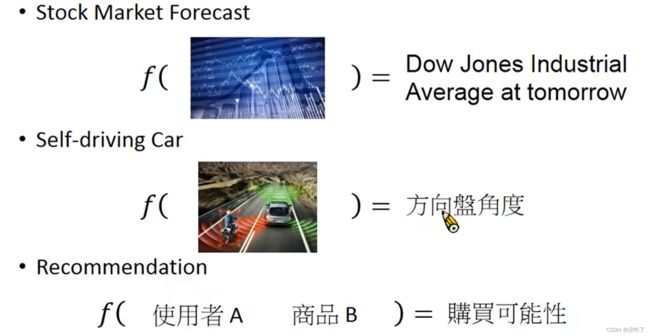
Regression 就是找到一个函数function,通过输入特征x,输出一个数值Scalar。
应用例子:
模型步骤
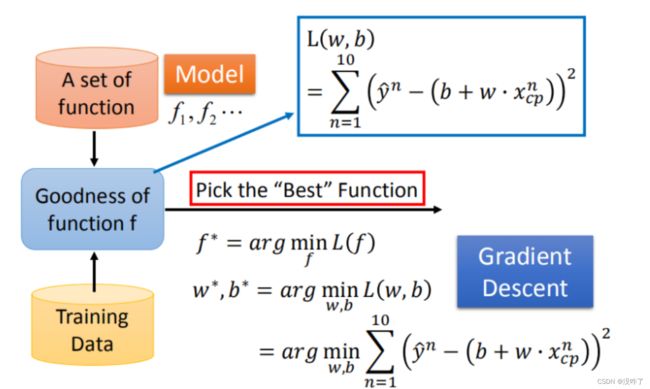
- 模型假设,选择模型框架(线性模型)
- 模型评估,如何判断众多模型的好坏(损失函数)
- 模型优化,如何筛选最优的模型(梯度下降)
Step 1:模型假设 - 线性模型
一元线性模型(单个特征)
多元线性模型(多个特征)
Step 2:模型评估 - 损失函数
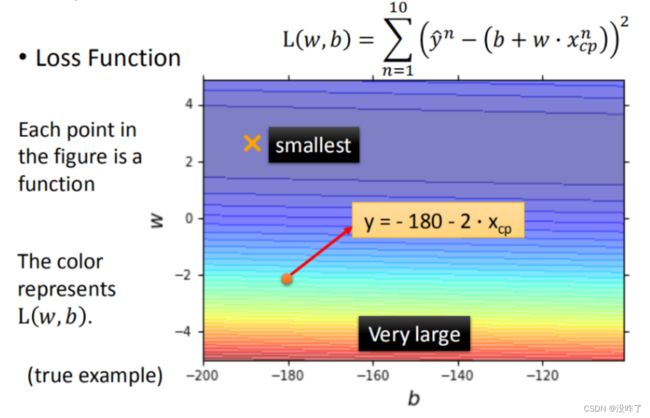
使用损失函数(Loss function)来衡量模型的好坏,统计10组原始数据损失函数的和,和越小模型越好。^ 所代表的是真实值。
- 图中每一个点代表着一个模型对应的 w 和 b
- 颜色越深代表模型更优
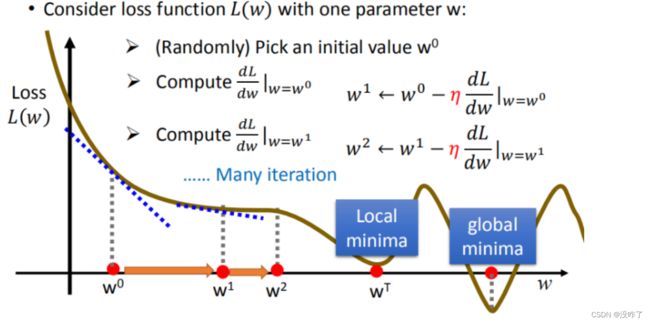
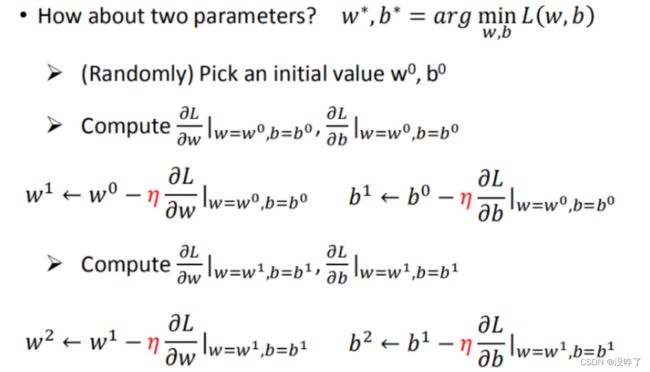
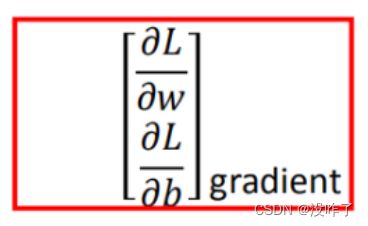
Step 3:最佳模型 - 梯度下降
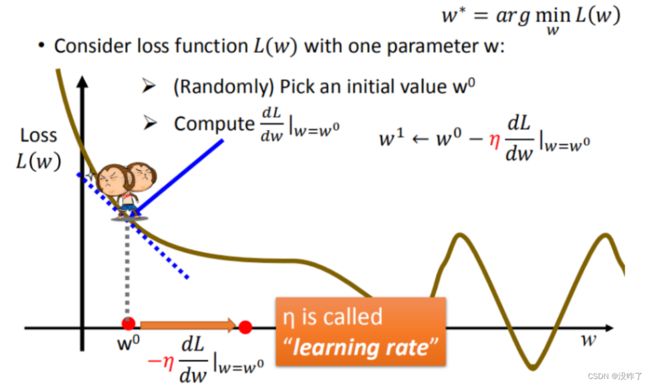
筛选最优的模型(参数w,b),需要找到一个令结果最小的 f^*。( 学习率 :移动的步长,η)
- 随机选取一个 w^0
- 计算微分,也就是当前的斜率,根据斜率来判定移动的方向
- 大于0向右移动(增加w)
- 小于0向左移动(减少w)
- 根据学习率移动
- 重复步骤2和步骤3,直到找到最低点
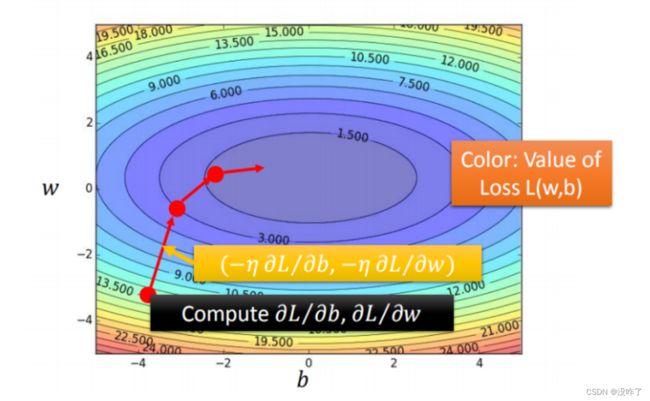
把 w 和 b 在图形中展示:
- 每一条线围成的圈就是等高线,代表损失函数的值,颜色约深的区域代表的损失函数越小
- 红色的箭头代表等高线的法线方向
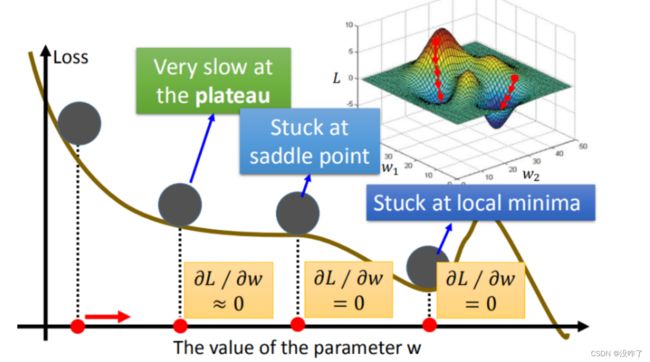
通过梯度下降不断更新损失函数的结果,这个结果会越来越小,还会有其他的问题:
- 问题1:当前最优(Stuck at local minima)
- 问题2:等于0(Stuck at saddle point)
- 问题3:趋近于0(Very slow at the plateau)
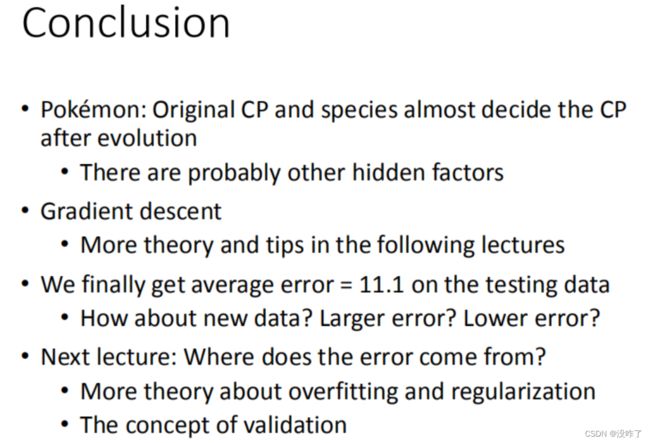
使用训练集和测试集的平均误差来验证模型的好坏。
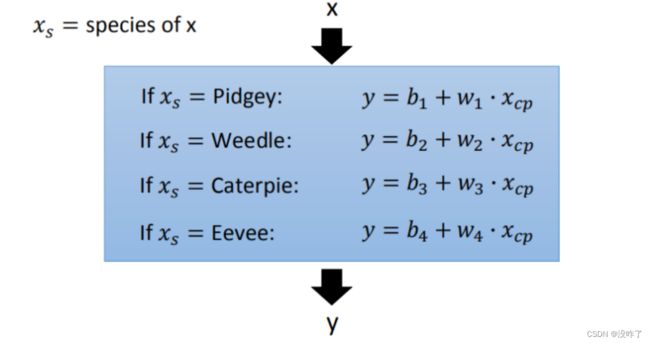
更强大复杂的模型:1元N次线性模型
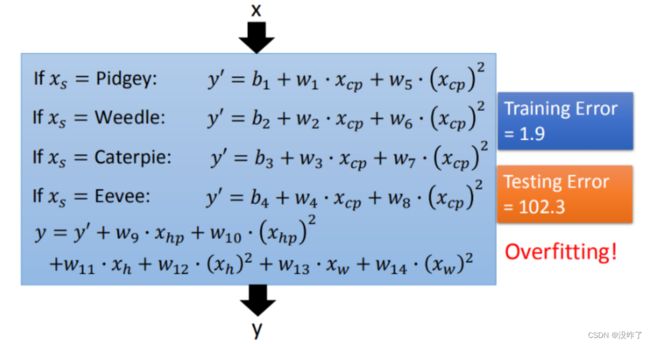
在模型上,我们还可以进一部优化,选择更复杂的模型,但是要注意过拟合的问题。
步骤优化
Step1优化:2个input的四个线性模型是合并到一个线性模型中
Step2优化:如果希望模型更强大表现更好(更多参数,更多input)
在最开始我们有很多特征,图形化分析特征,将血量(HP)、重量(Weight)、高度(Height)也加入到模型中。更多特征,更多input,数据量没有明显增加,仍旧导致overfitting。
Step3优化:加入正则化
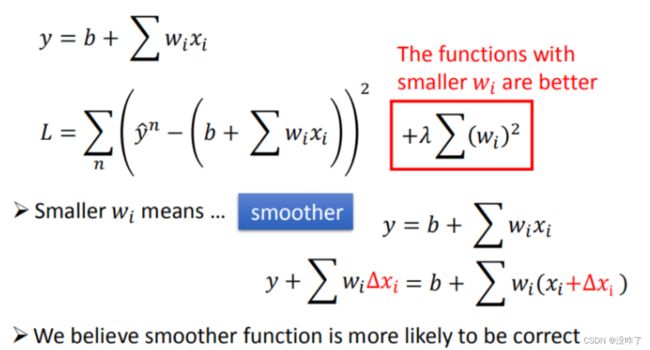
更多特征,但是权重 ww 可能会使某些特征权值过高,仍旧导致overfitting,所以加入正则化。
- w 越小,表示function较平滑的,function输出值与输入值相差不大
- 在很多应用场景中,并不是w越小模型越平滑越好,但是经验值告诉我们w越小大部分情况下都是好的
- b的值接近于0,对曲线平滑是没有影响
代码实现:
import numpy as np
import matplotlib.pyplot as plt
from pylab import mpl

# matplotlib没有中文字体,动态解决
plt.rcParams['font.sans-serif'] = ['Simhei']  # 显示中文
mpl.rcParams['axes.unicode_minus'] = False  # 解决保存图像是负号'-'显示为方块的问题
x_data = [338., 333., 328., 207., 226., 25., 179., 60., 208., 606.]
y_data = [640., 633., 619., 393., 428., 27., 193., 66., 226., 1591.]
x_d = np.asarray(x_data)
y_d = np.asarray(y_data)
x = np.arange(-200, -100, 1)
y = np.arange(-5, 5, 0.1)
Z = np.zeros((len(x), len(y)))
X, Y = np.meshgrid(x, y)
# loss
for i in range(len(x)):
    for j in range(len(y)):
        b = x[i]
        w = y[j]
        Z[j][i] = 0  # meshgrid吐出结果:y为行,x为列
        for n in range(len(x_data)):
            Z[j][i] += (y_data[n] - b - w * x_data[n]) ** 2
        Z[j][i] /= len(x_data)
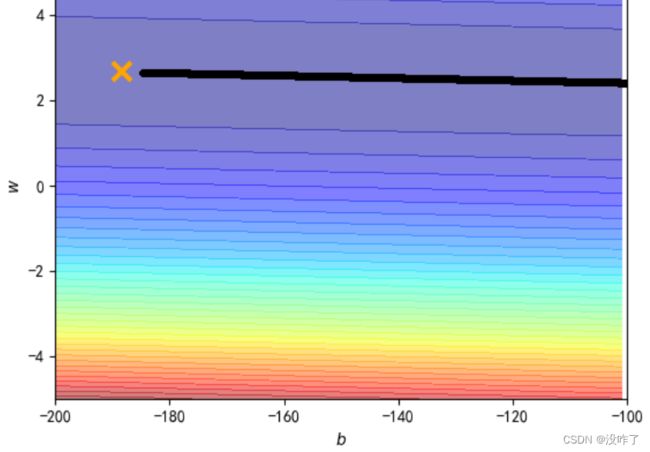
# linear regression
b=-2
w=0.01
lr = 0.000005
iteration = 1400000

b_history = [b]
w_history = [w]
loss_history = []

import time
start = time.time()

for i in range(iteration):
    m = float(len(x_d))
    y_hat = w * x_d  +b
    loss = np.dot(y_d - y_hat, y_d - y_hat) / m
    grad_b = -2.0 * np.sum(y_d - y_hat) / m
    grad_w = -2.0 * np.dot(y_d - y_hat, x_d) / m
    # update param
    b -= lr * grad_b
    w -= lr * grad_w

    b_history.append(b)
    w_history.append(w)
    loss_history.append(loss)
    if i % 10000 == 0:
        print("Step %i, w: %0.4f, b: %.4f, Loss: %.4f" % (i, w, b, loss))

end = time.time()
print("大约需要时间:",end-start)

# plot the figure
plt.contourf(x, y, Z, 50, alpha=0.5, cmap=plt.get_cmap('jet'))  # 填充等高线
plt.plot([-188.4], [2.67], 'x', ms=12, mew=3, color="orange")
plt.plot(b_history, w_history, 'o-', ms=3, lw=1.5, color='black')
plt.xlim(-200, -100)
plt.ylim(-5, 5)
plt.xlabel(r'$b$')
plt.ylabel(r'$w$')
plt.title("线性回归")
plt.show()
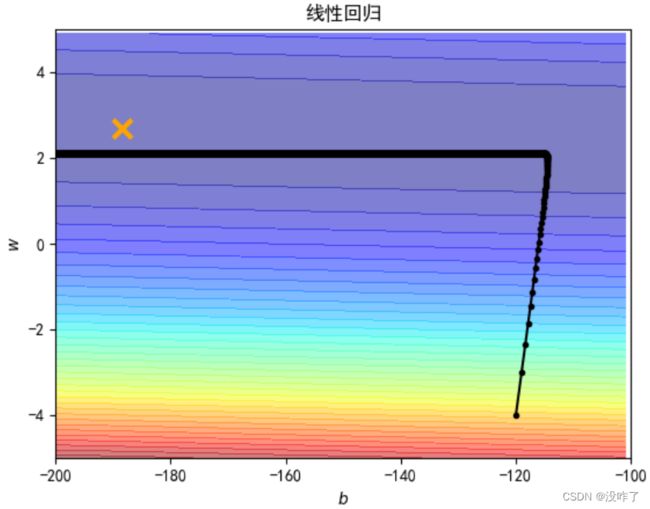
给b和w特制化两种learning rate
# linear regression
b = -120
w = -4
lr = 1
iteration = 100000

b_history = [b]
w_history = [w]

lr_b=0
lr_w=0
import time
start = time.time()
for i in range(iteration):
    b_grad=0.0
    w_grad=0.0
    for n in range(len(x_data)):
        b_grad=b_grad-2.0*(y_data[n]-n-w*x_data[n])*1.0
        w_grad= w_grad-2.0*(y_data[n]-n-w*x_data[n])*x_data[n]

    lr_b=lr_b+b_grad**2
    lr_w=lr_w+w_grad**2
    # update param
    b -= lr/np.sqrt(lr_b) * b_grad
    w -= lr /np.sqrt(lr_w) * w_grad

    b_history.append(b)
    w_history.append(w)

# plot the figure
plt.contourf(x, y, Z, 50, alpha=0.5, cmap=plt.get_cmap('jet'))  # 填充等高线
plt.plot([-188.4], [2.67], 'x', ms=12, mew=3, color="orange")
plt.plot(b_history, w_history, 'o-', ms=3, lw=1.5, color='black')
plt.xlim(-200, -100)
plt.ylim(-5, 5)
plt.xlabel(r'$b$')
plt.ylabel(r'$w$')
plt.title("线性回归")
plt.show()